S. Balaselvakumar et al. Int. Journal of Engineering Research and Applications
www.ijera.com
ISSN : 2248-9622, Vol. 5, Issue 5, ( Part -3) May 2015, pp.108-117
Landuse and Landcover Change Detection in Lalgudi Block,
Tiruchirappalli District - Using Remote Sensing and GIS
Techniques
S. Balaselvakumar
*, P. Sujatha and A. Ilanthirayan
*
Department of Geography, Periyar E.V.R. College (Autonomous), Tiruchirappalli - 620 023
ABSTRACT
In this paper an attempt has been carried out mapping and analysis the landuse and landcover change detection in Lalgudi block of Tiruchirappalli district using remote sensing and GIS techniques. The total area of the study area is 272.2 sq.km. It is located in the central part of Tamil Nadu. Landuse and Landcover change detection maps were generated and classified into agriculture land, built-up land, fallow land, natural vegetation, river sand, water bodies, and scrub without scrub land for the year 1990, 2000 and 2010 based on NRSA classification. Each landuse and landcover has been changed positively and negatively for the three decades, especially agriculture land, sandy area, natural vegetation and fallow land, which is about 19.62%, 6.56%, 13.16% and 14.91 percentages respectively.
I.
INTRODUCTION
Land is the basic resource of human society. It is the most significant among the natural resources of the country and most of its inhabitants depend on agriculture for their livelihood. Land is being used by people for various purposes. The basic requirement of human society is food. Farmers produce food from the land. The second important basic need of the people is home. It takes a very higher priority in its demand of land. The other need of mankind is work. For that, land can provide right location for work place or industries. The fourth need is recreation and fifth is the communication. These also require land, but, agricultural areas should not be considered for allotment for these purposes. Only lands not suitable for agriculture should be taken into consideration.
Land use change always been of involves interest to geographers. This topic of geographic research is in land use change identification, location and mapping the sites and areas of different types of change and by updating the existing land use records and maps. The above said information is important in providing an updated inventory of the existing land resources that are being used by human beings. Using this information on change, the interaction among the forces and the effects of land use change on associated attributes such as land quality, land value and tenure can be studied in a comprehensive manner Bryant (1976). These investigations often enhances the knowledge, and provide a sound basis, from which better management and planning policies,
regarding land resources. Thus there is no doubt of the importance of an efficient and accurate acquisition procedure to obtain this change information. Anderson (1971) has studied the land use classification using recent geographic applications of remote sensing and Rhind and Hudson (1980) have described the urban land use model in Britain.
Jensen (1981) explains change detection can be performed manually by means of visual digital change detection techniques have been developed.
Gautam et.al., (1982) has been studied the use remote sensing technique in land use within a very short time and accurate manner. The present are also mapping and analysis the landuse and landcover change detection in Lalgudi block of Tiruchirappalli district.
II.
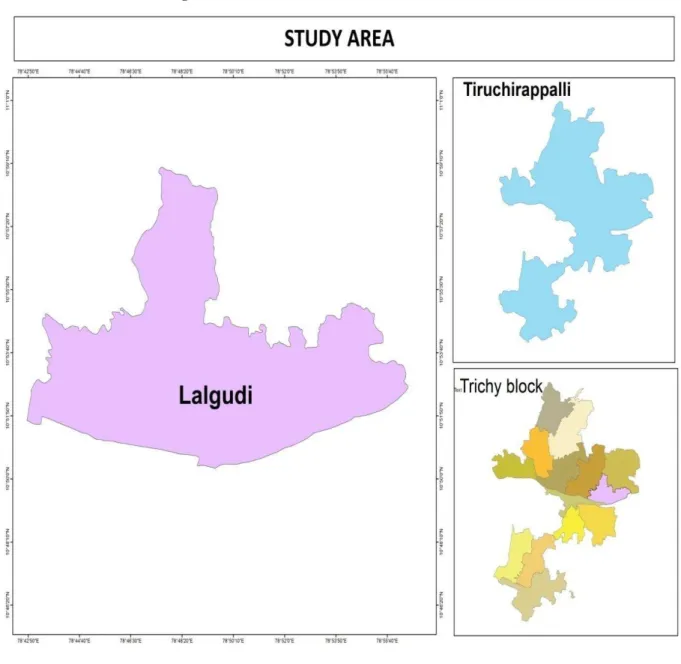
STUDY AREA
The study area is located in the eastern part of Tiruchirappalli district of Tamil Nadu State. It is surrounded by Northern side in the Manachanallur, Southern side in the Thiruverambur, Eastern side in the Pullambadi and Western side in the Andanallur block. It lies between the North latitude of 10050’N to 110 55’ N and East longitude of 780 45’ E to 780 55’ E and covering the Survey of India topographic sheet no 58 M/ 16, 4, 8 in Fig 1 and it has an area of 272.5 sq.km. The study area is well connected by Road and Railway transport. The block contains 53 revenue villages and two town Panchayats.
S. Balaselvakumar et al. Int. Journal of Engineering Research and Applications
www.ijera.com
ISSN : 2248-9622, Vol. 5, Issue 5, ( Part -3) May 2015, pp.108-117
Majority of the area is raised paddy crop in two seasons. Apart from paddy, they raised sugarcane and banana. Nationalized banks & Agri-co- operative societies helped the farmers to improve their
agriculture operations.
S. Balaselvakumar et al. Int. Journal of Engineering Research and Applications
www.ijera.com
ISSN : 2248-9622, Vol. 5, Issue 5, ( Part -3) May 2015, pp.108-117
Fig 1. 2. LOCATION MAP OF THE STUDY AREA
III.
OBJECTIVES
The main objectives of the study To prepare landuse and landcover map and analysis the change detection for the years 1990, 2000 and 2010.
IV.
METHODOLOGY
The survey of India Toposheets of 58 M/ 16, 4, 8 in 1:50,000 scale of Lalgudi block is registered, digitized and analyzed with the help of Arc GIS and ERDAS imagine software for landuse and landcover change detection analysis in the years 1990, 2000 and 2010.
Totally, seven landuse and landcover classes were established in the study area, as agriculture land, built-up land, fallow land, natural vegetation, scrub without scrub land, water bodies and sandy area. Two dated LANDSAT images and one
LISS- III images were compared with supervised classification technique. In the supervised classification technique, three images with different years are independently classified.
V.
LANDUSE AND LANDCOVER
CHANGE DETECTION IN
LALGUDI BLOCK 1990, 2000 AND
2010
Landuse and Landcover change detection were analyzed and discussed as given below. (Table .1 and Fig 3.)
5.1 AGRICULTURE LAND
S. Balaselvakumar et al. Int. Journal of Engineering Research and Applications
www.ijera.com
ISSN : 2248-9622, Vol. 5, Issue 5, ( Part -3) May 2015, pp.108-117
built-up land, water bodies, and scrub land, they are analyzed detailed in change detection part.
In 1990 landuse and landcover map were prepared to understand the various aspects of the landuse and the changes, which is occurred during the period from 1980 to 1990. In 1990 landuse has covered an area of 136.78 sq.km. In the year, land under agriculture was very vast, because it has been used for farming and production of food, commercial and horticulture crops. It includes land under crops irrigated and un-irrigated cash crop, pulses, etc, Crop land is the major landuse category observed in this block. This particular land has undergone drastic changes in the area. Most of the agriculture lands were located around the settlements in all the villages. When the agriculture land is compared form the year 1990 to 2000, the agriculture land area was decreased -2.87 percentages. The agriculture lands have been located in the southern part of the villages of Khookur, Edayathumangalam, Sathamangalam, Athikudi, Koppavali, Jengamarajapuram, Nerunjalakudi, Pambaramsuthi, Sathamangalam, Eastern side of the village Sirumayangudi, Sembarai, Komakudi, Mettupatti, Keelaanbil, Ariyur, Natham, Mangudi, Alangudimahajanam, Nagar, Western side of the village Alakkudi, Edayathumangalam, Maruthur, Keelaperungavur, Sirumaruthur, Pudukudi, Northern side of the villages Agalanganallur, Puthuuthamanur, Makilambadi, R.Valavanur, Peruvalanallur and Tachankurichchi. The block has been seen busy agriculture activities in 1990 higher than the year.
In 2000 the agriculture land occupied an area of 133.91sq.km. In 1990 compare to 2000 agriculture land has been decreased in (-4%) was there, because of the land converted to scrub without scrub land and fallow land. Agriculture land are found in the villages Edayathumangalam, Southern part of Khookur, Sathamangalam, Athikudi, Koppavali, Jengamarajapuram, Nerunjalakudi, Pambaramsuthi, Sathamangalam, and eastern side of Sirumayankudi, Sembarai, Komakudi, Mettupatti, Keelaanbil, Ariyur, Natham, Mangudi, Alangudi, Mahajanam and Nagar.
In 2010 agriculture land area was found in 129.91sq.km. In 2000 compared to 2010 agriculture land was decreased to -6.87%, because of the land converted into scrub without scrub land and fallow land and built up land. They are located in the villages western part of Alakkudi, Edayathumanalam, Maruthur, Keelaperungavur, Sirumaruthur, Pudukudi, Valadi, R.Valavanur, T.valavanur, and Esanakorai. The overall agriculture land changes are 19.62% in this block. It shows the different landuse pattern and their proportion to the total area.
5.2. BUILT –UP-LAND
The present study area covers 45 villages. Among the villages, based on the size of the population to leads all portion in Puvalur and Lalgudi of the study area. The major settlements are categorized based on the density of the population. The major national high way is Musiri-Lalgudi- Ariyalur District. The population of the study area is ranging maximum 1000-4999 in the entire regions and minimum ranging is 500-999. It is defined as an area of human habitation developed due to non agriculture area. This study area has covers of building, transport, and communication, utilities association with water, vegetation and vacant lands. Migration of people is from rural to urban has become quite common. The built up land is increasing day by day. The built up land has spread all over the entire study area. The built- up land I& II (urban and suburban) is occupied an area of 17.51sq.km and 20.91sq.km in the year.
In 1990 compared to 2000 the built-up I and II has increased to (1.91) and (2%). Built-up land has been located in the villages of Puthuuthamanur, Northern part of Aglanganallur, Mahilambadi, R. Valavanur, Peruvalanallur, Tachankurichi, Southern side in Khookur, Edayathumangalam, Sathamangalam, Athikudi, Koppavali, Jengamarajapuram, Nerunjalakudi, Pambaramsuthi, Sathamangalam, Eastern side of Sirumayankudi, Sembarai, Komakudi, Mettupatti, Keelaanbil, Ariyur, Natham, Mangudi, Alangudi, Magajanam, Nagar, Western side of Alagudi, Edayathumangalam, Maruthur, Keelaperungavur, Sirumaruthur, Pudukkudi, Valadi, R.valavanur, T.valavanur, Esanakorai. This area of built-up land concentration has been lower than the year 1990.
In 2000 built-up land I and II occupied an area of 19.24sq.km and 22.91sq.km. In 2000 compared to 2010 the built-up lands were increased in (2.2%) and (1.33%) respectively. Built-up land I denotes urban settlements, where as built-up land II indicates rural settlements, because of migration of rural settlements converted to urban settlements due to the reason of school, colleges, government offices, transportation and other facilities. The given village settlements ware extended in this block, such as Northern side Agalanganallur, Puthuuthamanur, Mahilambadi, R.valavanur, Peruvalavanur, Tachankurichi, Southern part Khookur, Edayathumangalam, Sathamangalam, Athikudi, Koppavali, Jengamarajapuram and Erunjalakudi.
S. Balaselvakumar et al. Int. Journal of Engineering Research and Applications
www.ijera.com
ISSN : 2248-9622, Vol. 5, Issue 5, ( Part -3) May 2015, pp.108-117
Thachankurichi, Khookur, Edayathumangalam, Sathamanngalam, and Athikudi. Particularly North to Eastern side, the settlements was highly concentrated in this block. The built-up land has been increased day by day due to population density from the category of scrub land, agriculture land fallow lands. The transportation facilities have been well developed in this block. The built-upland I and II has increased in this block from 1990 to 2010 which is 11.73 and 9.51%.
5.3 FALLOW LAND
Fallow land is also an agriculture land but temporarily not used for cultivation. It is described as an area under agriculture land, which is taken up for cultivation but temporarily allowed to rest un-cropped one or more seasons but less than one year. Waste land is described as degraded land. It can be brought under vegetative cover with reasonable efforts but at present they are unutilized and are deteriorating due to the lack of appropriate land, water, and soil management or on account of natural cause. Land with scrub, it is one of the waste lands categories. It is generally associated with foothills, bazadas, relatively high topography like the upland, the high ground area covered by a thin veneer of soils, eroded lands, and badland topography and so on.
The lands were demarcated in the north part of the study area. The fallow land is identified to be as (12.08sq.km) in the year of 1990. In 1990 compared to 2000 the fallow lands increased in (2.44%) were in use. In this period, fallow lands were found in the area of Agalanganallur, Puthuuthamanur, Mahilambadi, R.Valavanur Peruvalanallur, Tachankurichi, southern side of Khookur, Edayathumangalam, Sathamangalam, Athikudi, Koppavali, Jengamarajapura. Nerunjalagudi, Pambaramsuthi, Eastern part of Sirumayankudi Sembarai and Komakudi. Especially the northern side is mostly covered with fallow land in this block.
In 2000 the fallow land occupied an area of 14.52sq.km. This land has increased because of the changes in monsoon, it is natural. When a land in the neighbourhood of a township goes waste due to density of population, then, for housing, some of that land can be probably converted into built-up lands. In 2000 compared to 2010 the fallow land (2.78%) had been increased in this block. The fallow land is in high concentration in north to south particularly in the villages of Agalanganallur, Puthuuthamanur, Mahilambadi, R.Valavanur, Peruvalanallur, Tachankurichi, Khookur, Edayathumangalam, Sathamangalam, Athikudi, Koppavali, Alakudi and Maruthur.
In 2010 Fallow land occupied an area of (16.30 sq.km). In 2010 compared to 1990 the fallow lands were increased to (5.22%). The increase was found in
the villages of Sembarai, Eastern side of Sirumayankudi, Komakudi, Mettupatti, Keelaanbil, Ariyur, Natham, Mangudi, Alangudi, Mahajanam, Nagar, western part of Alakkudi, Edayathumangalam, Maruthur, Valadi, R.valavanur, T.valavanur, and Esanakorai. The fallow land was increased due to changes of monsoon over a long period. So that, two cropping system have been brought down into a single crop system in the field. This fallow land must have been the area on the Eastern side of settlement and house plots in the neighborhood of the major developing town like revenue villages namely Manachanallur, lalgudi, and Pullambadi. From 1990 to 2010 fallow land had over all changes is 14.91%.
5.4 NATURAL VEGETATION
The natural vegetation is located over the entire block. The area category of Landuse for natural vegetation was found in 31.52 sq.km. The plantation was highly concentrated in the year 1990. Particularly in the western part of villages Alakudi, Edayathumangalam, Maruthur, Keelaperungavur, Sirumaruthur, Pudukudi, Valadi, R.valavanur, T.valavanur, Esanakorai, Eastern side of Sirumayankudi, Sembarai, Komakudi, Mettupatti, Keelaanbil, Ariyur, Natham, Mangudi, Alangudi and Mahajanam.
In 1990 compared to 2000 plantation, natural vegetation has decreased -3.42% in this block. In 2000 this area occupied 28.10 sq.km. In the year of 2000 compared to 2010 natural vegetation had decreased -1.19% in the study area. It was identified in villages on the southern side of Khookur, Edayathumangalam, Athikudi, Nerunjalakudi, Pambaramsuthi, Sathamangalam, Mettupatti, Mangudi, Alankudi and Ariyur.
In 2010, it was identified in an area of 26.91 sq.km. In 1990 compared to 2010 the natural vegetation has decreased in -4.61%. It is mostly found in the villages, such as Sirumayankudi, Sembarai, Komakudi, Mettupatti, Keelaanbil, Ariyur, Natham, Mangudi, Alangudi and Mahajanam. In this block natural vegetation was decreased because of shortage of irrigation facilities and changes of monsoon, soil erosion and flood in a particular season. So that, in this area of land has been converted into built-up land. From 1990 to 2010 natural vegetation had over all changes is. 13.16%. 5.5 WATER BODIES
S. Balaselvakumar et al. Int. Journal of Engineering Research and Applications
www.ijera.com
ISSN : 2248-9622, Vol. 5, Issue 5, ( Part -3) May 2015, pp.108-117
part of the Pullivalam and Pirammangalam villages. A canal has been identified in the north and the central and the south parts of the study area. The canal flows from north to south and the southeast direction and finally it joins the river Cauvery. A number of streams are noticed throughout the study area, in which the southern streams have been perennial.
During 1990, it an area of 22.58sq.km was observed. In 1990 compared to 2000 river sand -2.34% has increased. In villages such as Khookur, Edayathumangalam, T.Valavanur, Esanakorai, Alagudi, Sathamangalam, Athikudi, Ariyur, Keelanbil, Alangudimahajanam, and Mangudi, it was found.
In 2000 area occupied was 20.24sq.km. In 2000 compared to 2010 water bodies increased -2.2% in these years. In the villages like Edayathumangalam, Khookur, Keelanbil, Ariyur, T.Valavanur and Esanakorai are found.
In 2010 occupied in this area an (18.04sq.km). In 1990 compared to 2010 the water bodies have been decreased -4.54% in this block. In 1990 to 2010 the water bodies had over all changes is 12.96% in this block.
5.6 SCRUBS WITHOUT SCRUB LAND
Land with or without scrub is described as degraded land that can be brought under vegetative cover with reasonable efforts but at present they are un-utilized and are deteriorating due to the lack of appropriate land, water, and soil management or on account of natural cause. Land with scrub, it is one of the waste land categories. It is generally associated with foothills, bazadas, and relatively high topography like the upland, the high ground area covered by a thin veneer of soils, eroded lands, and badlands.
In 1990 the category covered an area of 15.02sq.km. In 1990 compared to 2000 scrub without scrub land has increased in this year 1.08%.
Particularly in the villages of Agalanganallur, Puthuuthamanur, Mahilambadi, R.valavanur, Peruvalavanur, Tachankurichi, Khookur, Edayathumangalam, Sathamangalam, Athikudi, Koppavali and Jengamarajapuram are found.
In 2000 occupied as an area of 16.10qs.km. In 2000 compared to 2010 scrub without scrub land has 2.98% decreased in this block. Some villages in the north to western side of Agalanganallur, Puthuuthamanur, Mahilambadi, R.valavanur, Peruvalavanur, Alakudi, Edayathumangalam, Maruthur, Keela Perungavur, Sirumaruthur, Pudukudi, Valadi and Esanakorai scrub lands were found.
In 2010 the scrub land area had increased, which is 19.08 sq.km. In Compared 1990 to 2010 scrub land had increased in this land type by 4.06%. Recently scrub or without scrub land has been converted to in built-up land. From 1990 to 2010 they had scrub without scrub land over all changes is 11.59%.
5.7 RIVER SAND
The river sand is that sand that is spread over in the river bed. It was noted in the southern side of Kollidam River and Cauvery river basin .The area observed in this category was 16.10 sq.km.
In 1990 compared to 2000 the river sand had been increased to 1.2%. The area observed in this category was 17.30 sq.km.
In 2000 compared to 2010 the river sand has increased to 1.1%. It was noted in Kollidam and Cauvery river basin. In the river much of the sand has been found in this place from south to north but southern side was mostly covered by villages of Alakudi, Esanakorai, T.valavanur, Edayathumangalam, Khookur, Sathamangalam, Athikudi, Keelanbi, Ariyur, Alangudimagajanam, Mangudi, Thachankurichi and Mahilambadi.
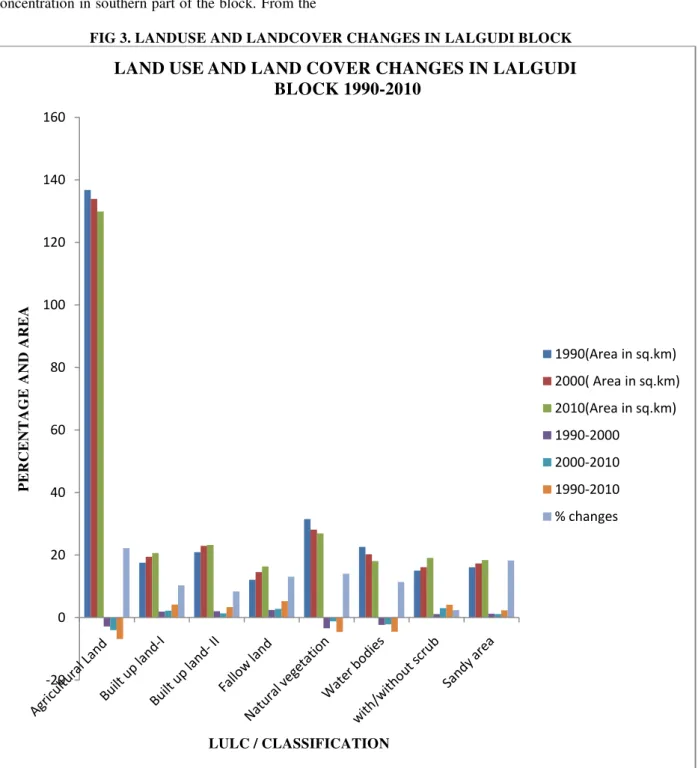
TABLE.1 LANDUSE AND LANDCOVER CHANGES
Description L an d Ar ea in s q .k m -(1 9 9 0 ) L an d Ar ea in s q .k m -(2 0 0 0 ) Lan d Ar ea in s q .k m -(2 0 1 0 ) L an d Ar ea C h an g e in sq .k m 1990 -2 0 0 0 L an d Ar ea C h an g e in sq .k m 2000 -2 0 1 0 L an d Ar ea C h an g e in sq .k m 1990 -2 0 1 0 C h an g es o f L an d in %
Agricultural Land 136.78 133.91 129.91 -2.87 -4 -6.87 19.62
Built up land-I 17.51 19.42 20.62 1.91 2.2 4.11 11.73
Built up land- II 20.91 22.91 23.24 2 1.33 3.33 9.51
Fallow land 12.08 14.52 16.30 2.44 2.78 5.22 14.91
Natural vegetation 31.52 28.10 26.91 -3.42 -1.19 -4.61 13.16
Water bodies 22.58 20.24 18.04 -2.34 -2.2 -4.54 12.96
Scrub without scrub 15.02 16.10 19.08 1.08 2.98 4.06 11.59
Sandy area 16.10 17.30 18.40 1.2 1.1 2.3 6.56
S. Balaselvakumar et al. Int. Journal of Engineering Research and Applications
www.ijera.com
ISSN : 2248-9622, Vol. 5, Issue 5, ( Part -3) May 2015, pp.108-117
The river sand occupied an area of 18.40 sq.km. From 1990 to 2010, river sand has increased by 2.3%. Some of the agriculture land is in high concentration in southern part of the block. From the
year 1990 to 2010 compared to water potential was decreased 6.56% in the Lalgudi block.
FIG 3. LANDUSE AND LANDCOVER CHANGES IN LALGUDI BLOCK
-20 0 20 40 60 80 100 120 140 160
P
E
RCENT
AG
E
AND
AREA
LULC / CLASSIFICATION
LAND USE AND LAND COVER CHANGES IN LALGUDI
BLOCK 1990-2010
1990(Area in sq.km)
2000( Area in sq.km)
2010(Area in sq.km)
1990-2000
2000-2010
1990-2010
S. Balaselvakumar et al. Int. Journal of Engineering Research and Applications
www.ijera.com
ISSN : 2248-9622, Vol. 5, Issue 5, ( Part -3) May 2015, pp.108-117
FIG. 4. LANDUSE AND LANDCOVER MAP IN LALGUDI BLOCK
VI.
SUMMERY AND CONCLUSION
Land is non- renewable resource and hence assessment of landuse and landcover in temporal sequence is essential for planning and development of land and water resources. In this context the present study was carried out in Lalgudi block. The landuse and landcover practices of the years 1990, 2000 and 2010, in 1990 landuse and landcover pattern was observed, such as Agriculture land (136.78 ) sq.km, Built-up land I and II (17.51 ) and (20.19 ) sq.km, Fallow land (12.08) sq.km, Natural vegetation (31.52) sq.km, Water bodies (22.58) sq.km, Scrub without scrub land (15.02 ) sq.km and Sandy area (16.10) sq.km.
The year 2000 following landuse and landcover pattern was observed, such as Agriculture land (133.91 ) sq.km, Built-up land I and II ( 19.42 ) and ( 22.91) sq.km, Fallow land (14.52) sq.km, Natural vegetation (28.10) sq.km, Water bodies (20.24) sq.km, Scrub without scrub land (16.10) sq.km and Sandy area (17.30) sq.km.
The year 2010 of LANDSAT satellite data has interpreted, the following landuse and landcover has been observed such as Agriculture land (129.91) sq.km, Built-up land (20.62) and (23.24) sq.km, Fallow land (16.30) sq.km, Natural vegetation (26.91) sq.km, Water bodies (18.04) sq.km, scrub without scrub land (19.08) sq.km and sandy area (18.40) sq.km.
Finally, the 1990, 2000 and 2010 landuse and landcover data has been compared and analyzed that, there will be drastic change in landuse and landcover categories, such as Agriculture land 19.62% , Built-up land I and II 11.73%, and 9.51%, Fallow land 14.91%, Natural vegetation 13.16%, Water bodies 12.96%, Scrub without scrub land 11.59% and sandy area 6.56%.
Mainly a decreasing trend has been identified in the categories of agriculture land, water bodies, and natural vegetation lands. Built-up land, River sand, scrubs without scrub and fallow land shows a trend of increase in this area.
It also helps in identifying the status of various landuse and landcover categories at a particular time. The study area has rural settlements that have been changed in to urban settlements due to the declining process started on agriculture and its allied categories of landuse practices, because of low rainfall, climatic changes migration of population from rural to urban in search of jobs and other infrastructural facilities was found.
REFERENCES
[1] Alexandre Boucher, and Kyriadi, Phaedon C., Super – resolution landcover mapping with indicator geostatistics. Remote Sensing of environment, 15th Oct 2006, Vol. 104, Issue 3, pp 264 – 282. [2] Anderson, James R.,(1971) , Landuse
classification schemes used in selected recent geographic applications of remote sensing
Photogrammetric.Eng,v.37,no.4,p.379-387. [3] Anne Chin, Urban transformation of river
landscapes in a global context. Geomorphology, Sep. 2006, Vol. 79, Issue 3 – 4, pp. 460-487.
[4] Bhamare S.M., and Pagar, M.P., Slope and landuse changes in Kalwan Tahsil, India. Ecology, Environment & Conservation, 2004, 10 (3), pp. 375-381. [5] Chada Narongrit, and Mitsuharu
S. Balaselvakumar et al. Int. Journal of Engineering Research and Applications
www.ijera.com
ISSN : 2248-9622, Vol. 5, Issue 5, ( Part -3) May 2015, pp.108-117
and night time NOAA – AVHRR data. Asian Journal of Geoinformatics, 2000, Vol.1, No.2, pp 41 – 46.
[6] Congalton R.G., et. al., Mapping and monitoring agricultural crops and other landcover in the lower Colorado River basin. Photogrammetric Engineering and Remote Sensing, 1998, Vol. 64 No.11 pp. 1075-1118.
[7] Dhinwa, P.S., et. al., Landuse change analysis of Bharatpur district using GIS. Journal of the Indian Society of Remote Sensing, 1992, Vol.20, No.4, pp. 237-250. [8] Dwivedi R.S., et. al., An integrated decision
tree approach (IDTA) to mapping landcover using satellite remote sensing in support of grizzly bear habitat analysis in the Alberta yellow head ecosystem. Canadian journal of Remote Sensing, Dec. 2001, Vol.27 No.6. [9] Frohn, et. al., Improving artificial neural
networks using texture analysis and decision trees for the classification of landcover. Geosciences and Remote Sensing, Jan. 2005, Vol. 42, No.1, pp. 44-65.
[10] Gesche Krause, et. al., Mapping land – cover and mangrove structures with remote sensing techniques a contribution to a synoptic GIS in support of coastal management in north Brazil environmental management, sep. 2004, Vol. 34, No. 3, pp. 429-440.
[11] Gupta P.K., Utilization of integrated remote sensing technique for coastal geomorphic and geologic data extraction – a case study for Coondapur, South Kanara district (Karnataka).
[12] Hari Shankar, et. al., Application potentials of synthetic aperture radar intergeometry for land-cover mapping and crop-height-estimation. Current Science, 2006, Vol.91. No.6.
[13] He, Y P., et. al., GIS-based hazard mapping and zonation of debris flows in Xiaojiong basin, south western china. Environmental Geology, Dec.2003, Vol.45, No.2, pp. 286-293.
[14] JanaM,M, Management and development of river basins in north Bengal using remote sensing techniques. Journal of the in the society of remote sensing. 1997, vol 25, no.2, pp.1052-111.
[15] Kang,Rambir S., and Marston, Richard A., Geomorphic effects of rural to urban landuse conversion on three streams in the central red bed plains of Oklahoma Research papers, 30th sep.2006, vol.79. issues 3-4, pp.488-506.
[16] Khayingshing Luirei, et.al., geomorphic evidences of geotectonic movements in Dharchula area, northeast kumaun: a perspective of the recent tectonic activity. Journal of the geological society of India, 2006, Vol.67, pp.92-100.
[17]Bryant, C.R. (1976) Farm –generated determinants of land use changes in the Rural –Urban Fringe in Canada, 1961-1975. Ottawa, Lands Directorate, Environment Canada, Technical Report.p.271.