MESFIN TADESSE BEKALO
SUPERVISOR:
FILIBERTO PLA (PhD)- Department of Information systems, Universitat Jaume I,
Castellon, Spain
CO-SUPERVISORS:
PEDRO CABRAL (PhD)- Instituto Superior de Estatística e Gestão de Informação
Universidade Nova de Lisboa, portugal
WERNEN KUHN (PhD)- Institute for geoinformatics (ifgi),University of Munster,
Germany
PEDRO LATORRE (PhD)-Department of Information systems, Universitat Jaume I,
Castellon, Spain
March, 2009
ACKNOWLEDGMENTS
There are many people that deserve heartfelt thanks for their precious contributions to this study. First, I me thankful for European Commission for prestigious Erasmus Mundus scholarship for financing the whole phase of the program. I have many thanks for diligent and dedicated coordinators of the consortium from UJI (Department of Information Systems), University of Munster (IFGI) and New University of Lisbon (ISEGI) and all staff members who are the backbone of the program. I am most grateful to Professor Dr. Filiberto Pla for his tremendous professional support and moral guidance. I will always remain indebted for his valuable comments to shape this work.
Thanks are due to Prof. Dr. Pedro Cabral for introducing me to the multiple application area of GIS and continuous academic support, and comments for this work. My gratitude also goes to Professor Dr. Pedro Latorre for his suggestions and his valuable time to evaluate the work and to Professor Dr. Michael Gould, Prof Dr. Werner Kuhn, Prof. Dr. Hebert Perez-Roses and Prof. Dr. Lubia Vinhas for spending their valuable time on the evaluation of this study.
ABSTRACT
The rapid development of urbanization coupled with fast demographic change and
high demand for land resource requires landuse information for management and
planning activities of urban regions. The advent of geospatial tools has great potential
to long term monitoring and assessment of urban growth and its associated problems
in surrounding landcover. This study analyzes urban landuse/landcover change of
Addis Ababa, Ethiopia, using landsat TM and ETM+ acquired, respectively, in 1986
and 2000. The landcover maps with four classes were generated using the Maximum
Likelihood Algorithm of Supervised Classification. Overall classification accuracy
was tested by Confusion Metrics and Kappa Coefficient. The landcover dynamics in
pattern and quantities were analyzed using selected Spatial Metrics units. It has been
found that tremendous changes in landcover occurred over the study period. The results indicated that the built-up area expanded to 49% with annual growth rate around 3.5% with significant fragmentation and contagion of small and isolated urban patches. Managers and planners could use this data as a decision-support tool for urban and environment management.
KEYWORDS
Remote Sensing
Spatial Metrics
Landuse/landcover map
ACRONYMS
CSA- Central Statistical Authority.
CORINE- Co-ordination of Information on the Environment EEA- European Environment Agency
ETM- Enhanced Thematic Mapper
GIS-Geographic Information System(Science) LC- Landcover
LULCC- Landuse/Landcover Change LU- Landuse
Contents
Abstract………..ii
List of tables………..vi
List of figures………....ix
Acknowledgements………....x
CHAPTER 1. INTRODUCTION…...………1
1. Introduction………1
1.1. Study Background…...…..………..………...………..1
1.1.1. LULCC and geospatial tools………2
1.2. Statement of the problem.………...3
1.3. Objective of the study………...3
1.4. Research Hypothesis and questions………....5
1.5. Significance of the study………..6
1.6. Study Area………...…….6
1.6.1. Physical expansion trend in Addis Ababa……….9
1.6.2. Physiographic nature of the study area…..………..10
1.7 . Organization of the paper.……….……11
CHAPTER 2 .REVIEW OF THE LITERATURES...……….13
2. Introduction………..…13
2.1: History and application of remote sensing……….………...…13
2.2. Landuse and landcover………..………….…….…………...17
2.3 Application of Remote Sensing on LULCC………..……….17
2.4. Urban landuse landcover dynamics……...…...……….19
2.5. GIS and remote sensing for urban land change detection and monitoring…...20
2.6. Remote Sensing of Urban areas…...……….21
2.7. Image classification techniques………23
2.7.1. Pixel Based image classification………....24
2.7.2. Object Oriented image classification………..25
2.7.3. Advanced classification approaches…...………25
2.8. Change detection and analysis techniques……….………..………….26
2.8.1: Change detection overview………. ………..26
2.8.2: Applications and approaches of change detection……...………..26
2.8.4.: Landcover detection and analysis techniques……… ..28
2.9. Spatial Metrics for urban LULCC analysis……….28
CHAPTER3. RESEARCH METHODOLOGY ……….……….30
3. Introduction………..31
3.1. Data source and type………..……….31
3.1.1: data ………..31
3.2: Landcover Nomencluture……….………...34
3.3. Image classification………...……….….………36
3.4: Training site collection………...………..………..37
3.5: Urban landcover change analysis techniqies…..……….37
3.6: Accuracy Assessment………..………38
CHAPTER 4. RESULTS AND ANALYSIS ……….………40
4. Introduction………..………40
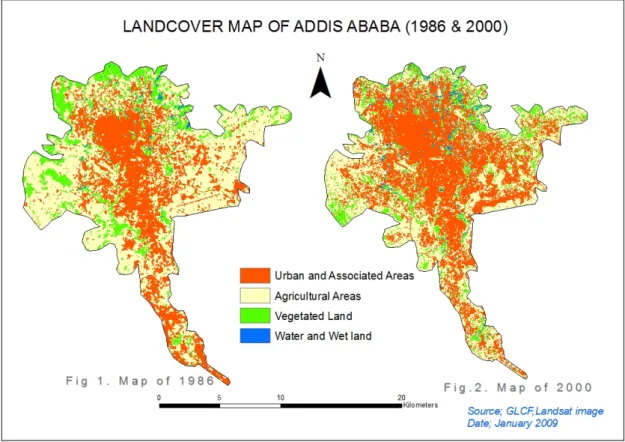
4.1: Landcover maps……….41
4.2: Change detection and reclassification comparision………...42
4.3: Urban LULC analysis using Spatial Metrics……….47
4.3.1: Class area (CA) AND Largest………...48
4.3.2. Number of patches……….………….49
4.3.3. Largest Patch Index (LPI)……….…..…….………...…...49
4.3.4: Edge Density (ED)……….50
4.3.5: Area Weighted Mean Patch Fractal Dimension (AWMPFD)………50
4.3.6: Euclidean Mean Nearest Neighbour (ENN_MN)………..51
4.4. Accuracy Assessment using descriptive analysis………..52
4.4.1. Overall accuracy……….………...53
4.4.2.: Producer’s accuracy……….………54
4.4.3: User’s accuracy……….………54
4.5. Kappa coefficient……… ……….………..55
List of tables
Table. 1.2.Physical growth of Addis Abeba built up area ... 8
Table 3.1. Characteristics of data used ... 32
Table 3.2. landcover classes... 34
Table 3.3. Regrouped landcover classes ... 34
Table 3.4. Spatial metrics used ... 37
Table 4.1 Areas of Landuse classes and changes occurred ... 40
Table 4.2. Built and non built-up areas and changes ... 44
Table 4.3. Spatial Metrics for LULCC ... 47
Table 4.4. Confusion Metrics for landcover map of 1986 ... 51
Table 4.5. Confusion Metrics for landcover map of 2000 ... 52
Table 4.6. Overall accuracy ... 53
List of figures
Figure 1.1. Map of the study area ... 6
Figure 1.2. Total population ... 7
Figure 2.1. Remote sensing process... 13
Figure 2.2. Image classification methods ... 23
Figure 2.3. Mixed Pixel Problem ... 24
Figure 3.1. Flow diagram of the study. ... 30
Figure 4.1. Landcover maps of AA ... 40
Figure 4.2. Built and non built up map ... 42
Figure 4.3. Reclassified maps of 1986 and 2000 ... 43
Figure 4.4. Major urban expansion zones ... 44
Figure 4.5. Urban expansion Zones from 1986 to 2000 ... 46
Figure 4.6. Structure of LU plan of Addis Ababa and expansion areas ... 56
Chapter One
Introduction
1.
Introduction
1.1. Study Background
It is a hot topic in most summits to talk about population explosion, environmental degradation, climate change and other socio-economic challenges. Population increment and land demand for settlement, commercial and industrial expansion and its impact on environment have also been largely raising issues in many discussions. According to the United Nations (UN) and Population Reference Bureau- PRB (2000), the world has experienced a tremendous urban growth and population increment. For the first time in history, more than half of its human population, 3.3 billion people, has been living in urban areas. By 2030, this is expected to swell to almost 5 billion. While the world’s urban population grew very rapidly (from 220 million to 2.8 billion) over the 20th century, the next few decades will see an unprecedented scale of urban growth in the developing world. This will be particularly notable in Africa and Asia where the urban population will double between 2000 and 2030: that is, the accumulated urban growth of these two regions during the whole span of history will be duplicated in a single generation. By 2030, the towns and cities of the developing world will make up 81% of urban population (UNFPA, 2008).
It is widely and increasingly accepted that population growth and urbanization are an inevitable phenomenon. In the developed countries of Europe and North America, urbanization has been a consequence of industrialization and has been associated with economic development. By contrast, in the developing countries of Latin America, Africa, and Asia, urbanization has occurred as a result of high natural urban population increase and massive rural-to-urban migration (Brunn and Williams, 1983).
economic importance of cities is rapidly increasing and the future economic growth will become dependent upon the ability of urban centers to perform crucial service and production functions (Cheema, 1993).
Despite the economic benefits, the rapid rates of urbanization and unplanned expansion of cities have resulted in several negative consequences. Most cities in developing countries are expanding horizontally following the routes of roads and railway networks, the urban sprawl is moving to unsettled peripheries at the expense of agricultural lands and areas of natural beauty and other surrounding ecosystems (Lowton, 1997). Such dynamism in urban landcover can be caused by demographic, economic or industrial factors. Currently, these are the major environmental concerns that have to be analyzed and monitored carefully for effective landuse management and planning. Furthermore, the rapid urban growth and the associated urban landcover changes attracted many researchers to study and monitor the changes.
1.1.1. Landuse/Landcover change and Geospatial tools
The landuse/landcover pattern of a region is an outcome of natural and socio – economic factors and their utilization by man in time and space. Land is becoming a scarce resource due to immense agricultural and demographic pressure. Hence, information on landuse/landcover and possibilities for their optimal use is essential for the selection, planning and implementation of landuse schemes to meet the increasing demands for basic human needs and welfare. This information also assists in monitoring the dynamics of land use resulting out of changing demands of increasing population (Mesev, 2008).
A substantial amount of data of the Earth’s surface are collected using remote sensing tools. Remote sensing provides an excellent source of data from which updated landuse/landcover (LULC) information and changes can be extracted and analyzed efficiently (Bauer et al., 2003).
Since the launch of the first remote sensing satellite (1972), multitemporal and multiresolution satellite data are available in various data archives. These have been used as a base for various environmental studies including urban change analysis. Besides, landsat imageries that have been recorded in the last 30 years using TM, MSS and ETM sensors along with data from new sensors (e.g. ASTER) present a reliable database for long term change detection (Moeller, et al., 2004). The advent of high spatial resolution satellite imagery (e.g. IKONOS and QUICKBIRD) also enables researchers to detect, analyze and monitor detailed changes in an urban environment more efficiently (Jensen and Im, 2007). Some recent research has also been directed towards quantitatively describing the spatial structure of urban environments and characterizing patterns of urban structure through the use of remotely sensed data and spatial metrics (Herold et al., 2002).
Addis Ababa has experienced fastest expansion and changes in landcover. There is very limited information on the extent and pattern of changes occurred over time. Besides, there are no extensive studies conducted related to urban growth and their impacts using remote sensing and spatial metrics. Hence, urban planners and decision makers should consider the potential of geospatial tools to detect, monitor and evaluate the urban landcover changes in the country. In this work, remote sensing and spatial metrics are applied to detect and analyze the urban landcover changes of Addis Ababa between 1986 and 2000. The main objective was to investigate the spatial extent of urban landcover changes and compare the rate of changes using selected spatial metrics. .
1.2. Statement of the problem
landcover dynamics. As compared with other types of landcover such as agricultural land, urban land has smaller area coverage but its impact to the surrounding environment is higher than any other landuse classes. Thus, special consideration and careful assessment are required for monitoring and planning urban development and decision making.
Ethiopia is one of the least urbanized countries in the world. Even for African standards, the level of urbanization is low. According to the Population Reference Bureau’s World Population Data Sheet (2002), while the average level of urbanization for Africa in general was 33% in 2002, Ethiopia had only 15% of its population living in urban areas. Despite of the low level of urbanization and the fact that the country is predominantly rural, there is a rapid rate of urban growth, which is currently estimated at 5.1% per year. The urban population of Ethiopia is concentrated in few urban centers and the urban system of the country is dominated by Addis Ababa, the capital, with 28.4% of the total urban population of the country (CSA, 1998). Therefore, the city has experienced rapid physical expansion to the periphery at the expense of other landcover classes, though this has not been properly controlled by appropriate planning intervention. Almost none of the plans prepared at different times have been done using information from Geospatial data and tools of GIS (ORAAMP, 1999).
In addition to low level of geo-information to figure out the extent and pattern of the change in the study area, there is also still serious shortage of geospatial information to predict the future growth and dynamics of the city. This in turn can negatively affect the decision making process of urban, regional and environmental planners. Therefore, the purpose of the study was to detect, analyze and compare the relative urban landcover changes of Addis Ababa, Ethiopia.
1.3. Objectives of the study
information, which can be used for management of urban landcover and other environmentally sensitive non built up areas around the city. The following were also some of the specific objectives of this work:
¾ Identifying the landcover/landuse change and examining the change dynamics at different spatial and temporal scales;
¾ to produce a landuse/landcover map of the study area;
¾ to identify the trend, nature, rate, location and magnitude of landuse/ land cover change;
¾ to quantify and investigate the characteristics of urban landcover over the study area based on the analysis of landsat TM and landsat ETM+; ¾ to analyze and examine the changes using spatial metrics;
¾ to compare the dynamics of urban environment considering different time frame;
¾ to assess the accuracy of the classification techniques using Error Matrix (Confusion Matrix) and Kappa statistics and
¾ to put forward a recommendation or set of recommendations that may form the basis for a sound solution for decision makers.
1.4: Research hypothesis and questions
This study was based on the hypothesis that there have been considerable urban landcover changes in the study areas. It was also based on the hypothesis that the rate of the change is particularly high since 1986 which marked as a landmark for high population growth of the city. With regardless of any other land cover classes, the city has been expanded to all directions particularly horizontal expansion to all major road networks at the periphery. In order to assist the analysis, the following research questions were also posed:
¾ Whether there have been major changes in the urban environment of the study areas or not.
¾ What was the spatial extent of the landcover change and where was the highest rate of changes?
1.5: Significance of the study
This study tried to quantify and analyze the changes between 1986 and 2000 to contribute in the urban land, environmental management and monitoring plan of the areas. Therefore, it is expected to:
¾ Provide basic information on the status and dynamics of the urban landcover of the area and the potential of satellite imageries for such purpose. It is also expected to identify the rate of urban growth and urban landcover changes in different times.
¾ Present basic spatial metrics and remote sensing methodologies to detect and analyze urban landcover changes and present the potential of these tools for extracting land related information in the country.
¾ Assist environmentalists, regional and urban planners to consider the potential of geospatial tools for monitoring and planning urban environment.
¾ Provide elements for long term bench-mark monitoring and observation relating to resource dynamics.
¾ Provide a base line for eventual research follow up, by identifying specific and important topics that should be looked in greater detail for those who are interested in the area.
1.6. Study Area
Fig.1.1. Map of the study area
It is known that fast growth of population has been observed in 20 th century. Today, Addis Ababa is a rapidly expanding city. Especially the creation of new housing and industrial areas makes Addis Ababa one of the largest cities in sub-Saharan Africa (Ignis, 2008). With the headquarters of the African Union and the United Nations Economic Committee for Africa both based in this capital, it is of unique importance for African diplomacy. The regional headquarters of UNDP, UNICEF, UNHCR are also based in Addis Ababa.
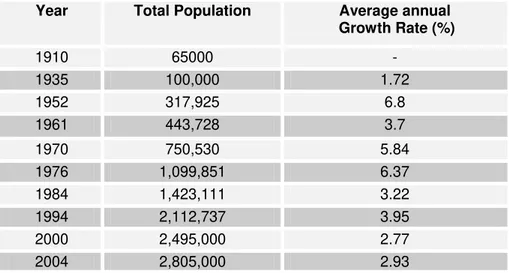
Table 1.1. Total population of Addis Ababa between 1910- 2004
(Source: ORAAMP, 1999)
Addis Ababa is not only the largest city in Ethiopia but also a textbook example of a primate city, as it is at least 14 times as large as Dire Dawa, the second largest city in the country. However, this primacy has been on the decline in the recent past, partly because of increased capital expenditure flows to regional capitals and other major cities of the country. As a result, Addis Ababa’s share of the total urban population has dropped from 30 percent in 1984 to 26 percent in 2000(Ignis, 2008).
As shown in Table 1.1, Addis Ababa’s population growth pattern has been irregular during the greater part of its history, largely due to changes in the country’s social, economic and political conditions. As official statistics show that the city today is experiencing one of its slowest-ever growth rates, just slightly below three percent per annum. Even with this low growth rate, the capital continues to attract 90,000 to 120,000 new residents every year. In general, it appears that much of this growth (probably up to 70 percent of the total), takes place in the slums and squatter settlements at the periphery of the city (ORAAMP, 1999).
It is worth highlighting that the greater part of this growth is due more to net in-migration (1.69 percent per annum) than to natural increase (1.21 percent per annum). It is not clear why, unlike most other major cities in the developing world, Addis Ababa has such a low rate of natural increase (UNHSP, 2007).
Year Total Population Average annual
Growth Rate (%)
1910 65000 -
1935 100,000 1.72
1952 317,925 6.8
1961 443,728 3.7
1970 750,530 5.84
1976 1,099,851 6.37
1984 1,423,111 3.22
1994 2,112,737 3.95
2000 2,495,000 2.77
1.6.1. Physical Expansion Trend in Addis Ababa
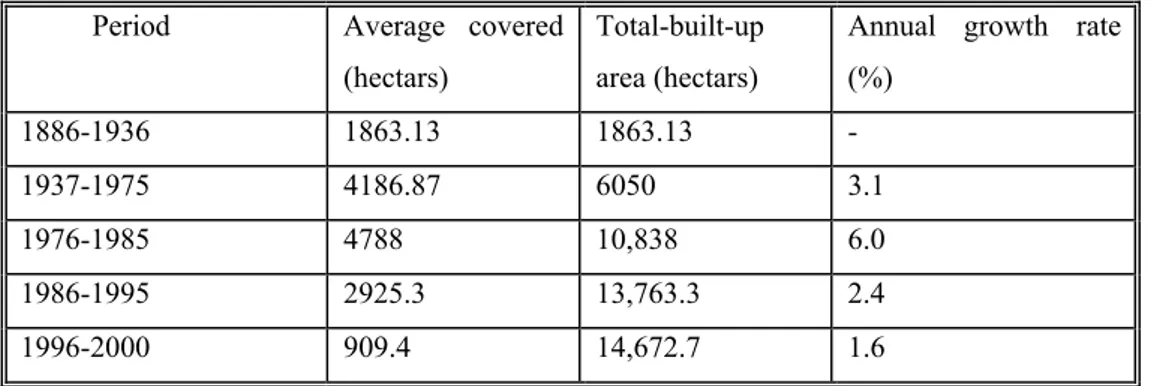
The rapid growth of population of the city has put great pressure on the demand for urban spaces. In response to this demand, efforts are being made by the city government to incorporate the peripheral areas of the city, which is resulting in hastening the expansion of the built-up area of the city. Accordingly, Addis Ababa has experienced rapid physical expansion (Table1. 2).
Period Average covered (hectars)
Total-built-up
area (hectars)
Annual growth rate
(%)
1886-1936 1863.13 1863.13 -
1937-1975 4186.87 6050 3.1
1976-1985 4788 10,838 6.0
1986-1995 2925.3 13,763.3 2.4
1996-2000 909.4 14,672.7 1.6
Table 1.2. Physical Growth of Addis Ababa City Built-up area (1886-2000)
The early development of the city from 1886 to 1936 was characterized by fragmented settlements. Following Italian occupation in 1937, the process of physical development of Addis Ababa was characterized by infill development and consolidation of the former fragmented settlements (ORAAMP, 1999:6). The physical expansion of the built-up area of the city during the period 1937 to 1975 was characterized by a compact type of development. From 1976 to 1985, the built-up area increased by 4788 hectares, thus increasing the cumulative total to 10,838 hectares.
During the most recent period of physical expansion, between 1996 and 2000, the physical built-up area of Addis Ababa increased by 909.4 hectares, reaching a cumulative total of 14,672.7 hectares. Expansion of the city was characterized by the development of scattered and fragmented settlements in the peripheral areas of the city, with both legal residents and squatters. In 2000, Addis Ababa had an estimated total of 60,000 housing units with squatter settlements. This figure accounted for 20% of the total housing stock of the city and the total area occupied by squatter settlements was estimated at 13.6% of the total built-up area (Minwuyelet, 2005).
1.6.2. Physiographic nature of the study area.
Climate
The climate in Addis Ababa is subjected to low pressure, also called Inter Tropical Convergence Zone, which is moving across the equator seasonally northward and Southward on the African Continent (Dirk, 2001)
Temperature
The average maximum temperature varies from 24.3°C in May to 20.3°C in August; the average minimum temperature varies from 11.8°C in May to 7.7°C in December. (Dirk, 2001)
Rainfall
The average annual rainfall in Addis Ababa amounts to 1178 mm. The main wet season takes place from June to September, causing about 70% of annual rainfall with the highest peak in August. Another small peak of rainfall is observed in April (Dirk, 2001)
Geology
materials in the western part are thick and soft compared to those of the northern and eastern parts.
Vegetation
The catchment areas of the rivers crossing Addis Ababa are on the one-hand characterized by the large urban area of Addis Ababa. On the other-hand, cultivated area, woodland and grassland are found at the banks of the rivers. The eastern part (Hanku river basin) is mostly covered with grassland. The northern part (Little Akaki, Kechene and Kebena river basins) is more or less covered with woodland but a certain part is intensively cultivated land and the urbanization is closed to the basin boundary and expands further. Since the turn of the century, shortly after foundation of the town, a number of eucalyptus plantations were founded in Addis Ababa and on the hills around (Intoto) in order to cover the demand of wood of the city. Due to enormous population growth, deforestation became a serious problem in the last two decades. In addition, mismanagement of the forest resources and failure in reforestation programs resulted in deforested hills in the mountainous region of the Intoto(Dirk, 2001)
Topography
Addis Ababa extends to the central Ethiopian highland. The city is located on a plateau with an elevation ranging from 2326 to 3000 meters. The mountain ridge in the north and east of the city is called Intoto ridge. The elevation of this ridge ranges from 2600 to 3200 meters. The urbanized area of the city is deeply dissected by numerous valleys formed by the five major river systems crossing the city from north to east.
1.7. Organisation of the Dissertation
described in words and portrayed graphically. Spatial details ranging from location to the sizes of important features as well as the biological, topographical and climatic attributes of the study area are explained in the same chapter.
The Second chapter is describing all theoretical and related review literatures for this study. Here most of the reviewed materials present the land cover and change analysis using remote sensing and descriptive statistical landscape metrics.
The third chapter is devoted to the description of the state of the art of the study, the major methodologies followed for landcover classification and landcover change detection, multitemoral data sources, landcover classes and training activities. The steps followed for pixel-based classification in supervised classification technique using the Maximum Likelihood algorithm of ArcGis software has been stated.
In the fourth chapter, the result and data analysis technique using spatial metrics has been explained and the accuracy techniques of the landcover classifications have been stated with some statistical methods.
CHAPTER TWO
LITERATURE REVIEW
2. INTRODUCTION
For centuries, humans have been altering the Earth’s surface for agricultural activities
and settlement. Nearly a third of the earth’s land surface is composed of croplands and
pastures and over half of the cultivated areas have been cleared in the last century
(Houghton, 1994). In the last few decades, conversion of grassland, woodland and
forest into cropland, pasture and urban settlement has risen dramatically. This
acceleration has drawn the attention about the role of landuse change in driving losses
in biodiversity, soils and their fertility, water quality and air quality. These concerns
have spawned a flurry of research on the causes and consequences of landuse/land
cover change (Penner 1994).
The importance of mapping landuse classes and monitoring their changes with time
has been widely recognized in the scientific community. Studying changes in landuse
pattern using remotely sensed data is based on the comparison of time-sequential data.
Change detection using satellite data allows for timely and consistent estimates of
changes in landuse trends over large areas (Prakash and Gupta, 1998). In this chapter,
various related works which support this study have been stated and substantiated the
finding and the objectives of this work.
2.1. History and application of Remote Sensing
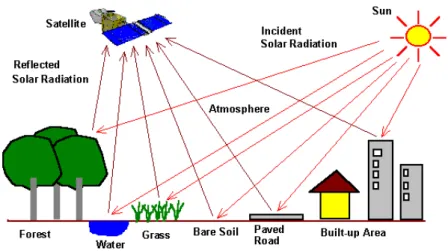
Remote sensing defined as a science of obtaining Information about objects and phenomena with out being in direct contact with the object (Colwell 1983, Lillesand
sensing application in many fields, including environmental and resource management, biodiversity and ecological monitoring and landuse/landcover change assessment (Tucker et al. 1983, Csaplovics 1992, Campbell 1996, Lillesand et al. 2004).
Fig 2.1. Remote sensing processes (source; UNOMAHA, 2008)
Progresses and availability of the multispectral data from various sensors have been used to understand the extent, pattern, diversity, and the state of surface features including crops, forest, urban sprawl, land degradation and climate. Soon after the launch and the availability of landsat images, some shocking realities about the damage of environmental resources were disclosed. As an excellent example, the deplorable deforestation and biodiversity loss in Amazonian forest began to be detected by remote sensors (Peres et al. 1995). This event not only triggered the alarm on global deforestation but also opened the door for wide acceptance and application of remote sensing for natural resources conservation and environmental monitoring.
logarithmic increment of the use of remote sensing for landuse management, biodiversity research, greenhouse effect monitoring, and other research areas. It also paved the way for applied geospatial research that links with multi disciplines (Csaplovics, 1992). From 1980 to 1990 alone the use of remote sensing data for tropical deforestation monitoring grew almost seven fold (Rudel et al. 2000). Increment in applied Geospatial research areas, wide acceptance and interdisciplinary approach of the remote sensing has also provided an opportunity for feedback for the improvement of radiometric sensitivity, spatial, temporal and spectral resolutions. Nowadays, the emergence of very high resolution images such as QUICKBIRD, IKONOS and SPOT are integrated in various application areas and research centers, so as to provide reliable, efficient and accurate geospatial Information (Bergen et al.
1999).
Due to the advancement in remote sensing technology and techniques in various application areas, in 2001 the US Government, through NASA and USGS, formally announced to provide a significant amount of archived historical satellite data to UN for further distribution and use by the international community. The Landsat data sets of more than 23,000 images, with coverage of the entire Earth surface are an important source of baseline information to document and quantify the present changes to the environment (USGS/UNEP/UNOOSA 2004). Currently, there are several online and ‘on request’ remotely sensed data, products and service suppliers. Some of the selected ones are:
1. The Earth Science Data Interface (ESDI) at the Global Land Cover Facility.
This source is globally providing an archived data free of charge for downloading or very low handling and shipping costs. It provides landsat imageries which are orthorectified, composite MODIS images, and products such as NDVI vegetation index. It is funded by NASA and hosted at the University of Maryland in the USA. (GLCF, 2008).
2. Tropical Rain Forest Information Center (TRFIC).
maps and databases to a range of users through web-based Geographic Information Systems (TRFIC, 2008).
3.EPHA (Data Exchange Platform for Horn of Africa) supported by the UN
It delivers data and information such as maps, databases, and technical documents that are useful to humanitarian and development communities as a whole for the Horn of Africa region. In addition to developing these products, it also provides low-cost data and information management services (DEPHA, 2008).
4. FEWS (Famine Early Warning Systems).
Through the representatives of FEWS in Africa and Asia, it delivers some higher spatial resolution landsat images for countries or localities in question through these institutions.
5. ARTEMIS (The Africa Real Time Environmental Monitoring Information System). FAO set the ARTEMIS as a support to its applied satellite remote sensing that is trying to enhance capabilities in the surveillance and forecasting of its Global Information and Early Warning System (GIEWS). Since 1988, the ARTEMIS system has been delivering low resolution, 10-day composite NDVI products as well as other weather and climate data.
6. Earth Observing System Data Gateway .
Land, water and atmosphere data products from NASA and affiliated centres can be queried from the Earth Observing System Data Gateway (EOS). There are very useful high qualities satellite products available free of charge or with affordable handling costs. Famous satellite products including AVHRR, MODIS and ASTER can also be obtained.
7. UNOSAT
community and to experts worldwide working to reduce disasters and plan sustainable development (UNOSAT, 2008).
8. SPOT Vegetation
Under certain conditions the SPOT Vegetation programme supplies 1 km ground resolution SPOT 5 products for users. Standard 10-day synthesis products older than three months are normally available free of charge for the public. However, primary and recent products are commercial except for approved scientist who can receive them, after paying only the processing and shipping costs.
2.2. Land use and land cover
In most cases, the terms landuse and landcover are used interchangeably. Land cover describes the physical material at the surface of the Earth. It comprises various Landcover types such as trees, bare soil, grass, water etc. Whereas land use is a description of how people utilize the land and socio-economic activity such as urban land, agricultural land, forest land, water land, grazing land etc (Wikipedia, 2008).
The effect of landcover change can directly or indirectly affect the way how human uses the land. Dynamics of landcover do not necessarily mean degradation of land or environment and the vice versa too. However, there are numerous natural and man made driving forces that can alter the coverage and use of land, biodiversity, and other physical and human environments (George, 2005). Alteration in landuse or landcover is principally due to the interaction of humans with their environment and its missuse.
Thus, it is important to think about how to monitor and sustain the environment from climate change, biodiversity and the ecosystem. Hence, in order to manage the changes in landcover and use, it is necessary to have the information on existing and future landuse/ landcover(George,2005).
2.3. Application of Remote Sensing on Land Use/Landcover Change
physical and human environments, maps become outdated with the passage of time. Advancement in remote sensing techniques and GIS have proved to be of immense value for preparing accurate landuse/landcover maps and monitoring changes at regular time intervals(George, 2005). Earth observation sensors capture the spectral electromagnetic value of light from various surface features and an interpreter uses the element of color, texture, pattern, shape, size, shadow, site and association to derive information about landcover.
William et al (1991) noted that information about landuse/cover change, which is extracted from remotely sensed data, is vital for updating landcover maps and the management of natural resources and monitoring phenomena on the surface. Moshen 1999), also noted that landuse data has a great importance to planners in monitoring the consequences of the change on the area, plan and to assess the pattern and extent of the change, to modeling and predicting the future level of change, and to analyze the driving forces of changes.
It is worth mentioning some of the related works done in various parts of the world due to the progress in Earth Observations technology and techniques. Since the launch of the first remote sensing satellite (Landsat-1) in 1972, landuse and landcover studies were carried out in various local, regional and global levels. For instance, using landsat multi-spectral scanner data, Indian National Remote Sensing Agency carried out waste land mapping. In 1985, the U.S Geological Survey carried out a research program to produce 1:250,000 scale landcover maps for Alaska using Landsat MSS data (Fitz et al 1987). The State of Maryland Health Resources Planning Commission also used Landsat TM data to create a landcover data set for inclusion in their Maryland Geographic Information database. All seven TM bands were used to produce a 21 – class land cover map (EOSAT, 1992). In 1992 similar work was also done by the Georgia Department of Natural Resources in mapping the entire State to identify and quantify wetlands and other landcover types using Landsat Thematic Mapper ™ data (ERDAS, 1992).
2001). Generally, satellite imagery is able to provide more frequent data collection on a regular basis unlike aerial photographs which although may provide more geometrically accurate maps, are limited in their extent of coverage. Shoshany (1994), also investigated the comparative advantages of remote sensing techniques in relation to traditional field surveys in providing a regional description of landcover. The results of their research were used to produce four vegetation cover maps of Hangana State in India that provided new information on spatial and temporal distributions of vegetation.
Dimyati (1995) also figured out the role of remote sensing data and techniques of superimposition (overlaying) and Image Differencing which used the subtraction of images of two different time periods of the same location to evaluate the change pattern in different temporal levels. This was done to analyze the pattern of change in the area, which was rather difficult with the traditional method of surveying.
2.4. Urban landuse/landcover dynamics
Due to several reasons, most of the urban centers expand to the surrounding environment. The outskirts of urban areas, usually referred to as rural-urban-fringe, are characterized by farming land/irrigated fields, forest cover and source of water supply. The trend of urban growth towards the urban-rural-fringe has an impact on the surrounding ecosystem. One of the major impacts of urban landcover change is diminish in surrounding forest and agricultural land. It is also likely that large amounts of valuable agricultural or irrigated lands are converted to non-agricultural areas (e.g. built up areas). Urban landcover change is a very important phenomenon, which characterizes the nature of the cities and their surrounding areas (George, 2005).
2001). Despite these difficulties, urban growth and urbanization are major environmental concerns that need consideration and careful assessment and monitoring (George, 2005).
2.5. GIS and Remote Sensing for urban change detection and monitoring
The emergence and development of geospatial tools has opened the way for collecting, storing, processing, analyzing and displaying spatial data for various environmental applications. GIS is an information system that integrates, stores, edits, analyzes, shares, and displays geographic information. It can be used in inventorying the environment, observing and assessing the changes as well as forecasting the changes based on the existing situation (Ramachandra and Kumar, 2004). Remote sensing on the other hand is the process of data acquisition through satellite and other air borne sensors without having any physical contact to the objects. It allows the acquisition of multispectral, multi-resolution and multi-temporal data for various purposes. Both remote sensing and GIS tools are applied in a wide variety of application areas including detecting and monitoring environmental changes, location and extent of urban growth, environmental impact assessment (EIA).
According to Herold et al., (2002), remote sensing technology has great potential for acquisition of detailed and accurate landuse information for management and planning of urban regions. The traditional method of surveying for landuse mapping and change detection is time consuming and difficult to update timely. Because of their cost effectiveness, temporal frequency and extensibility, remote sensing approaches are widely used for change detection analysis (Jensen and Im, 2007). In addition, image processing techniques assists in classifying, analyzing and monitoring changes associated with the earth’s surface(Yeh and Li, 1997).
GIS and remote sensing for urban landcover change analysis requires acquisition of data set, classification of images using efficient algorithm and analysis of the change undergone which are the major steps in most change detection related works (Herold
et al, 2003).
2.6. Remote sensing of urban areas
Aerial photo has been providing a visual interpretation of urban areas based on the colour of the objects. The interpretation is quite difficult due to the complexity of size, shape, pattern of urban landuse/landcover. To alleviate this challenge, a number of urban remote sensing applications have shown the potential to map and monitor urban landuse and infrastructure (Barnsley et al, 1993). The combined approach of remotely sensed data with other socio-economic data also helps the researchers to detect and model the future trend of the urban sprawl (Herold et al 2003).
As compared with another data sources, the strength of remote sensing is that it can provide spatially consistent and historically reliable series of data sets with high degree of resolution and temporal details. Remote sensing provides an additional source of information that more closely respects the actual physical extent of a city based on landcover characteristics (Weber, 2001). Nevertheless, in urban remote sensing the challenging task is the distinct boundary between urban and rural or built up and non built up. Thus, the problem of urban limit still remains as a challenge, so the writers used their own rule and criteria for differentiating urban from rural land (Herold et al 2003).
There are different arguments regarding urban landuse analysis based on per-pixel basis and discrete object-based. The pixel-based approach only provides landcover characterization rather than urban landuse information. In order to include detailed mapping of urban landuse and socio-economic characteristics of the area, image pattern and context, as well as texture can be used, which are used to describe the morphology of urban areas. This option shows the socio-economic and landuse characteristics in remotely sensed data using structural, textural and contextual image information derived during image classification. The post classification technique is also used to estimate the urban landuse information from classified landcover map. In most image classification techniques, the analysts use it to show the landuse pattern of the study. Another newly emerged type of approach (Object-based) which is using the discrete landcover objects(segments) to describe the morphology and the spatial relationship of urban land use mapping(Herold et al, 2002).
Various authors e.g. Longley et al (2001), pointed out that the application of remote sensing, the technical aspect of data assembly and the physical image classification should be improved by more interdisciplinary and application-oriented approaches. They noted that research should focus on the description and analysis of spatial and temporal distributions and dynamics of urban phenomena, in particular urban landuse changes. However, there are serious arguments among social scientists and geospatial analysts against urban remote sensing (Rindfuss and et al, 1998). One of the arguments is the limitation of remote sensing to visualize the social phenomena “Pixelizing the social environment”. Remote sensing is only focuses on the physical aspects of urban areas and ignores the social issues. The socio-economic variables are not directly visible in remote sensing detection of the area. Secondly, most social sciences excluding planning and geography are more concerned with why things happen rather than where they happen; thus, most social scientist underestimate the data obtained from remote sensing. They also do not appreciate that the remotely sensed data can provide quantified information on social phenomenon in certain geographical extent.
that remote sensing can also provide excellent information for urban growth pattern and landuse/change processes. Remotely sensed data is consistent in large area coverages and can also provide information on a great variety of geographic scales. It can also help to describe and model the level of dynamics, leading to updated information for planning and decision making (Longley et al. 2001).
2.7. Image Classification Techniques
Image classification approaches and techniques in remote sensing have gained the attention of most researchers in the field; because the efficient, accurate, and reliable information on the surface feature is the base for many application areas (Lu and Weng, 2007). In addition, valuable land information extraction and analysis is well performed using image classification. Image classification is the process of assigning pixel images to predefined landcover classes. Information extraction using image classification is a complex and time consuming process. Thus, it might require the consideration of the following factors:
¾ Availability and proper selection of appropriate software for required classification techniques and algorithms;
¾ The level of resolution and selection of remotely sensed data (it depends on the availability of the required images);
¾ Suitability of classification techniques;
¾ Prior knowledge by the analysts of the study areas (sometimes not required), sufficient number of training samples, and analyst knowledge and skills; ¾ Appropriateness of change detection techniques e.g. post-classification process ¾ The performance of the classification accuracy.
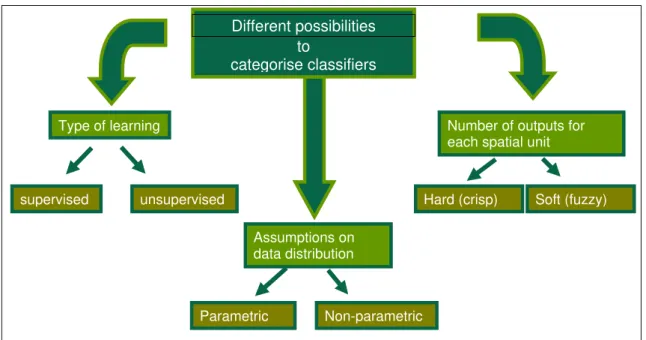
Figure 2.2: Image Classification methods
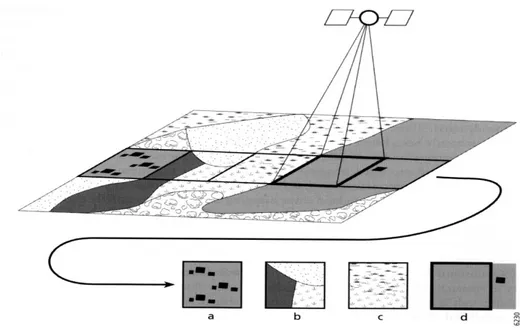
2.7.1. Pixel-Based Image Classification
It is the most commonly and widely used classification method, in which each pixel is classified based on the spatial arrangement of edge features in its local neighborhood (IM et al, 2007). Image classification at pixel level could be supervised or unsupervised. In the supervised classification method (e.g. Maximum Likelihood), the analyst is responsible to train the algorithm. In the unsupervised method, input from the analyst is very limited i.e. in specifying number of clusters and labeling the classes. According to Santos et al (2006), the statistical properties of training datasets from ground reference data are typically used to estimate the probability density functions of the classes. Each unknown pixel is then assigned to the class with the highest probability at the pixel location. However, information extraction at pixel level is associated with mixed pixel problems, although it is the most commonly used technique (fig 2.3).
Parametric Non-parametric Assumptions on
data distribution
Number of outputs for each spatial unit
Hard (crisp) Soft (fuzzy)
Different possibilities to
categorise classifiers
Type of learning
Fig.2.3.Mixed pixel problems (Source: Foody 2004)
2.7.2. Object-Oriented Image Classification
Classification based on contextual information or object-based is suggested to avoid the mixed pixel problems. The advent of object-oriented image classification provides a tool for mapping detailed landuse (Mori et al 2004). This approach considers the groups of pixels and geometric properties of image objects. Object-oriented processing techniques segments the images into homogenous regions based on neighboring pixel’s spectral and spatial properties. As shown in the Fig 2.4, the same classes are grouped in the same category.
Fig 2.4. Segmentation for Object oriented classification (homogeneous regions are segmented under similar
categories)
2.7.3. Advanced Classification approaches
used for image classification (Lu and Weng, 2007). These include artificial neural networks, fuzzy-set theory, decision tree classifier, knowledge and expert based, etc. The pixel-based classification is referred to as hard classification approach in which each pixel is forced to show membership only to a single class. Thus, soft classification approach has been developed as an alternative because of its ability to deal with mixed pixels problem. According to Jensen (2005), soft classification provides more information and potentially a more accurate result.
2.8. Change Detection and analysis techniques
2.8.1. Change detection: conceptual framework
Change detection is the process used in remote sensing to determine changes in the landcover properties between different time periods. It is also viewed as the process of identifying differences in the state of an object by observing it at different times (Singh, 1989). According to Ramachandra and et al (2004) it is the change in information that can guide to more tangible insights into underlying process involving LULC changes than information obtained from continuous change. It is also viewed as the process for monitoring and managing natural resources and urban development because it provides quantitative analysis of the spatial distribution in the area of interest (Tardie and Congalton, 2002).
2.8.2. Applications and approaches of change detection
Change detection can be applied in many areas. According to Jensen and Im (2007), the application of change detection may range from monitoring general landcover change using multitemporal imageries to anomaly detection on hazardous waste sites. One of the most common application areas for change detection is agricultural, urban, forest, water land cover/use. Detection analysis using Vegetation Index Differencing (NDVI), for example, is applied to identify the status of vegetation cover in different time period. It is also useful to assess the urban growth and assessment of coastal environmental changes. Change analysis in urban growth assist urban planners and decision makers to implement sound solution for environmental management.
registration of the satellite input data is required so that a pixel represents the same location in different images. Therefore, selecting appropriate remotely sensed data and change detection techniques are very essential. Most recent change detection approaches are based on expert systems, artificial networks, fuzzy sets and object-oriented approaches (Jensen and Im, 2007). Change analysis using remotely sensed data involves different procedures such as, identifying the nature of the change detection problem, identifying the nature of remote sensing and environmental consideration, image processing to extract the changes and evaluation of the detection output (Jensen, 2005).
2.8.3. Landuse change detection techniques
Through the development of remote sensing techniques, various types of change detection algorithms have been emerging and applied in different application areas so as to determine the spatial extent and pattern of changes occurred in different time scale. It is well known that different methods of change detection produce different change maps. Thus, selection of an appropriate technique requires knowledge of the algorithms, characteristic features of the study area and nature of the data. Post classification Comparison is one of the most commonly used classification technique. (Blaschke, 2005). Based on data transformation procedures and analysis applied, researchers attempted to classify change detection methods as Pre and post classification techniques (Jensen and Im, 2007, Belaid, 2003, Mas, 1998, Singh, 1989, Berkova, 2007). As noted by Singh (1989), there are two basic digital change detection approaches: comparative analysis of independently produced classifications and simultaneous analysis of multitemporal data.
The following section attempted to review some of the techniques applied in different researches and are available in various software platforms. Each of this technique falls into one of the above discussed approaches.
Image differencing:
Image ratioing:
In this method, geo-corrected images of different data are rationed pixel by pixel (band by band). According to Eastman (2001), image differencing looks at the absolute difference between images whereas image ratioing focuses on the relative differences. When the result of the ratio is equal to one, it reveals that there is no change in the landcover classes. Ratio value greater or less than one reflects landcover changes.
Vegetation index differencing:
This method is applied to analyze the amount of change in vegetation versus non vegetation by computing NDVI. NDVI is one of the most common vegetation indexing method and is calculated by;
) ( ) ( RED NIR RED NIR NDVI + − = Where,
NIR- is the near infrared band response for a given pixel
RED- is the red response.
Post classification comparison:
This is the most obvious, common and suitable method for landcover change detection. This method requires the comparison of independently classified images T1
and T2, the analyst can produce change maps that show a complete matrix of changes
(Singh, 1989).
2.8.4. Landcover/Landuse change analysis techniques
In order to quantify and model the changes occurred in landuse classes, Herold et al
(2002) recommended to use spatial metrics. A change in urban landuse structures can be well described using information from spatial or landscape metrics. Spatial metrics are quantitative indices used to describe structures and patterns of landscape (Herold
2.9. Spatial metrics for urban landcover change analysis
Spatial metrics some times termed as landscape metrics, is useful tool in quantifying an extent of changes occurred in certain geographic area. It is widely applied in areas related to Landscape Ecology. Having a fast development in geospatial tools and its interdisciplinary approach, interest of spatial metrics in remote sensing has also been increasing from time to time. It is an excellent tool to quantify the changes in urban environment. It helps to bring out the spatial components in urban structure and dynamics of change and growth process (Alberti & Waddell, 2000). Herold et al
(2002) also pointed out that an integrated approach of spatial metrics with remote sensing is an excellent method to provide spatially consistent and detailed information on urban structure.
Spatial metrics is based on the categorical, patch based representation of a landscape. Patches are defined as homogeneous regions for a specific landscape property e.g. “Industrial land”, “farm land”, “residential zone” etc are categorized patches which can be presented in the form of polygon. Thus, spatial metrics used to quantify the distinct spatial heterogeneity of individual patches with common class with similar spatial properties. Common patch-based indices in spatial metrics are size, shape, edge, length, patch density etc (Gustafson, 1998).
From geospatial point of view, landscape metrics defined as descriptive measurements derived from the digital analysis of thematic categorical maps resenting spatial heterogeneity at a specific scale and resolution (Herold et al 2003). According to Cabral et al (2006), the definition of spatial metrics emphasizes on the quantitative aspects of the mapped features of the landscape (patches, patch classes, or the whole map). Furthermore, Spatial Metrics always represents the spatial heterogeneity in specific extent, resolution and pattern at a given point in time. Most of the quantitative measures of spatial metrics such as size, shape length and density are calculated by FRAGSTATS statistical package.
(2001). Spatial metrics is also used to link the economic process and pattern of urban landuse. Parker and et al (2001) investigated an agent-based economic landuse decision making in specific landuse patterns. They also proposed the spatial metrics for modeling complex spatial pattern of urban landuse/landcover. It allows the representation of heterogeneous characteristics of urban areas, and of the impact of urban development on its environs. In general, an integrated approach of spatial metrics with remote sensing for change detection and modeling the urban environment is recommended (Parker and et al (2001).
To summarize, like in any other developing countries, the most obvious problem associated with urban growth in Addis Ababa is encroachment towards agricultural lands and natural resources. A spatio-temporal analysis of growth patterns is essential to develop sufficient infrastructure to support urban growth assessment. Landsat data and spatial metrics are integrated in this research, so as to identify the extent and pattern of the city in different period of time. Hence, urban planners and decision makers should consider the potential of geospatial tools to detect, monitor and evaluate the urban landcover changes in the country.
CHAPTER 3
RESEARCH METHODOLOGY
3. Introduction
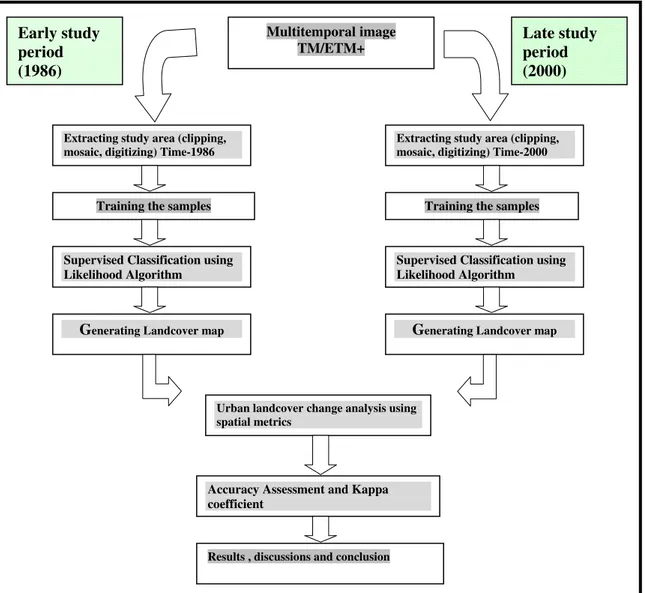
The flow diagram (Fig 3.1) summarizes the overall methods, techniques, approaches and materials used to carried out this study, so as to figure out the urban landcover changes and describe the urban spatial patterns changes in the study areas.
Figure 3.1. flow diagram of the methodologies
3.2. Data source and Type
3.2.1. Data
There are a number of different kinds of methods, strategies and techniques to process input data so as to generate the required research output in an efficient and sufficient
Multitemporal image TM/ETM+ Early study
period (1986)
Extracting study area (clipping, mosaic, digitizing) Time-1986
Training the samples
Accuracy Assessment and Kappa coefficient
Urban landcover change analysis using spatial metrics
Generating Landcover map
Supervised Classification using Likelihood Algorithm
Late study period (2000)
Extracting study area (clipping, mosaic, digitizing) Time-2000
Training the samples
Supervised Classification using Likelihood Algorithm
Generating Landcover map
way with desired quality. In fact, the choices of general methodology and specific technical arrangements are largely guided by the availability of the desired input data, the quality of available information, the strength of logistic support including the software employed, researcher's experience and skill to manipulate as well as the necessary fund allocated for the task. The methodology integrated in this study comprises remote sensing tools as well as spatial and temporal analysis techniques using landscape metrics. The GIS and remote sensing tools were used to classify the satellite data and detect urban changes in different time frame, and to analyze the pattern and the trend of changes. Landscape metrics were also employed to quantify the changes and compare the results.
Due to diverse application of remotely sensed data, satellite images have been used for different environmental studies (e.g. biodiversity and ecological monitoring, agricultural and early warning purpose, change in surface water, global and climate change as well as mapping and detecting urban landcover changes). Data from satellite imageries are nearly perfect to provide information on different geospatial phenomenon on the surface of the earth. However, the consideration has to be given for the level of resolution, level of correctness of an image during processing, impacts of the sun’s inclination and season of image acquisition, classification techniques applied etc. It is also important to use a cloud-free scene. This is because seasonal variation and non-cloud free images could affect the quantitative analysis of the changes (Singh, 1998).
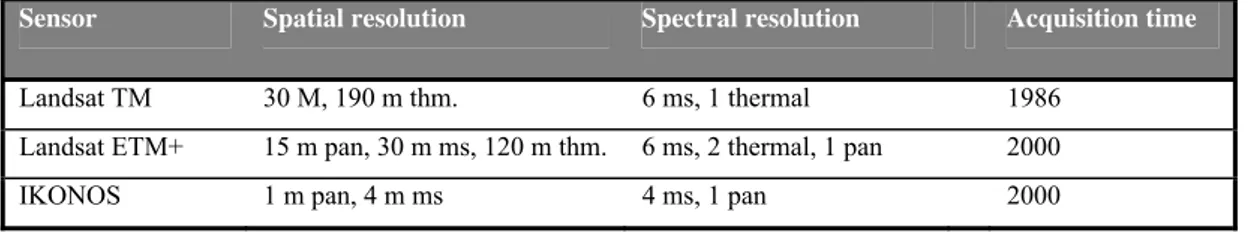
The satellite imageries with acquisition period of 1986-01-21 and 2000-12-05 respectively were downloaded from Global Land Cover Facility of the University of Maryland (GLCF, 2008). Two remote sensing images from Landsat were used and processed for identifying urban landcover change patterns of the study area. In order to avoid the impact of seasonal variation, the images used are predominantly cloud free and are selected from the same season (dry season). The satellite data used are landsat TM and ETM+ acquired in 1986 and 2000, respectively. The resolution of the images is 30 meters. The TM and ETM+ satellite data are usually used for their multi-spectral and environmental value, because one of the intended uses was to observe landcover character as an environmental backdrop to the urban growth pattern (Gluch, 2002). Characteristics of the satellite data used in this study are summarized in the table 3.1.
Sensor Spatial resolution Spectral resolution Acquisition time
Landsat TM 30 M, 190 m thm. 6 ms, 1 thermal 1986
Landsat ETM+ 15 m pan, 30 m ms, 120 m thm. 6 ms, 2 thermal, 1 pan 2000
IKONOS 1 m pan, 4 m ms 4 ms, 1 pan 2000
Table 3.1.Characteristics of satellite data used
In order to substantiate the findings and detect the changes on the surface, it is necessary to use additional data including other high resolution imageries, topographic maps, socio economic and environmental data, physiographic and climate data. For this study, as an ancillary data, high resolution images (IKONOS) and existing landcover maps of the area, Google maps and Google Earth, and population data were integrated. The ancillary dataset both IKONOS images and existing landcover maps were mostly used to identify surface features, support image classification and landcover change analysis. The dataset were geometrically referenced to the UTM zone 37 projection systems. It was also important to know the characteristic features of each band of the landsat image.
ETM spectral bands that most closely resemble the true color of the features. A true-color composite uses the visible red (band 3), visible green (band 2), and visible blue (band 1) channels to create an image that is very close to what a person would expect to see in a photograph of the same scene. Another band composition employed for this study was Near Infrared Composit (432), which eliminates the visible blue band and uses a Near Infrared (NIR) band to produce the image. The resulting composite does not resemble what the “True Color” looks like. Thus the study comprised band 1, 2, 3, and 4 to detect landuse changes of the study area. Other supporting data i.e. population dataset for the census years of 1976, 1984, 1994 and 2000 were also used to describe, compare and analyze the pattern of urban growth. This was because demographic characteristics of the area could affect an acceleration of urban sprawl. 3.2. Landcover Nomenclatures
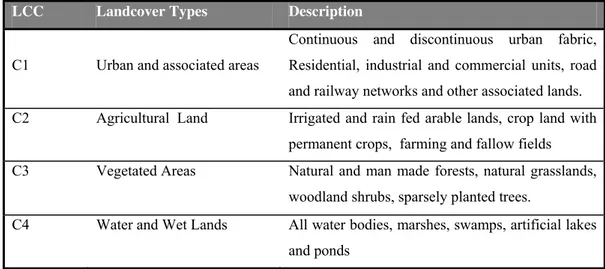
In order to make sample collection and classification easy, landcover nomenclatures are required to create and define the possible landcover classes first. Although the focus of the paper was on built-up areas, landcover map of the study areas were first generated using landcover classes presented in table 3.2.
LCC Landcover Types Description
C1 Urban and associated areas
Continuous and discontinuous urban fabric,
Residential, industrial and commercial units, road
and railway networks and other associated lands.
C2 Agricultural Land Irrigated and rain fed arable lands, crop land with
permanent crops, farming and fallow fields
C3 Vegetated Areas Natural and man made forests, natural grasslands,
woodland shrubs, sparsely planted trees.
C4 Water and Wet Lands All water bodies, marshes, swamps, artificial lakes
and ponds
Table 3.2. Landcover classes
Because of the major objective of this study, these nomenclatures were further merged and regrouped as built and non built-up classes (Table 3.3). This helped the analyst to discuss and analyze the extent and pattern of urban sprawl. This helped to categorize the heterogeneous nature of different classes under certain major category. However, it was not an easy task to distinguish similar spectral values of the features in urban centers; it was an unavoidable factor which could distort the accuracy of classification.
CLASSES
ID
CLASSES DESCRIPTIONS
C1 Buit-up Areas Comprises commercial, residential, road and impervious features, Continuous and discontinuous urban fabric,
Residential, industrial and commercial units, road and railway
networks and other associated lands, Airports, Dump sites,
construction sites, Sport and Leisure facilities etc.
C2 Non-Built-up Areas
Irrigated and rain fed arable lands, crop land with permanent
crops, farming and fallow fields, Natural and man made
forests, natural grasslands, woodland shrubs, sparsely planted
trees, marshes, swamps, artificial lakes and ponds and others.
3.3. Image classification
Image classification is defined as the extraction of differentiated classes or themes, landuse and landcover categories, from raw remotely sensed digital satellite data. It is a technique to identify different features such as urban landcover, vegetation types, anthropogenic structures, mineral resources, or changes in any of these properties from the satellite image. Additionally, the classified raster image can be converted to vector features (e.g. polygons) in order to compare with other data sets or to calculate spatial attributes (e.g. area, perimeter) using different statistical methods including landscape metrics.
Image classification is a complex and time consuming process. In order to improve the classification accuracy, selection of appropriate classification method is required. This would also enable analyst to detect changes successfully (Elnazir et al, 2004). There are different types of image classification techniques. However, in most cases the researchers categorized them in to 3 major modes: Supervised, unsupervised and hybrid. For this study, the Supervised Classification type was applied. It is a type of classification which is based on the prior knowledge of the researcher to the study area. It requires the manual identification of Point of Interest areas as reference (Ground Truth) within the images, to determine the spectral signature of identified features. It is one of the most common types of classification techniques in which all pixels with similar spectral value are automatically categorized into land cover classes or themes.
3.4. Training site collection
Training areas/sample objects which are typical representatives of the classes were collected using high resolution images; existing landcover maps, analyst’s personal experiences and knowledge of the physiographical nature of the area. In addition, image enhancement and composition were applied for better discriminating the landcover classes. Using these approaches around 579 sample objects were collected from each image (1986 and 2000).
3.5. Urban landcover change analysis techniques
The pattern or direction of urban expansion and the rate of urban development occurs in a variety of ways depending on the physiographical nature of the area, distance from accessibility (e.g. market areas or roads), and distance from city center, slope, etc. These and other related factors prompt for the development of continuous or discontinuous urban structures. Urban area (built areas) may also occur spatially in isolated or fragmented mode in space. Therefore, it is imperative to quantify and analyze spatial and temporal dynamics of urban landcover and pattern of urban growth. The differences in representation of a space have led to a wide variety of spatial metrics for the description of spatial structure and pattern (Herold et al., 2003). The spatial metrics are algorithms used to quantify spatial characteristics of patches, class areas and the entire landscape (Cabral et al., 2006). They enable analyst to quantify the spatial heterogeneity of classes and identify the changes in the pattern of urban growth.
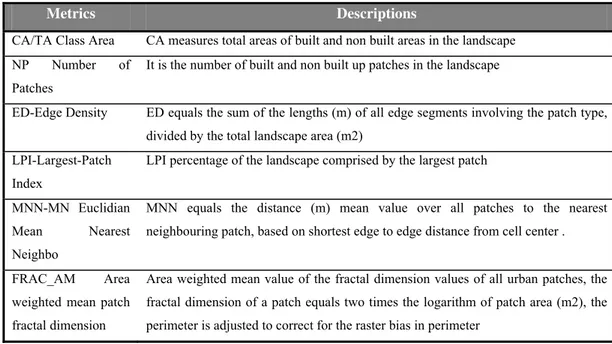
A number of metrics have been developed to describe and quantify elements of patch shape complexity and spatial configuration relative to other patch types; however, it is not clear which will prove to be the most informative and interpretable over large areas (Loveland, 2004). In this work, six spatial metrics (class area-CA, Number of patches – NP, Edge Density – ED, Largest Patch Index – LPI, Euclidian Mean Nearest Neighbour Distance – EMN, Area Weighted Mean Patch Fractal Dimension-FRAC_AM) which have been adopted and used for analyzing the urban landcover changes (Table 3.4).
Metrics Descriptions
CA/TA Class Area CA measures total areas of built and non built areas in the landscape
NP Number of
Patches
It is the number of built and non built up patches in the landscape
ED-Edge Density ED equals the sum of the lengths (m) of all edge segments involving the patch type,
divided by the total landscape area (m2)
LPI-Largest-Patch
Index
LPI percentage of the landscape comprised by the largest patch
MNN-MN Euclidian
Mean Nearest
Neighbo
MNN equals the distance (m) mean value over all patches to the nearest
neighbouring patch, based on shortest edge to edge distance from cell center .
FRAC_AM Area
weighted mean patch
fractal dimension
Area weighted mean value of the fractal dimension values of all urban patches, the
fractal dimension of a patch equals two times the logarithm of patch area (m2), the
perimeter is adjusted to correct for the raster bias in perimeter
Table 3.4 Spatial metrics adopted and used (Herold et al., 2003)
3.7. Accuracy Assessment