O
h
r
c
i
r
g
a
in
e
a
s
l
R
e
Gökhan Aksan1, Serhat Sığırcı1, Gökhan Çetinkal1, Burak Musa Ayhan2, Süleyman Sezai Yıldız1, Ayşegül İdil Soylu3, Muzafer Başak2, Kadriye Orta Kılıçkesmez1
1Department of Cardiology, Şişli Hamidiye Etfal Training and Research Hospital, İstanbul,
2Department of Radiology, Şişli Hamidiye Etfal Training and Research Hospital, İstanbul,
3Department of Radiology, Faculty of Medicine, Ondokuz Mayis University, Samsun, Turkey
Epicardial Adipose Tissue and Coronary Plaque
The Relationship Between Epicardial Adipose Tissue
Volume and Coronary Plaque Structure in Diabetics
Diyabetiklerde Epikardiyal Yağ Volümü ile
Koroner Plak Yapısı Arasındaki İlişki
DOI: 10.4328/JCAM.4748 Received: 14.07.2016 Accepted: 29.07.2016 Printed: 01.03.2017 J Clin Anal Med 2017;8(2): 92-7
Corresponding Author: Gökhan Aksan, Department of Cardiology, Şişli Hamidiye Etfal Training and Research Hospital, 34371, İstanbul, Turkey. T.: +90 2123735000 F.: +90 2122240772 E-Mail: [email protected]
Özet
Amaç: Epikardiyal yağ dokusu (EYD) koroner arter hastalığı (KAH) gelişimi ve ilerlemesinde rol oynamaktadır. Biz bu çalışmamızda, diyabetik hastalar-da EYD volümü ile koroner ateroskleroz, koroner plak yükü ve plak yapısı ara-sındaki ilişkiyi incelemeyi amaçladık. Gereç ve Yöntem: KAH şüphesi araştırıl-ması için 128 kesitli bilgisayarlı tomografik koroner anjiografi ile değerlendi-rilen 196 diyabetes mellitus (DM) hastası çalışmaya dahil edildi. Toplam plak yükü, hasta damar segmenti sayısı, plak karakteristikleri ve EYD volümü BT anjiografi ile değerlendirildi. Hastalar iki gruba ayrıldı [KAH olan grup (Grup I) ve KAH olmayan grup (Grup II)]. Her segmentte plak karakteristikleri ayrı ayrı analiz edildi. Bulgular: EYD volümü, KAH olan DM hastalarında KAH ol-mayan DM hastalarına göre anlamlı derecede yüksek bulundu (138.7±49.1 ml vs 98.6±34.7 ml, p<0.001). Korelasyon analizinde EYD volümü, vücut kitle in-deksi (VKİ) (r=0.369, p<0.001), toplam plak yükü (r=0.424, p<0.001), miks plak (r=0.454, p<0.001), kalsifik olmayan plak (r=0.369, p<0.001), kalsifik plak (r=0.191, p=0.007) ve hasta damar segmenti sayısı (r=0.449, p<0.001) ile anlamlı pozitif korelasyon göstermekte idi. Ayrıca, multivaryant lojistik reg-resyon analizinde, EYD volümünün DM hastalarında KAH varlığı için önem-li ve bağımsız bir prediktör olduğu saptandı (OR=1.023, 95% CI: 1.014-1.032; p<0.001). Tartışma: DM hastalarında KAH varlığı için EYD volümünün bağım-sız bir prediktör olduğunu saptadık. Dahası, EYD volümü toplam plak yükü ve miks ve kalsifik olmayan plak sayısı ile orta derece korelasyon göstermekte iken, kalsifik plak sayısı ile zayıf korelasyon göstermekte idi.
Anahtar Kelimeler
Epikardiyal Yağ Dokusu; Koroner Arter Hastalığı; Koroner Plak
Abstract
Aim: Epicardial adipose tissue (EAT) contributes to the development and progression of coronary artery disease (CAD). We aimed to evaluate the re-lationship between EAT volume, coronary atherosclerosis, coronary plaque burden, and plaque structure in diabetic patients. Material and Method: 196 DM patients who were evaluated with 128-slice dual- source coronary com-puted tomography angiography (CCTA) for suspected CAD were included in the study. The CCTA examination was used to assess the total plaque burden, number of diseased segments, plaque characteristics, and EAT volume. The study population was divided into two groups [a CAD group (Group I) and non-CAD group (Group II)]. The plaque characteristics were analyzed on a per-seg-ment basis. Results: EAT volume was found to be signiicantly higher among diabetic patients with CAD compared to those without CAD ( 138.7±49.1 ml vs 98.6±34.7 ml, p<0.001). In the correlation analysis, EAT volume showed signiicant positive correlation with BMI (r=0.369, p<0.001), total plaque burden (r=0.424, p<0.001), mixed plaques (r=0.454, p<0.001), non-calciied plaques (r=0.369, p<0.001), calciied plaques (r=0.191, p=0.007), and number of diseased segments (r=0.449, p<0.001). Also, multivariate logistic-regres-sion analysis revealed that EAT volume to be a signiicant and independent predictor of the presence of CAD in patients with DM (OR=1.023, 95% CI: 1.014-1.032; p<0.001). Discussion: We have determined that EAT volume is an independent predictor among diabetic patients for the presence of CAD. Moreover, EAT volume showed moderate correlation with total plaque burden and the number of mixed and non-calciied plaques but weak correlation with calciied plaques.
Keywords
Epicardial Adipose Tissue; Coronary Artery Disease; Coronary Plaque
Introduction
Diabetes mellitus (DM) is considered to be an important risk factor for cardiovascular diseases. Chronic inlammation and oxidative stress, which play key roles in the development of ath-erosclerotic disease, are increased in diabetic patients [1]. As morbidity and mortality increase due to coronary artery disease (CAD) in diabetic patients, many studies have focused on mark-ers that can predict CAD and can provide prognostic informa-tion about diabetics.
Epicardial adipose tissue (EAT) is the visceral fat tissue that surrounds the heart and coronary arteries. By secreting various pro- and anti-inlammatory cytokines and chemokines by en-docrine and paracrine activity, EAT contributes to the coronary atherosclerosis process [2]. Studies have shown that EAT is in-creased in CAD, and associated with the presence and extent of CAD [3-4]. There are also reports that EAT may be a predictor for future cardiovascular events [5]. A study that investigated the association of EAT with CAD in diabetic patients revealed its association with the presence and extent of CAD [6]. The irst method used to measure EAT thickness was echocar-diography. However, methods that allow for extensive volumet-ric measurements such as magnetic resonance imaging (MRI) and multidetector computed tomography (MDCT) are preferred today. Accordingly, EAT volume measured by MDCT shows greater reproducibility than echocardiographically-measured EAT thickness [7]. Additionally, knowledge of the degree of cor-onary artery stenosis and the structure of corcor-onary plaque with MDCT provides extra beneits [8].
Although the relationship between EAT volume and CAD is well documented, there are no data concerning the relationship be-tween EAT volume and coronary plaque burden and structure in diabetic patients.
Therefore, we aimed to evaluate the association between EAT volume, coronary atherosclerosis, and coronary plaque burden and structure in diabetics.
Material and Method Study population
This retrospective analysis was performed in a subset of 842 patients who were admitted into our Cardiology department for cardiovascular evaluation between April 2009 and February 2016 and in whom coronary computed tomography angiogra-phy (CCTA) was performed for suspicion of CAD ater clinical assessment. 196 diabetic patients among this group were in-cluded in the study. The indications for CCTA in the study popu-lation were atypical chest pain with an intermediate risk for CAD, inconclusive or interpretable stress test result, suspected coronary anomalies, and exclusion of CAD among patients un-dergoing noncoronary cardiac surgery. Ater an evaluation of the CCTA images, the study population was divided into two groups [CAD group (Group I) and non-CAD group (Group II)] on the basis of the presence of coronary plaques. Missing infor-mation regarding demographic and clinical features of the pa-tients and their medications was supplied through evaluation of patient records.
Patients with previously documented CAD, acute coronary syn-drome (ACS), percutaneous coronary intervention, coronary by-pass surgery, heart failure, renal disease, malignancy, active or
chronic inlammatory diseases, and hepatic dysfunction were excluded from the study.
Diabetes mellitus was deined as a fasting plasma glucose level >126 mg/dl or hemoglobin A1c (HbA1c) >6.5% or current treatment with insulin or oral hypoglycemic agents. Hyperten-sion (HT) was deined as systolic blood pressure >140 mmHg or diastolic blood pressure >90 mmHg or treatment with antihy-pertensive drugs.
Laboratory measurements
Relevant laboratory test results that had been measured at the time of cardiovascular evaluation (before CCTA procedures) were obtained from medical reports. Hemoglobin, platelet val-ues, and white blood cell count were obtained from the auto-mated CBC using a Sysmex XE-2100 Autoauto-mated Hematology Blood Analyzer System (Sysmex, Kobe, Japan). Biochemical parameters were measured with a Cobas 8000 Modular Ana-lyzer (Roche Diagnostics, Indianapolis, USA) using commercially available assay kits.
Coronary computed tomography angiography: image acquisi-tion
the plaque characteristics on a per-segment basis according to the modiied American Heart Association classiication [9]. Plaques were deined as structures >1 mm2 within and/or ad-jacent to the vessel lumen, which could be clearly distinguished from the lumen and surrounding pericardial tissue. Coronary plaques were classiied as non-calciied, calciied, and mixed according to their structure. Plaques without any calciication were deined as non-calciied plaques, plaques with more than 50% of the plaque area occupied by calciied tissue (density ≥130 HU in native scans) were deined as calciied, and plaques with less than 50% calciied tissue were deined as mixed type [10]. All plaque components were assessed on a per-segment basis. The number of all plaques (total plaque burden), as well as plaques with diferent features, were calculated per patient. Inter-observer agreement for the detection of any plaque/pa-tient and plaque/segment was excellent (Cohen’s κ=0.91 and 0.83, respectively).
Epicardial adipose tissue volume measurement
EAT was deined as the adipose tissue within the visceral epi-cardium. The layer of epicardium was manually traced from the mid-let atrium to the let ventricular apex with 10 mm thick spacing between each image; all extrapericardial tissue was excluded. The computer sotware automatically constructed a three-dimensional image of the epicardium. EAT volume was quantiied by calculating the total volume of the tissue whose CT density ranged between -250 HU and -30 HU within the epicardium [3]. This range can efectively exclude myocardium, coronary arteries, coronary calcium, and blood pool. Measure-ments were done separately on a workstation (Leonardo, Sie-mens Healthcare, Germany) with dedicated sotware (Syngo, Siemens Healthcare, Germany). The reproducibility of the EAT volume measurements was evaluated in a random sample of 24 participants and the intra- and inter-observer reproducibilities for EAT volume were excellent (correlation coeicients 0.98 and 0.97, respectively).
Statistical analysis
All data were loaded to the SPSS 15 program. The normal dis-tribution of the data was tested using the Kolmogorov–Smirnov test. Logarithmic transformation was performed on all non-normally distributed variables. The Student’s t test was used to compare two groups of values. Comparison of categorical val-ues was carried out by the chi-square test. Any correlation be-tween data was tested with the Spearman correlation analysis. Multivariate logistic-regression analysis was also performed, and the model included the potential confounders (age, male sex, body mass index, serum creatinine, low-density lipoprotein, high-density lipoprotein, HbA1c, hypertension, smoking, epicar-dial adipose tissue volume). While the continuous data were ex-pressed with ‘mean ± SD (standard deviation)’, the categorical data were expressed with percentage values and a p value of <0.05 was accepted as statistically signiicant.
Results
Baseline clinical characteristics
One hundred and fourteen diabetic patients with CAD (Group I, 54 males; mean age 56.5±9.4) and 82 diabetic patients without
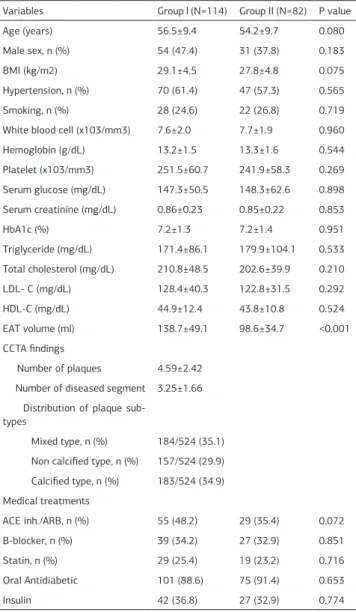
CAD (Group II, 31 males; mean age 54.2±9.7) were included in the study. Demographic, clinical, and laboratory characteristics of the patients are presented in Table 1. There was no
statisti-cally signiicant diference between the groups regarding age, sex, BMI, hypertension, smoking history, white blood cell counts, hemoglobin, platelet, serum glucose, serum creatinine, HbA1c, triglyceride, total cholesterol, low-density lipoprotein choles-terol (LDL-C), high-density lipoprotein cholescholes-terol (HDL-C) val-ues, and medication use (p>0.05) (Table 1). EAT volumes were signiicantly higher in the CAD group compared to the non-CAD group (138.7±49.1 vs 98.6±34.7, p<0.001) (Figure 1).
In the CAD group, the number of plaques was 4.59±2.42 and the number of diseased segments was 3.25±1.66. When distribu-tion of plaque sub-types of all 524 detected plaques was exam-ined, the most common lesion was mixed type (n=184, 35.1%), followed by calciied type (n=183, 34.9%), and non-calciied types (n=157, 29.9%).
Association of EAT volume with clinical characteristics, labora-tory indings, and coronary plaque burden and sub-types
Table 1. Baseline clinical and biochemical characteristics of study groups
Variables Group I (N=114) Group II (N=82) P value
Age (years) 56.5±9.4 54.2±9.7 0.080
Male sex, n (%) 54 (47.4) 31 (37.8) 0.183
BMI (kg/m2) 29.1±4.5 27.8±4.8 0.075
Hypertension, n (%) 70 (61.4) 47 (57.3) 0.565
Smoking, n (%) 28 (24.6) 22 (26.8) 0.719
White blood cell (x103/mm3) 7.6±2.0 7.7±1.9 0.960
Hemoglobin (g/dL) 13.2±1.5 13.3±1.6 0.544
Platelet (x103/mm3) 251.5±60.7 241.9±58.3 0.269
Serum glucose (mg/dL) 147.3±50.5 148.3±62.6 0.898
Serum creatinine (mg/dL) 0.86±0.23 0.85±0.22 0.853
HbA1c (%) 7.2±1.3 7.2±1.4 0.951
Triglyceride (mg/dL) 171.4±86.1 179.9±104.1 0.533
Total cholesterol (mg/dL) 210.8±48.5 202.6±39.9 0.210
LDL- C (mg/dL) 128.4±40.3 122.8±31.5 0.292
HDL-C (mg/dL) 44.9±12.4 43.8±10.8 0.524
EAT volume (ml) 138.7±49.1 98.6±34.7 <0.001
CCTA indings
Number of plaques 4.59±2.42
Number of diseased segment 3.25±1.66 Distribution of plaque
sub-types
Mixed type, n (%) 184/524 (35.1)
Non calciied type, n (%) 157/524 (29.9)
Calciied type, n (%) 183/524 (34.9)
Medical treatments
ACE inh./ARB, n (%) 55 (48.2) 29 (35.4) 0.072
B-blocker, n (%) 39 (34.2) 27 (32.9) 0.851
Statin, n (%) 29 (25.4) 19 (23.2) 0.716
Oral Antidiabetic 101 (88.6) 75 (91.4) 0.653
Insulin 42 (36.8) 27 (32.9) 0.774
Abbrevations: BMI, body mass index; LDL, low density lipoprotein cholesterol; HDL-C, high density lipoprotein cholesterol; EAT, epicardial adipose tissue; CCTA, coronary computed tomography angiography; ACE, anjiotensin convert-ing enzyme inhibitor; ARB, angiotensin receptor blocker
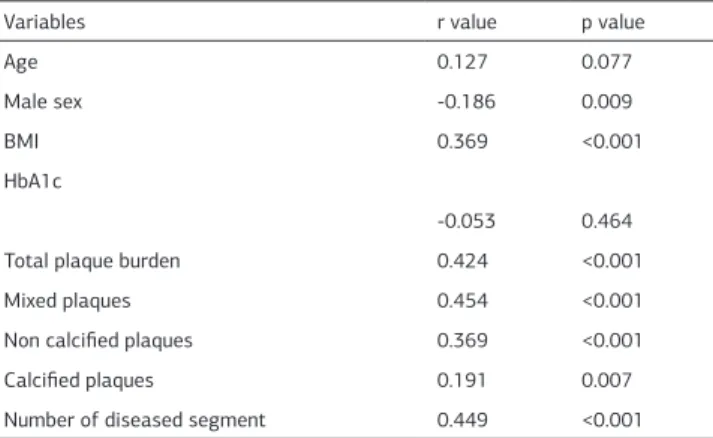
In the correlation analysis, EAT volume was signiicantly corre-lated with male sex (r=-0.186, p=0.009), BMI (r=0.369, p<0.001), total plaque burden (r=0.424, p<0.001), mixed plaques (r=0.454, p<0.001) (Figure 2), non calciied plaques (r=0.369, p<0.001) (Figure 3) and calciied plaques (r=0.191, p=0.007) in the CAD group (Table 2). Furthermore, EAT volume was signiicantly positively correlated with the number of diseased segments (r=0.449, p<0.001).
Association of EAT volume with the presence of coronary artery disease
Simple logistic-regression analysis revealed that EAT volume (OR=1.023, 95%CI:1.014-1.032; p<0.001) was associated with the presence of CAD in all patients. This variable was then en-tered into a backward stepwise multivariate logistic-regression model. Multivariate logistic-regression analysis demonstrat-ed that EAT volume is a signiicant and independent prdemonstrat-edic- predic-tor for the presence of CAD in patients with DM (OR=1.023, 95%CI:1.014-1.032; p<0.001) (Table 3).
Discussion
In the present study, we determined higher EAT volumes in dia-betic patients with CAD than in non-CAD patients. Moreover, EAT volume was associated with plaque structure, and showed Figure 1. Epicardial adipose tissue (EAT) volume in coronary artery disease (CAD)
group (Group I) and non-CAD group (Group II) in patients with diabetes mellitus
Figure 2. Correlation between epicardial adipose tissue (EAT) volume and mixed-type plaques
Figure 3. Correlation between epicardial adipose tissue (EAT) volume and non-calciied plaques
Table 2. Correlation analysis between Epicardial Adipose Tissue Volume and various parameters in patients with coronary artery disease
Variables r value p value
Age 0.127 0.077
Male sex -0.186 0.009
BMI 0.369 <0.001
HbA1c
-0.053 0.464
Total plaque burden 0.424 <0.001
Mixed plaques 0.454 <0.001
Non calciied plaques 0.369 <0.001
Calciied plaques 0.191 0.007
Number of diseased segment 0.449 <0.001
Abbrevations: BMI, body mass index;
Table 3. Univariate and Multivariate regression analysis for the presence of coronary artery disease in all patients
Univariate Logistic
Regression Multivarite Logistic Regression Analysis
Odds Ratio
95% CI P Value Odds
Ratio
95% CI P
Val-ue
Age (years) 1.030 1.000-1.062 0.053
Male (sex) 0.710 0.399-1.264 0.245
BMI (kg/m2) 1.059 0.995-1.126 0.070
Serum creatinine
1.141 0.321-4.054 0.839
LDL-C (mg/dL) 1.004 0.997-1.012 0.275
HDL-C (mg/dL) 1.004 0.980-1.029 0.745
HbA1c 1.015 0.818-1.261 0.891
Hypertension 0.875 0.491-1.557 0.649
Smoking 1.221 0.640-2.331 0.545
EAT volume 1.023 1.014-1.032 <0.001 1.023
1.014-1.032
<0.001
5
a moderate correlation with mixed plaques and non-calciied plaques, and weak correlation with calciied plaques.
Epicardial adipose tissue is the visceral adipose tissue that is in direct contact with myocardium and coronary arteries. EAT originates from the same embryological tissue as abdominal visceral adipose tissue (VAT), namely splanchnopleuric me-soderm. By secreting various inlammatory mediators, EAT triggers the pathogenesis of atherosclerosis via its paracrine efects [2]. Studies have shown an association between EAT thickness and the presence and extent of CAD [4]. Furthermore, the myocardial ischemia-related ventricular repolarization pa-rameters Tp-e and Tp-e/QT are also increased in patients with thicker EAT [11]. A study by Park et al. that evaluated the as-sociation between EAT thickness and plaque structure using virtual histology intravascular ultrasound (VH-IVUS) revealed that thin-cap ibroatheromas (TCFAs) and higher necrotic core burden are associated with EAT thickness [12]. It is also a fact that echocardiography, one of the most common methods for evaluating EAT, has limitations related to echocardiographic acoustic window quality and to which EAT thickness localiza-tion represents CAD risk more appropriately. In contrast, volu-metric quantiication of EAT using MDCT has been shown to have superior reproducibility compared to thickness and area measurements [7]. Studies that have investigated the associa-tion between EAT volume and CAD have revealed a signiicant correlation between the presence and extent of obstructive and non-obstructive CAD and EAT volume, as well as coronary artery calcium (CAC) score, a marker for the extent of CAD [3,13,14]. In the subanalysis of Multi-Ethnic Study of Athero-sclerosis (MESA), EAT volume was associated with risk of acute myocardial infarction, resuscitated cardiac arrest, angina, and fatal coronary heart disease based upon 5 years of follow-up [5]. Similarly, in another study, increased EAT volume was di-rectly associated with CAD and predicted major adverse car-diac events (MACE) independent of the age, gender, and con-ventional risk factors [15].
Recent studies have investigated the relationship between epicardial fat volume and CAD in diabetic patients. A study by
Wang et al. demonstrated higher EAT volumes in type 2 diabetic patients compared to non-diabetic patients, and EAT volume was associated with components of metabolic syndrome, a CAC score which relects the extent of CAD, and Gensini score [6]. On the other hand, a study by Groves et al. determined higher EAT volumes in type 2 diabetic patients and the higher EAT volume was associated with CAD severity. EAT volume >120 mL was emphasized as an independent predictor for the presence of signiicant CAD [16]. A study presented by Mohar et al. reported similar indings and showed that increased EAT volume in as-ymptomatic patients with Type 2 DM was associated with the presence of severe CAD, independent of BMI and CAC scores, and traditional cardiovascular risk factors [17]. Similarly, we have demonstrated higher EAT volumes in the CAD group than in the non-CAD group among diabetic patients. EAT volume was also signiicantly correlated with indexes of CAD severity such as total plaque burden and the number of diseased segments. Moreover, we have shown that EAT volume is an independent predictor for the presence of CAD in diabetic patients.
Coronary computed tomography angiography can provide in-formation on both the degree of coronary stenosis and plaque morphology [8]. Another study has shown that non-calciied and mixed plaque types are more common in acute coronary syndrome (ACS) patients and the incidence of cardiac events is more common in non-calciied and mixed plaques compared to calciied plaques [18]. While the association between EAT volume and the presence of coronary atherosclerosis has been extensively studied, its association with coronary plaque mor-phology is still unclear. Recent studies have focused on this as-pect. A study by Ding et al. has shown that EAT volume was signiicantly associated with the presence of calciied plaques and the Agatston CAC score [19]. Furthermore, a study by Bet-tencourt et al., reported that EAT volume was signiicantly as-sociated with the number of coronary segments with athero-sclerotic plaques and the number of segments with signiicant stenosis, and that increased EAT volume was an independent predictor for a higher CAC score [20]. In a prospective study that investigated the changes in coronary plaque structure and EAT volume, it was reported that increased EAT volume was a predictor for the progression of calciied plaques [21]. Like-wise, in our study, EAT volume was signiicantly correlated with the number of diseased segments and the number of calciied plaques.
As there is a known relationship between vulnerable plaque structure and the development of ACS, the association of EAT volume with the presence of vulnerable plaques and its com-ponents has been rigorously investigated. A study by Ito et al. demonstrated that patients with CT-derived vulnerable plaques with low CT attenuation (CT density value of the plaque <30 HU) and large remodeling index (remodeling index >1.10) had higher EAT volume and that it was an independent predictor for the presence of vulnerable plaques [22]. Another study investi-gated the association between EAT volume and plaque char-acteristics. It reported that in patients with non-calciied and mixed plaques, EAT volume was higher compared to those with calciied plaques, and that it was an independent predictor for non-calciied plaques and obstructive CAD [23]. Additionaly, in a study presented by Oka et al. on the association between non-Figure 4. Sub-types of coronary plaques. Calciied plaque (A), Non-calciied plaque
(B), and Mixed plaque (C) are shown with white arrow.
Figure 5. Quantiication of the EAT volume. Segmentation of epicardial adipose tissue was achieved tracing the pericardium in the axial view (pink line). Within a smooth closed pericardial contour, the sotware automatically identiied adipose tissue by using the threshold attenuation values of -30 to -250 HU (pink area). EAT, epicardial adipose tissue; HU, Hounsield units.
calciied plaque features and EAT volume, it was shown that higher EAT volume is an independent predictor for vulnerable plaque components such as low-density plaque and positive re-modeling [24]. The relationship between EAT volume and car-diovascular events has also been investigated. A study by Na-kanishi et al. has shown that in patients followed up with MDCT, increased EAT volume was associated with increased long-term ACS outcomes [25]. Moreover, an association between EAT vol-ume and fatal and non-fatal coronary events, independent from the cardiovascular risk factors, has been reported in recent studies [5,15]. In accordance with these studies, we have also detected a moderate correlation between EAT volume and the number of vulnerable plaques, such as mixed and non-calciied plaques. Another striking result of our study is that EAT volume showed a weak correlation with the number of calciied plaques. In our study, the positive correlation, especially with EAT volume and the vulnerable plaques, supports the association of EAT vol-ume and long-term adverse cardiovascular outcomes.
Study Limitations
Firstly, in the present study, we could not measure serum or tissue inlammatory cytokines, adipokines, and markers such as hs-CRP all of which can lead to accelerated atherosclero-sis or plaque vulnerability. Secondly, the potential incremental value of EAT measurements for cardiovascular risk prediction was also not tested, as no event follow-up was done. Finally, the study population belonged to a single ethnic group and it is unclear if our results are applicable to other ethnic groups.
Conclusion
In our study we have shown that EAT volume is an independent predictor for CAD in diabetic patients. Moreover, EAT volume showed moderate correlation with total plaque burden, num-ber of diseased segments, and the numnum-ber of mixed and non-calciied plaques. It showed a weak correlation with non-calciied plaques. EAT volume may be a potential alternative marker for the presence of CAD in diabetic patients and may contribute to risk assessment for coronary events and to the selection of suitable treatment strategies in diabetic patients.
Competing interests
The authors declare that they have no competing interests.
References
1. King GL, Loeken MR. Hyperglycemia-induced oxidative stress in diabetic com-plications. Histochem Cell Biol 2004;122:333–8.
2. Sacks HS, Fain JN. Human epicardial adipose tissue: a review. Am Heart J 2007;153:907–17.
3. Sarin S, Wenger C, Marwaha A, Qureshi A, Go BD, Woomert CA, et al. Clinical signiicance of epicardial fat measured using cardiac multislice computed tomog-raphy. Am J Cardiol 2008;102:767–71.
4. Eroglu S, Sade LE, Yildirir A, Bal U, Ozbicer S, Ozgul AS, et al. Epicardial adipose tissue thickness by echocardiography is a marker for the presence and severity of coronary artery disease. Nutr Metab Cardiovasc Dis 2009;19(3):211-7. 5. Ding J, Hsu FC, Harris TB, Liu Y, Kritchevsky SB, Szklo M, et al. The association of pericardial fat with incident coronary heart disease: the Multi-Ethnic Study of Atherosclerosis (MESA). Am J Clin Nutr 2009;90:499–504.
6. Wang CP, Hsu HL, Hung WC, Yu TH, Chen YH, Chiu CA, et al. Increased epi-cardial adipose tissue (EAT) volume in type 2 diabetes mellitus and association with metabolic syndrome and severity of coronary atherosclerosis. Clin Endocrinol (Oxf) 2009;70(6):876–82.
7. Gorter PM, van Lindert AS, de Vos AM, Meijs MF, van der Graaf Y, Doeven-dans PA, et al. Quantiication of epicardial and peri-coronary fat using cardiac computed tomography; reproducibility and relation with obesity and metabolic
syndrome in patients suspected of coronary artery disease. Atherosclerosis 2008;197:896–903.
8. Miller JM, Rochitte CE, Dewey M, Arbab-Zadeh A, Niinuma H, Gottlieb I, et al. Diagnostic performance of coronary angiography by 64-row CT. NEJM 2008;359:2324–36.
9. AustenWG, Edwards JE, Frye RL, Gensini GG, Gott VL, Griith LS, et al. A report-ing system on patients evaluated for coronary artery disease. Report of the Ad Hoc Committee for Grading of Coronary Artery Disease, Council on Cardiovascular Surgery, American Heart Association. Circulation 1975;51:5–40.
10. Leber AW, Becker A, Knez A, von Ziegler F, Sirol M, Nikolaou K, et al. Accuracy of 64-slice computed tomography to classify and quantify plaque volumes in the proximal coronary system: a comparative study using intravascular ultrasound. J Am Coll Cardiol 2006;47:672–7.
11. Kaplan O, Kurtoglu E, Nar G, Yasar E, Gozubuyuk G, Dogan C, et al. Evaluation of Electrocardiographic T-peak to T-end Interval in Subjects with Increased Epi-cardial Fat Tissue Thickness. Arq Bras Cardiol 2015;105(6):566-72.
12. Park J-S, Choi S-Y, Zheng M, Yang H-M, Lim H-S, Choi B-J, et al. Epicardial adipose tissue thickness is a predictor for plaque vulnerability in patients with signiicant coronary artery disease. Atherosclerosis 2013;226:134-9.
13. Taguchi R, Takasu J, Itani Y, Yamamoto R, Yokoyama K, Watanabe S, et al. Pericardial fat accumulation in men as a risk factor for coronary artery disease. Atherosclerosis 2001;157:203–9.
14. Rosito GA, Massaro JM, Hofmann U, Ruberg FL, Mahabadi AA, Vasan RS, et al. Pericardial fat, visceral abdominal fat, cardiovascular disease risk factors, and vascular calciication in a community based sample: the Framingham Heart Study. Circulation 2008;117:605–13.
15. Hajsadeghi F, Nabavi V, Bhandari A, Choi A, Vincent H, Flores F, et al. Increased epicardial adipose tissue is associated with coronary artery disease and major adverse cardiovascular events. Atherosclerosis 2014;237(2):486-9.
16. Groves EM, Erande AS, Le C, Salcedo J, Hoang KC, Kumar S, et al. Compar-ison of Epicardial Adipose Tissue Volume and Coronary Artery Disease Sever-ity in Asymptomatic Adults with versus without Diabetes Mellitus. Am J Cardiol 2014;114(5):686-91.
17. Mohar DS, Salcedo J, Hoang KC, Kumar S, Saremi F, Erande AS, et al. Epicardial adipose tissue volume as a marker of coronary artery disease severity in patients with diabetes independent of coronary artery calcium: Findings from the CTRAD study. Diabetes Res Clin Pract 2014;106(2):228-35.
18. Pundziute G, Schuijf JD, Jukema JW, Decramer I, Sarno G, Vanhoenacker PK, et al. Evaluation of plaque characteristics in acute coronary syndromes: non-invasive assessment with multi-slice computed tomography and non-invasive eval-uation with intravascular ultrasound radiofrequency data analysis. Eur Heart J 2008;29(19):2373–81.
19. Ding J, Kritchevsky SB, Harris TB, Burke GL, Detrano RC, Szklo M, et al. The as-sociation of pericardial fat with calciied coronary plaque. Obesity (Silver Spring) 2008;16:1914–9.
20. Bettencourt N, Toschke AM, Leite D, Rocha J, Carvalho M, Sampaio F, et al. Epicardial adipose tissue is an independent predictor of coronary atherosclerotic burden. Int J Cardiol 2012;158(1):26-32.
21. Mahabadi AA, Lehmann N, Kalsch H, Kälsch H, Bauer M, Kara K, et al. Associa-tion of epicardial adipose tissue with progression of coronary artery calciicaAssocia-tion is more pronounced in the early phase of atherosclerosis: Results from the Heinz Nixdorf recall study. JACC Cardiovasc Imaging 2014;7:909–16.
22. Ito T, Suzuki Y, Ehara M, Matsuo H, Teramoto T, Terashima M, et al. Impact of epicardial fat volume on coronary artery disease in symptomatic patients with a zero calcium score. Int J Cardiol 2013;167(6):2852-8.
23. Alexopoulos N, McLean DS, Janik M, Arepalli CD, Stillman AE, Raggi P. Epicar-dial adipose tissue and coronary artery plaque characteristics. Atherosclerosis 2010;210(1):150-4.
24. Oka T, Yamamoto H, Ohashi N, Kitagawa T, Kunita E, Utsunomiya H, et al. Association between epicardial adipose tissue volume and characteristics of non-calciied plaques assessed by coronary computed tomographic angiography. Int J Cardiol 2012;161:45-9.
25. Nakanishi K, Fukuda S, Tanaka A, Otsuka K, Jissho S, Taguchi H, et al. Persis-tent epicardial adipose tissue accumulation is associated with coronary plaque vulnerability and future acute coronary syndrome in non-obese subjects with coronary artery disease. Atherosclerosis 2014;237:353-60.
How to cite this article: