ACCURACY IMPROVEMENT BY THE LEAST SQUARES IMAGE MATCHING
EVALUATED ON THE CARTOSAT-1
H. Afsharnia *, A. Azizi, H. Arefi
School of Surveying and Geospatial Engineering, University of Tehran, Tehran, Iran – (afsharnia, aazizi, hossein.arefi)@ut.ac.ir
KEY WORDS: DEM Accuracy Improvement, LSM, Parallel Projection Geometry
ABSTRACT:
Generating accurate elevation data from satellite images is a prerequisite step for applications that involve disaster forecasting and management using GIS platforms. In this respect, the high resolution satellite optical sensors may be regarded as one of the prime and valuable sources for generating accurate and updated elevation information. However, one of the main drawbacks of conventional approaches for automatic elevation generation from these satellite optical data using image matching techniques is the lack of flexibility in the image matching functional models to take dynamically into account the geometric and radiometric dissimilarities between the homologue stereo image points. The classical least squares image matching (LSM) method, on the other hand, is quite flexible in incorporating the geometric and radiometric variations of image pairs into its functional model. The main objective of this paper is to evaluate and compare the potential of the LSM technique for generating disparity maps from high resolution satellite images to achieve sub pixel precision. To evaluate the rate of success of the LSM, the size of the y-disparities between the homologous points is taken as the precision criteria. The evaluation is performed on the Cartosat-1 stereo along track images over a highly mountainous terrain. The precision improvement is judged based on the standard deviation and the scatter pattern of the y-disparity data. The analysis of the results indicate that, the LSM has achieved the matching precision of about 0.18 pixels which is clearly superior to the manual pointing that yielded the precision of 0.37 pixels.
1. INTRODUCTION
The manipulation and analysis of many GIS based environmental issues related to the global warming, pollution, drought, water resources, etc. require accurate and updated digital elevation data. Moreover, the success of the natural disaster forecast and management may also dependent on the geometric quality of the generated digital elevation data. In this respect, the elevation data derived from the air based photogrammetric approach is the most precise of all but suffers from the large number of photos to be taken and handled to cover the entire area of interest. The laser ranging technology has also indicated to be quite promising for topographical information extraction. The laser sensors, however, due to their narrow field of view have limited area coverage and the rate of data processing increases drastically if the larger ground coverage is required.
The more appropriate solution therefore is the satellite based sensor platforms. In this respect, active satellite sensors, in particular interferometric methods have proven to be valuable for studies of earth crust displacement by generating precise elevation information (Gens et al., 1996). However, in spite of the relative precision of the elevation information generated by the latter approach, there are some situations in which the phase ambiguity cannot be resolved properly and the absolute phase retrieval may not be feasible. Therefore, the satellite optical sensors may be regarded as a valuable dataset for the topographic information extraction as a complementary technique to those generated by other acquisition devices. It may also fill the gap wherever the other approaches fail to generate elevation information with required accuracy.
Assuming vertical stereo pairs, the following simplified relation can be derived to compute the elevation of a point (Wolf et al., 2000):
. f px B H
Z
(1)
where = satellite flying height
= elevation of a point on the ground = sensor focal length
= stereo image base line = measured x-disparity
Using a rule of thumb and based on the error propagation principles applied to (1), the following a priori accuracy estimation can be derived for the calculated height on the ground:
. 2 x f H B H
Z
(2)
where = a priori accuracy estimation of the height = standard deviation of the x-component
Based on (2), it can be seen that for any given stereo pairs the values of and are fixed; therefore, the elevation accuracy improvement may be achieved only by improving the measurement precision of the image coordinates. That is, the accuracy improvement is obtainable only by improving the image matching precision. Sections that follow describe the LSM strategy and compare the precision improvement of LSM with other conventional approaches.
2. LSM MATHEMATICAL MODEL
The well-known Least Squares Image Matching is a non-linear set of equations that express the radiometric relations between
The International Archives of the Photogrammetry, Remote Sensing and Spatial Information Sciences, Volume XL-1/W5, 2015 International Conference on Sensors & Models in Remote Sensing & Photogrammetry, 23–25 Nov 2015, Kish Island, Iran
This contribution has been peer-reviewed.
the two homologous windows as a function of the geometric shifts of one window with respect to the other. Thus, for any pixel, selected from one stereo pair, the following equation holds true (Atkinson, 2001):
f(x,y)g(xx,yy) (3)
where = radiometric value of the second stereo image = corresponding x and y disparities
It should be noted, however, that (3) is highly non-linear,
therefore, linearization may be performed based on the Taylor’s
expansion. Assuming that the linear shifts are invariant for the pixels in any small image window, the following linearized set of equations can then be written for each pixel pairs in two homologous windows, giving high degree of redundancy (Atkinson, 2001): ) , ( ) , ( ) , ( ) , ( ) , ( ) , ( ) , ( ) , ( ) , ( ) , ( ) , ( ) , ( 2 2 2 2 1 1 1 1 2 2 2 2 2 2 1 1 1 1 1 1 2 1 n n n n n n n n n n
n gx y f x y
y x f y x g y x f y x g dy dx y y x g x y x g y y x g x y x g y y x g x y x g v v v (4)
where = random radiometric errors
= differential corrections to the shift values
Equation (4) requires very close initial approximations for the unknown parameters which are determined by performing an initial image matching based on a simple manual measurement.
However, the corresponding matching windows have scale distortion and radiometric dissimilarities, which are quite significant for the stereo along track satellite images (see Fig. 1). Therefore, (4) may be modified to take into account the scale distortion and radiometric differences.
Figure 1. Two examples of radiometric blurring and scale distortion between two homologous windows
This modification is achieved by applying an affine transformation and radiometric drift and offset corrections into the functional model given by (3), that is: (Atkinson, 2001),
2 1 ( ', ')
) ,
(x y hg x y h
f (5)
where = radiometric drift between the matched points = radiometric offset
And , are related to the pixel positions by the following 2D affine transformation:
Ty x e c b a y x y x y x 1 0 0 0 0 1 0 0 ' ' (6)
where = transformation parameters
Affine transformation parameters related to the geometric scale
distortion and shift. The linearized form of (5) by the Taylor’s
expansion will, then, be (Atkinson, 2001):
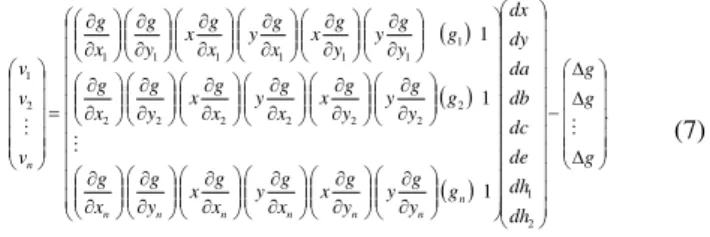
. 1 1 1 2 1 2 2 2 2 2 2 2 1 1 1 1 1 1 1 2 1 g g g dh dh de dc db da dy dx g y g y y g x x g y x g x y g x g g y g y y g x x g y x g x y g x g g y g y y g x x g y x g x y g x g v v v n n n n n n n n (7)
where = differential corrections = radiometric differences
Equation (7) is implemented in this research work and its accuracy improvement potential is evaluated using the stereo Cartosat-1 satellite images. Spatial resolution of forward and backward images are about 2.8 and 2.2 meters respectively (Lutes, 2006).
Now, to judge the success of (7) in achieving accuracy improvement, the concept of the epipolar geometry is employed. This is described in the section that follows.
3. PRECISION CRITERION FOR THE LSM
To evaluate the success of (7) in achieving sub-pixel precision for x-disparity determination, it is necessary to find an objective and reliable criteria against which such judgment is possible. The most reliable criterion in this regard is the size of the y-disparities of the matched points. This approach is superior to those that incorporate ground control points to evaluate the accuracy, since y-disparities are independent of any errors and inaccuracies associated with the identification and measurement of the ground coordinates of the control points. To determine the y-disparities, it is necessary to find the corresponding epipolar lines in the stereo satellite images. This requires the relative attitude and position of one stereo pair with respect to the other. This is described in the following paragraph.
Under the satellite constant attitude constant velocity (CACV) movement assumption for the push broom sensors, image formation process along the satellite route is very close to parallel geometry. That is, the points on the ground are imaged by the parallel rays along the satellite track. Thus, the parallel projection geometry may be employed to mathematically define the imaging process along the satellite route.
It can be shown that the 3D affine transformation mathematically describes the parallel imaging geometry. Written for corresponding points in two stereo along track images, the 3D affine transformation is given by (Morgan, 2004):
The International Archives of the Photogrammetry, Remote Sensing and Spatial Information Sciences, Volume XL-1/W5, 2015 International Conference on Sensors & Models in Remote Sensing & Photogrammetry, 23–25 Nov 2015, Kish Island, Iran
This contribution has been peer-reviewed.
(8)
where = pixel coordinates
= 3D ground coordinates of a point = 3D affine transformation coefficients
Solving for and in the first two equations and replacing them in the second equation yields (Morgan, 2004):
(9)
where = replacement coefficients
Eliminating in (9) by calculating in terms of from the first equation and replacing it in the second, gives (Morgan, 2004):
(10)
where = newly defined coefficients
Equation (10) expresses the epipolar line geometry under the CACV assumption. The coefficients of (10) can be derived easily by employing at least four homologous points in the stereo images. With homologous points, the coefficients can be determined by the solution of the following linear equations (Morgan, 2004):
(11)
The calculated coefficients of (11) can then be employed to evaluate the precision of the matched image points. This is achieved by computing the values of y-disparity, based on the following relation (Morgan, 2004):
(12)
The unit of is in pixels and the smaller the value of for the homologous points, the higher the matching precision. The test results are reported in the section that follows.
4. TEST RESULTS
As already mentioned, the stereo images used to test the LSM success are the Cartosat-1 along track stereo forward and afterward images acquired over a highly mountainous terrain (Fig. 2). Stereo Cartosat-1 satellite images with the resolution of 2.5 meters are acquired by two linear array sensors mounted on board the Cartosat1 sun synchronous satellite launched in 5 May 2005. Sensor specifications are given in Table 1. Due to the unequal look angle of the forward and afterward cameras, the acquired stereo images are influenced by the blurring effect.
Sensor specifications Forward camera
Afterward camera Looking angle
Camera field of view Swath width Number of detectors Focal length Approximate altitude
+26 degree
2·4 degree
29 km 12000 1945 mm 618 km
-5 degree
2·4 degree
26 km 12000 1945 mm 618 km
Table 1: Geometric Specifications of the Cartosat-1 Stereo Images
Figure 2: Reduced resolution stereo images of the test area.
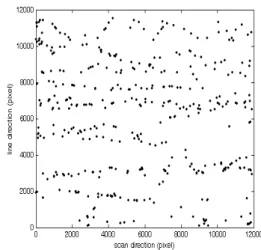
Nearly 402 points are manually measured. These points cover the entire ground coverage of the scene and are selected in such a way that they form salient feature points compared to their surroundings.
Figure 3: Distribution of the measured image points.
In Fig. 3, ordinate represents the satellite flight direction
referred to as the “line direction” and the abscissa indicates the line across the sensor detectors, referred to as “scan direction”.
The measurement precision of these image points are evaluated by applying (11) to at least four well distributed image pairs and subsequently y-disparities, ’s, for these points are determined by (12).
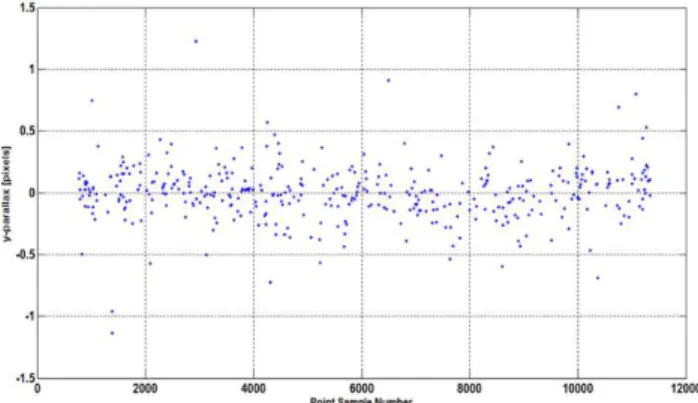
The standard deviation of the ’s for all manual measured points are calculated as 0.37 pixels. Fig. 4 indicates the scatter pattern for all pixels with y-disparities as ordinate and scan directions as abscissa.
The International Archives of the Photogrammetry, Remote Sensing and Spatial Information Sciences, Volume XL-1/W5, 2015 International Conference on Sensors & Models in Remote Sensing & Photogrammetry, 23–25 Nov 2015, Kish Island, Iran
This contribution has been peer-reviewed.
Figure 4: Scatter pattern of y-disparities of the manually measured points
As Fig. 4 indicates, the values of ’s for majority of points are within the range of -0.5 to +0.5 pixels. There are, however, certain points which have been measured with a precision outside this range approaching the range of -1.5 to +1.5 pixel.
In the next step, the LSM approach (7) is implemented and solved iteratively for the same stereo images using the values derived by the manual measurement as the initial approximations for the and shift values given in (6). The standard deviation of the calculated y-disparities is equal to 0.18 pixels. The y-disparity plot for all of the matched points is given in Fig. 5. As it can be seen from the Figure, there is a clear improvement in the matching results as compared with those obtained by the manual approach.
Figure 5: Scatter pattern of y-disparities obtained by the LSM method.
The improvements in the final results clearly show the capability of the LSM which is mainly due to the inclusion of the 2D affine parameters to cater for the geometric differences between the matched windows. The high degree of redundancy in the number of equations also allows the inclusion of further distortion parameters between the matched windows.
5. CONCLUSION
This paper has demonstrated the success of the classical least squares image matching for accurate image point measurements for the stereo along track satellite images. It has been indicated that in spite of the considerable radiometric and geometric distortions between the homologous windows, the LSM approach is converged to a satisfactory result with sub pixel precision.
It is also demonstrated that the size of the y-disparities can be regarded as a reasonable criterion for the evaluation of the
matching precision. The superiority of this criterion over those approaches that employ ground control points to assess the matching accuracy is in the fact that the former approach is not influenced by the accuracy of the measurement of the ground control points and also is independent of the imperfection of the image to object mathematical transformations.
Based on (2), the a priori accuracy estimation for the extracted elevation information from the Cartosat-1 stereo images can be evaluated. This yields 2.8 meters height accuracy if the matching is performed by the manual approach. With the matching carried out by the LSM method, the accuracy is improved to 1.1 meters which is roughly two times higher than the other approach.
ACKNOWLEDGEMENTS
The authors gratefully acknowledge the support they received from Science and Technology Park, IASBS, Zanjan.
REFERENCES
Atkinson, K. B., 2001. Close range photogrammetry and machine vision.
Gens, R., & Van Genderen, J., 1996. Review Article SAR interferometry—issues, techniques, applications. International Journal of Remote Sensing, 17(10), 1803-1835.
Lutes, J., 2006. Photogrammetric processing of Cartosat-1
stereo imagery. Available at
"www.eotec.com/images/LutesCartosat_JACIE2006.pdf". Morgan, M. F., 2004. Epipolar resampling of linear array scanner scenes: Citeseer.
Wolf, P. R., & Dewitt, B. A., 2000. Elements of Photogrammetry: with applications in GIS (Vol. 3): McGraw-Hill New York.
The International Archives of the Photogrammetry, Remote Sensing and Spatial Information Sciences, Volume XL-1/W5, 2015 International Conference on Sensors & Models in Remote Sensing & Photogrammetry, 23–25 Nov 2015, Kish Island, Iran
This contribution has been peer-reviewed.