i Master’s Thesis: January 2017
The effect of humor on group
effectiveness and the mediating
role of psychological safety
Bedar, Omran
Maastricht University School of Business and Economics
Nova School of Business and Economics
Student ID: 25673
Supervisor: Prof. Miguel Pina Cunha &
Prof. Dr. Ad van Iterson
Double Degree M.Sc. International Business & Management
Abstract This study empirically investigates the relationships between adaptive and maladaptive humor styles and the three indicators of group effectiveness, namely productivity, development and group viability. Data was collected from a final sample of 191 students from tutorial groups of Maastricht University. Adaptive humor was found to be positively and maladaptive humor was found to be negatively related to productivity, development and group viability. Psychological Safety was found to mediate the relationship between the two humor styles and group effectiveness with partial mediation for development and adaptive humor and development as well as group viability and maladaptive humor. The results of this study provide insights in humor research, by discerning differences between the two types of humor. Findings and implications for future research are discussed.
group effectiveness
Acknowledgements
The writing of this thesis has been my last contribution as a student at Maastricht University.
There were various individuals that helped me during my academic career and with the
completion of this study. I wish to seize this opportunity to warmly thank all those who lent
their support:
My parents Rahman and Laila, who gave me their unconditional support in every possible
way.
Tutorial group number 51 in the course Management of Organization and Marketing that I
was tutoring and especially Matthias Kinsella, Max Schneider, Lenny Müller, Hannah
Freitag, Jonas Schulte, Larissa Izzo and Tiffany Kaufmann who helped me in transferring
the data from hard copy into the research software.
My friends Carla Burkhard and Alexander Sleegers as well as my sister Jesna for proof
reading and giving me feedback throughout this work.
My supervisors Prof. Miguel Pina Cunha and Prof. Dr. Ad van Iterson, who always took the
time to provide me with valuable feedback and ideas, even though meetings were sometimes
scheduled on a short notice.
iii
Table of Contents
1. Introduction ... 1
2. Literature Review & Hypotheses ... 3
Clarification of the term Humor ... 3
Adaptive Humor Style vs. Maladaptive Humor Style ... 5
Group Effectiveness ... 6
Psychological Safety ... 9
3. Methodology ... 14
Context ... 14
Procedure ... 14
Sampling ... 15
4. Measures ... 16
Demographics ... 16
Humor ... 16
Psychological Safety ... 17
Group Effectiveness ... 17
Control Variables ... 18
5. Analysis... 19
Pilot Study ... 19
Final Sample ... 19
Data Screening and Test of Assumptions ... 20
Hypotheses Testing ... 26
Results of Direct Relationships ... 27
Results of Mediated Relationships ... 31
6. Discussion ... 36
Theoretical Implications ... 37
Limitations ... 39
Practical Implications ... 40
Future Research ... 42
7. Conclusion ... 43
References ... 44
1. Introduction
The term humor derives from the ancient Greeks humoral medicine, which taught that the
balance of fluids in the human body, also known as “humours“, controlled human health and
emotions (Richet, 1910). Nowadays, the term stands for the tendency of particular cognitive
experiences that provoke laughter and provide amusement. The social phenomenon of humor
is omnipresent and visible in people’s life. Humor can shape perceptions in a positive way due
to more fun and joy, but can also have a negative influence. However, humor is not only part
of people’s everyday life, it can also have an impact on an organizational level. It plays an
important role in organizations and researchers have discovered that it can profit organizational
behavior in various ways (Cooper, 2005; Terrion & Ashfort, 2002 and Romero & Cruthirds,
2006).
Past research has not only found evidence on the personal, the intra-level, but also on the social,
namely the inter-level. On the intra-level, evidence has been found in which humor helps to
obtain higher working conditions. (Wanzer, Booth-Butterfield & Booth-Butterfield, 2005).
Furthermore, positive correlations with creativity, well-being, self-esteem, positive affect, and
motivation have been found in the context of the workplace (Wood, Beckmann & Pavlakis,
2007; Kuiper, McKenzie & Belanger, 1995) whereas negative correlations have been found
with depression, worry and anxiety (e.g. Thorson, Powell Sarmany-Schuller & Hampes, 1997;
Nezu, Nezu & Blisset, 1988; Kelly, 2002 and Smith, Ascough, Ettinger & Nelson, 1971). When
it comes to the inter-level, evidence in research has shown that humor was able to lead to better
group member cooperation, less conflict and higher ratings of performance (Barsade, 2002).
Moreover, it has been revealed that humor is effective when wanting to reduce social distance
between group members (Graham, 1995) and it also represents a socially acceptable mean when
2
Even though many authors have underlined the positive aspects of humor, negative influences
cannot be ignored. This has been revealed by the fact that humor has been linked to low
leadership performance (Wood et al., 2007), depression (Kuiper, Grimshaw, Leite & Kirsh.,
2004) and emotional exhaustion, such as burnout (Tümkaya, 2007).
Especially when it comes to group work humor can play a crucial role. Younger employees in
today’s society expect their workplace to be enjoyable and fun. They have higher expectations
towards their employer and would even go as far as quitting their job if their demands cannot
be fulfilled (Levine, 2005). Also, job tasks and requirements have changed, compared to the
past. Nowadays, daily tasks are not as static and mechanic anymore. Consequently, skills such
as creativity, collaborative working and flexibility have become elementary (Lawler, 1998;
Strozniak, 2000).
Whereas many different forms of social aspects have been linked to group effectiveness, the
role of humor has been untapped in the past. Surprisingly, no research has examined the effects
that humor can have on group performance indicators, while accounting for the use of different
styles of humor. Thus, this study contributes to the research gap by answering the following
research question:
What is the effect of adaptive and maladaptive humor on group effectiveness?
The contributions of this study will be the following: First of all, the investigation of the effect
of humor on group effectiveness in actual working groups makes it the first of its kind. Not just
the positive, adaptive humor style, but also the negative, maladaptive humor style will be
investigated with a modified version of the Humor Styles Questionnaire (Martin, Puhlik-Doris,
Larsen, Gray & Weir, 2003). Second, the mediating role of psychological safety will be tested
in the context of adaptive and maladaptive humor. This combination of concepts has not been
following parts of this study and will be examined in the relationship between humor and group
effectiveness. Sundstrom, De Meuse and Futrell (1990) claim that focusing on one particular
group performance indicator could not just harm group member’s well-being and their group
viability, but also stakeholder’s satisfaction. Hence, this study also analyses the long-term
effects that humor can have by taking Hackman´s (1987) normative theory of group
effectiveness into account, which is constituted by groups’ productivity, development and
group viability.
2. Literature Review & Hypotheses
Clarification of the term Humor
In order to grasp the whole concept of humor, we first need to clarify the word itself. In the
Middle Age people believed that four types of humor existed and that a good balance of humor
would lead to humans being healthy or “in a good mood” (Lyttle, 2007). The word humor has
also been used as a synonym for fluid. Today, it is still being used in regards to body fluids
such as the vitreous humor, which is a gel-like substance that fills the space between the lens
and the retina of the human eyeball. In modern days “humoring someone” has been connoted
with anything that makes people feel good, hence humor is being associated with enjoyment
(Lyttle, 2007).
Humor can also be defined by the three main humor theories, namely the incongruity theory,
the superiority theory and the relief theory. Immanuel Kant’s incongruity theory (1951) tries to
clarify situations that make them funny in the eye of the beholder. The theory describes that
people tend to laugh about combinations of things that have been put together, by accident or
on purpose, even though they are usually unrelated (Suls, 1972; Meyer, 2000). Whereas Kant’s
incongruity theory tries to explain “what” it is about certain things that make them funny,
Thomas Hobbes superiority theory tries to explain “when” it is that we find things funny
4
Maeson, 1976) and that laughing is a reaction to a feeling of superiority towards people, things
or situations (Ziv, 1984; Lyttle, 2007). Sigmund Freud’s relief theory claims that we laugh at
topics that are linked to suppressed emotions and feelings such as sex and aggression. The
laughter is a reaction that discharges tension (Shurcliff, 1968) and bottled up feelings (Freud,
1928; Lyttle, 2007). Romero & Pescolido (2008) assert that there is not one best theory of
humor. Instead, the best description is dependent upon the situation. That is why the three
theories of humor can be seen as a “contingency theory of humor”, due to the ability to describe
how humor works in different situations (Romero & Pescolido, 2008).
It is noticeable that despite the variety of different theories, there is still not one clear definition
of humor. The term is multifaceted and can be conceptualized in numerous ways, such as an
emotional response, a situational stimulus or a mental process (Martin, 2001). Likewise, it
involves behavioral, cognitive, psychological, social and emotional aspects (Martin, 2001).
However, several researchers came to the conclusion that humor is able to create a mental
detachment from an event. This allows individuals to approach the event from a non-serious
perspective. As a consequence, positive or negative tensions can be released (Martin, 2001;
Morreall, 1997; Thomas, 2000). The use of humor serves individuals to distance themselves
from situational elements and reorder them in a way that triggers positive emotions, such as
gladness and merriment (e.g. expressed by laughter), which has been labeled as mirth (Romero
& Cruthird, 2006; Redlich, Levine & Sohler, Thomas 2000). Nonetheless, some individuals
might not feel as delighted by the use of humor. This is due to misinterpretation, failed humor,
put-downs or incomprehension. These incidents are caused by the fact that what is funny to one
person in a particular situation might not necessarily be funny to another person. Thus, humor
has been designated by many scientists as a “double-edged sword” (Romero & Pescolido, 2008;
In order to account for the differences in humor, scholars have started to differentiate between
positive humor, also known as adaptive humor, and negative humor, known as maladaptive
humor (Yip & Martin, 2006; Kuiper & McHale, 2009; Guenter, Schreurs, Emmerik, Gisjbers
& van Iterson, 2013). The differences between the two terms will be discussed in the next
section.
Adaptive Humor Style vs. Maladaptive Humor Style
The opposing concepts of adaptive and maladaptive humor have also been termed as positive
and negative forms of humor. These can be divided into four different humor styles: the
self-enhancing, the affiliative, the self-defeating and the aggressive humor style. On the one hand,
the adaptive humor is comprised by the self-enhancing and the affiliative humor style, while on
the other hand, the maladaptive humor is comprised by the self-defeating and the aggressive
humor style (see Figure 1).
Self-enhancing humor is defined as a way to maintain a positive perspective on life when
handling issues and problems and serves as a mean to be amused by the absurdities of life
6
(Veselka, Schermer, Martin, & Vernon, 2010). Affiliative humor can be used to reduce tension
between targets and amuses the recipients of that type of humor which eases interpersonal
relationships (van den Broeck, Vander Elst, Dikkers, De Lange, De Witte, 2012). The first of
the two maladaptive humor style, namely self-defeating humor, is a negative form of putdown
humor directed towards oneself in order to amuse or comfort others (van den Broeck et al.,
2012). Last but not least, aggressive humor is an offensive form of humor that is used to
criticize, offend and manipulate others, but also occurs when making use of humor in
inappropriate situations (Martin et al., 2003; Wood et al., 2007 and Veselka et al., 2010).
Group Effectiveness
As previously described, this paper tries to assess the effect of humor on group effectiveness
and hence, the latter concept needs to be clarified. Based on the multidimensional nature of
group effectiveness, researchers have come up with a variety of definitions (Cohen & Bailey,
1997; Hackman, 1987; van der Haar, Sergers & Jehn, 2013; Tannenbaum, Beard & Salas,
1992). In their article “What makes teams work”, the authors Cohen and Bailey (1997) refer to
three dimensions of group effectiveness: performance effectiveness, member attitudes and
behavioral outcomes. Another scientist that addresses this topic is Richard Hackman (1987),
who acknowledged the difficulties of assessing organizational group effectiveness in his so
called normative model of group effectiveness.
In his view, work groups in organizations are characterized by three factors. Firstly, work
groups can be seen as real groups. By this he means that groups are an intact social system
where group membership is stable over a period of time and that clear team boundaries are
present that clarify who is inside or outside of the group. Secondly, groups have at least one
task to perform and thirdly, groups operate within an organizational context. This can include
groups in all kinds of fields such as in the work environment, sports or the academic
In a general manner it is rather easy to tell how well a group has performed due to straight
forward measures such as the finishing time or the group’s accuracy. However, when put in an
organizational context, the assessment of the group’s performance becomes more complex. The
reason for this is that tasks are harder to quantify and as a consequence also more difficult to
judge. In addition, there is a great chance that people in work groups will continue to relate to
one another in the future which can have an impact on their current behavior (Hackman, 1987).
Resulting from these complexities, Hackman came up with three determinant of group
effectiveness that try to solve the previously explained issues within organizations. He defines
the concept of group effectiveness by the interplay of (I) productivity, (II) individual
development and (III) group viability. His assessment of group effectiveness will be used
throughout this paper. In the next section each of the three aspects will be discussed in more
detail.
The first criterion, (I) productivity, describes the degree to which the groups product or service
meets the needs of stakeholders or clients. Important in this connection is that the particular
group meets or even exceeds certain performance standards that are set by these stakeholders
or clients. There has been evidence that humor is positively related to the performance on an
individual and on a unit level (Avolio, Howell, Sosik, 1999). Furthermore, the use of humor
leads to more psychological and physical energy and thus, employees to put more effort into
their work when dealing with challenging work duties (Dienstbier, 1995). Moreover, past
research has shown that humor has a positive influence on several group productivity factors
such as stress reduction (Morreall, 1991), cohesion, communication (Duncan, 1982) and
creativity (O´Quin & Derks, 1997). However, as mentioned before, one needs to account for
the different effects of adaptive and maladaptive humor. It can be derived that, due to its positive
nature, adaptive humor will rather increase group productivity by evoking positive emotions
8
humor productivity, since it puts down others which will have a negative effect on individuals
productivity. Hence, the first hypotheses in this study are:
H1a: The use of adaptive humor is positively related to group productivity.
H1b: The use of maladaptive humor is negatively related to group productivity.
The second criterion is (II) development, in which the term can be understood as the way
individuals are able to learn from their own experiences and the group environment (Romero
& Pescolido, 2008). Ideally, the learning takes place during social processes that maintain or
enhance the group’s ability to work together on subsequent tasks (Hackman, 1987). Past
research has shown that humor has an influence on learning. For instance, Dixon, Wingham,
Strano and Chandler (1989) have provided evidence that individuals with high self-reported
sense of humor were able to pay more attention and better recall humorous materials. Another
research by Gorham and Christophel (2009) confirms these findings, claiming that the amount
and type of humor influence learning. The authors have found evidence that humor correlates
with overall immediacy and perceived cognitive and affective learning outcomes. Based on
these findings, the following hypotheses can be formulated:
H2a: The use of adaptive humor is positively related to the development of groups.
H2b: The use of maladaptive humor is negatively related to the development of groups.
Hackman defines the last of the three group effectiveness aspects, namely (III) group viability,
as the social processes that maintain or enhance the group’s ability to work together over time
(Hackman, 1987). Bell & Marentettes (2011) go one step further and extend the definition of
group viability by claiming it to be a requirement for teams to be sustainable and grow in future
performances. One can expect that humor can play a major role when it comes to group
a positive affect within a group which then leads to higher group viability. However, the use of
maladaptive humor can also result in the contrary. By this kind of humor, negative emotions
can be evoked in the recipients inside of these groups. Hence, I hypothesize:
H3a: The use of adaptive humor is positively related to group viability.
H3b: The use of maladaptive humor is negatively related to group viability.
Psychological Safety
The construct of psychological safety has been described by Edmondson (1999) as “a shared
belief held by members of a team that the team is safe for interpersonal risk taking”. The author
claims that psychologically safe teams make their members feel respected and accepted. The
term has oftentimes been confounded with trust, even though there are differences between
these two concepts. Psychological safety addresses a belief about a group norm and is
determined by how group members assume they are viewed by others. Trust lays the focus on
how a person views another person (Edmondson, 2003). However, (interpersonal) trust is a
major part of psychological safety in the sense that team members are comfortable enough to
be themselves and be treated with mutual respect (Edmondson, 1999). There are many scenarios
in team settings in which members are afraid of repercussions when it comes to sharing ideas.
As a consequence, a variety of performance improving efforts is kept private. Psychological
safety can help team members to open up and share their knowledge and ideas, wherefore
empirical support is also present: It has been shown that psychological safety in teams has an
enhancing effect on the likelihood of process innovation to be successful (Baer & Frese, 2002).
Also improved team innovation (West & Andersen, 1996), increased employee involvement
and engagement (Kark,, Ronit, Cameli & Abraham, 2009; Nembhard & Edmondson, 2006) has
10
It can be assumed that the concept of psychological safety also plays a major role in the notion
of humor. People need to feel safe and secure within their environment to express themselves
and especially their humor style. Since humor is a very sensitive topic, people scrutinize even
more whether to make use of it or not. This is caused by humor being a very subjective matter
that can be perceived as funny by one person, but offending by another. Following this
argumentation, it can be assumed that humor has a direct effect on psychological safety. This
is in line with the viewpoint of Romero & Pescosolido (2008), who believe that "any link
between humor and psychological safety (and thus learning) resides in the ability of humor to
create a safe group climate for taking risks and constructive conflict". It can be derived that the
use of adaptive and maladaptive humor styles have contrary effects where the use of adaptive
humor styles will lead to more psychological safety and the use of maladaptive humor to less
psychological safety. Concluding from this discussion, the next two hypotheses of this study
will read as follows:
H4a: The use of adaptive humor is positively related to psychological safety.
H4b: The use of maladaptive humor is negatively related to psychological safety.
As previously discussed, psychological safety can lead to a feeling of confidence and security
which can ultimately lead to higher group effectiveness. There has been evidence in previous
research indicating a link between psychological safety and the three determinants of group
effectiveness productivity, development and group viability. A study by Brow and Leigh (1996)
has tested the effects of psychological safety on productivity. Results indicated that when
employees perceived their organizational environment as psychologically safe, this would lead
to more job involvement and effort and hence, productivity would increase. There is also
considerable research indicating that psychological safety is linked to the organizations
development. The concept of psychological safety has been found to be a key factor in learning
comes to team based initiatives to foster knowledge sharing and organizational learning,
psychological safety has been a major influential factor (Edmondson, 1999; Zellmer-Bruhn &
Gibson, 2006 and Tucker, 2007). Reasons for these effects are that psychologically safe
environments reduce defensiveness and the fact that employees feel secure enough to
experiment with new and risky behaviors when trying to become more efficient and effective
(Tjosvold et al., 2004). Lastly, there are also links between psychological safety and group
viability. A study by Baer and Frese (2003) has tested the longitudinal effects of psychological
safety when implementing process innovations, which is defined as a “deliberate and new
organizational attempt to change production and service processes”. The outcome of their study
was that psychological safety was positively related to two performance indicators, namely
change in return on assets (holding prior return on assets constant) and firm goal achievement.
Since the nature of the study was longitudinal and future oriented, one can observe that the
groups within the organization led to the successful performances and were hence, viable.
Psychological safety does not only have an influence on the three aspects of group
effectiveness, but can also be linked to adaptive and maladaptive humor styles. Past research
has indicated more positive relationships between adaptive humor and psychological safety
(Wood et al., 2007; Kuiper & McHale, 2009, Cooper, 2005 and Blau et al., 2010) and more
negative relationships between maladaptive humor and psychological safety (Wood et al., 2007;
Tümkaya, 2007 and Kuiper & McHale, 2009). The rationale is that the use of adaptive humor
will make the members feel more secure and safe within the group. The created positive
atmosphere and joy helps in the creation of a psychologically safe environment. On the
contrary, maladaptive humor leads to stress and negative emotions. Members of the group may
feel intimidated and accordingly less psychologically safe. Based on the previous discussion, I
expect that psychological safety will have a mediating role in the relationship between humor
12
H5a: Psychological safety mediates the relationship between humor and group
productivity to the extent that adaptive humor within a group increases a perception of
psychological safety which consequently leads to higher group productivity.
H5b: Psychological safety mediates the relationship between humor and group
productivity to the extent that maladaptive humor within groups does not produce a
perception of psychological safety and consequently lower learnings/development
within the group.
H6a: Psychological safety mediates the relationship between humor and group
development to the extent that adaptive humor within a group increases a perception of
psychological safety which consequently leads to higher group development.
H6b: Psychological safety mediates the relationship between humor and group
development to the extent that maladaptive humor within groups does not produce a
perception of psychological safety and consequently lower group development.
H7a: Psychological safety mediates the relationship between humor and group viability
to the extent that adaptive humor within a group increases a perception of psychological
safety which consequently leads to higher group viability.
H7b: Psychological safety mediates the relationship between humor and group viability
to the extent that maladaptive humor within groups does not produce a perception of
psychological safety and consequently lower group viability.
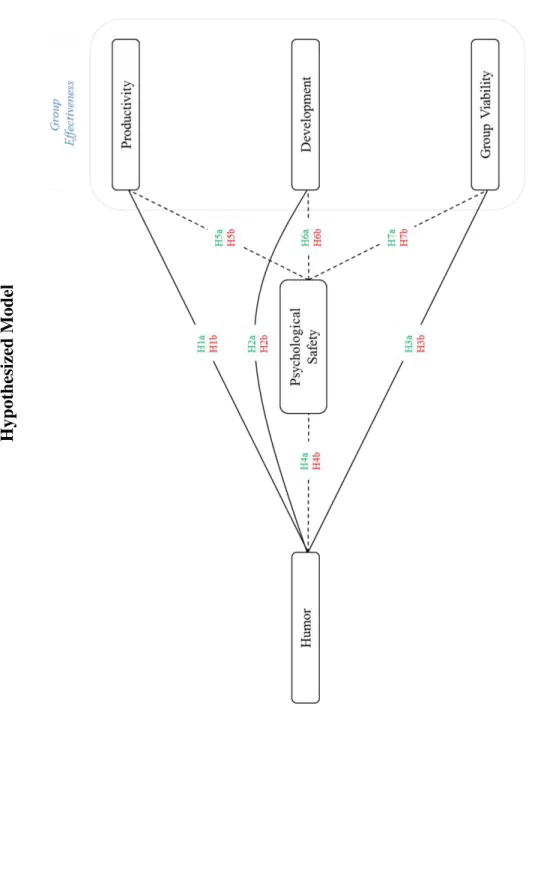
F
igu
re
2
Hyp
othesiz
ed
M
od
14
3. Methodology
Context
The current study employed a survey that has been handed out to students from Maastricht
University in the Netherlands, more specifically in the course Management of Organization and
Marketing. The university has a reputation for active, student-centered teaching and learning
methods by applying the so called “Problem-Based Learning” approach. This method has been
used in order to cope with the complexities in societies and facilitates the integration and
application of acquired knowledge (Dolmans et al., 2002). Barrows (1996) has been one of the
founders of the Problem-Based Learning method. He describes, among other characteristics,
that in this system learning occurs in small groups with the guidance of a tutor. Related
problems are discussed and serve as a stimulus for learning. Hence, the tutorial groups appear
to be a suitable experimental ground to test the effects of humor in groups. More importantly,
the tutorial groups fulfill Hackman’s (1987) working group criteria’s that have previously been
described (see p.6). Therefore, there is an increase in this study’s external validity, which is the
degree to which the results of this study can be generalized to other contexts (e.g. other group
settings).
Procedure
Data was collected with the help of a survey that has been carried out during the very last
tutorial session of the course Management of Organization and Marketing. There have been 13
tutorial sessions in total over the course of 8 weeks. Tutors that have been contacted in advance
and asked whether they would be willing to hand out the survey to their students. Once
accepted, the tutorshanded out the survey and asked the students to fill them out thoroughly.
Remuneration, in order to provide an incentive, was not offered. However, the participants were
of aggregated data that helps to generate patterns. This has also been done to minimize the
effects of the social desirability bias, which is a scenario in which participants answer in a way
that makes them appear more favorable to the experimenter (Blumberg, Cooper & Schindler,
2014).
Sampling
The main item that is of interest for this study is “groups”. Obviously, it is virtually impossible
to obtain a census of all existing groups. Hence, a judgment sampling (non-probability) has
been used to compile the data. The judgmental sampling develops through the researcher’s
selection of the sample by members that conform to some pre-defined criterion (Blumberg et
al., 2014). Generally, the non-probability sampling can be considered as a biased technique,
which prohibits the generalization of result to the whole population (Blumberg et al., 2014 and
Tongco, 2007). From a statistical perspective, the method of probability sampling can be seen
as superior, but not as the most feasible and efficient method (Tongco, 2007 and Schreuder,
Gregoire & Weyer, 2001). Therefore, an increasing number of uses of the non-probability
sampling method, especially in business research, can be observed due to the easy use and cost
efficiencies (Blumberg et al., 2014). Especially when there are no common scales present and
the main interest is not the accurate size of the effect, but rather whether there is a positive or
negative effect at all, a purposive sample is not ultimately necessary. Instead, it is adequate
when the responses show enough variation, meaning that a non-probability sampling would be
sufficient (Blumberg et al., 2014). Taking into account that a census is not feasible for the study
at hand, and that the study applies concepts in which no common scale exists (e.g. there is no
commonly accepted number or level to quantify humor or group effectiveness) it makes sense
to use a non-probability sample. Even more so, when considering that the hypotheses in this
study try to investigate whether there are positive or negative relationships at hand, and not how
16
4. Measures
Demographics
In order to get more value from the survey data, participants were asked to inform about their
age (in full years), their gender (1=male and 2= female) and their nationality (1=Dutch,
2=German, 3=Belgian, 4= French and 5=Other).
Humor
The Humor Styles Questionnaire by Martin et al. (2003) served as the basis for assessing
adaptive, as well as maladaptive humor. Since the questions used by Martin et al. were directed
towards one single individual, they were transformed in order to assess the humor style applied
on the tutorial level. In total 16 questions were adapted with four different subscales, namely:
the affiliative humor, self-enhancing humor, aggressive humor and self-defeating humor.
Afterwards, affiliative humor and self-enhancing humor have been combined and labeled as
“adaptive humor style” (AHS), and aggressive and self-defeating humor have been combined
and labeled as “maladaptive humor style” (MHS). This was done by adding all the scores of
the two humor styles and calculating the respective average of the sum.
Adaptive Humor Style. In total 8 questions from the Humor Styles Questionnaire (Martin et al.,
2003) were used to gather insights about this construct, 4 questions directed at the affiliative
humor style and 4 directed at the self-enhancing humor style. A 7-point Likert scale ranging
from 1 = “strongly disagree” to 7=”strongly agree” was used. Examples for questions on
affiliative humor are “In the tutorial we enjoy to make people laugh” and “In our tutorial we
don't have to work very hard at making other people laugh - we seem to be a naturally humorous
tutorial group”. Examples for questions on self-enhancing humor are “The tutorials humorous
outlook on life keeps everyone from getting overly upset or depressed about things” and “In
depressing moments the tutorial group cheered up with humor”. Cronbach’s alpha coefficient
Maladaptive Humor Style. Similarly, for the maladaptive humor style 8 questions were used
from the Humor Styles Questionnaire (Martin et al., 2003). Again, 4 questions were directed at
the aggressive humor style and 4 directed at the self-defeating humor style. The 7-point Likert
scale was ranging from 1 = “strongly disagree” to 7=”strongly agree”. Examples for questions
on aggressive humor are “When telling jokes or saying funny things, members of the tutorial
group are usually not very concerned about how others are taking it” and “If someone makes a
mistake, the tutorial group will often tease him about it”. Examples for the self-defeating humor
style are “Members of the tutorial group try to make people like or accept them more by saying
something funny about their own weaknesses, blunders, or faults” or “Members of the tutorial
group laugh at- or make fun at others expense more than they should”. The Cronbach’s alpha
revealed to be 0,95.
Psychological Safety
Psychological safety was assessed by using the unidimensional psychological safety 7-item
scale by Edmondson (1999) in which responses ranged from 1=“strongly disagree” to
7=”strongly agree”. Items included statements such as “It is completely safe to take a risk on
this tutorial”, “Members of this tutorial value and respect each other’s contributions” and “It is
easy to ask other members of this tutorial for help” with a Cronbach’s alpha coefficient of 0,89.
Group Effectiveness
Productivity. This variable was measured by 2 items by Ancona & Caldwell (1992) adapted
from the “questionnaire on external activity and performance in organizational teams”. The two
questions were slightly changed in order to fit the environment of the tutorial and are “My
tutorial group is productive” and “My tutorial group was able to respond quickly to problems”.
18
Development. The development was measured with the Team Learning Questionnaire (Bresó,
Gracia, Latorre and Peiró, 2008) with 4 items on a 7-point Likert scale ranging from
1=“strongly disagree” to 7=”strongly agree”. Items include statements such as “Mistakes are
openly discussed in order to learn from them” and “We learn from each other”. According to
the authors the construct has very good internal consistency with a Cronbach’s alpha coefficient
of 0.91. The current study reveals a Cronbach’s alpha of 0,93.
Group Viability. Items used to measure group viability have been adapted from the
“questionnaire on team viability” by Aubé, and Rousseau (2005) on a 7-point Likert scale
ranging from 1=“strongly disagree” to 7=”strongly agree”. Example items are “The members
of this team could work a long time together” and “Being a member of this team has been
personally satisfying”. Cronbach’s alpha was 0,96.
Many of the original scales that have been adapted were developed and designed with a 5-point
response format, however the current study has been consistently been using a 7-point Likert
response scale. This is based on Blumberg et al. (2014) who claim that unidimensional scales,
similar to the ones that have been used in this study, need a greater number of scale points for
the sake of more accurate results. The fact that all the measured Cronbach Alpha scores are
relatively high and transcend the threshold of 0.8 portends good internal consistency reliability
(George & Mallery, 2003).
Control Variables
Control variables have been used and held constant to test the relative relationship between the
dependent variables (productivity, development and group viability), the mediator
(psychological safety) and the independent variable (humor) in order to increase this study’s
internal validity. The first variable that is controlled for is nationality. It has been reported that
ethnicity (Romero & Cruthirds, 2006 and Alden & Hoyer, 1993). The second control variable
in the sample is gender, as there may be different influential effects for man and women
(Romero & Cruthirds, 2006). Lastly, this study controlled for the respondents age to assess
different effects on different age groups as it has been reported by Decker (1987).
5. Analysis
Pilot Study
After the gathering and selection of questions, the final survey has been carried out to a small
convenience sample of 15 respondents who have been randomly approached at the entrance of
Maastricht University. The location has been selected in order to have a sample of participants
of the relevant population and considering that the Problem-Based Learning approach is the
main teaching method at the whole university, this has been fulfilled. However, there is the
possibility that participants of pilot tests may be influenced in the final study in case they have
already taken part in the research (Blumberg et al., 2014). Hence, the participants of the pilot
study were asked whether they were taking part in the course Management of Organizations
and Marketing and were consequently excluded from the pilot test if they were enrolled in the
course. The ultimate goal of the small-scale preliminary study was to ensure to have an
adequately designed study by observing whether the questionnaire was comprehensible,
applicable and functional. After the feedback, several changes have been made in terms of use
of too similar questions and wording of one particular question. After the adjustments, the
questionnaire has been carried out to the large scale.
Final Sample
In total 322 participants provided data by filling out the survey. As the main goal of the study
is to assess the effect of adaptive and maladaptive humor on group effectiveness, in the first
20 is important, because there is the chance that respondents rate the group’s adaptive humor style
items as well as the maladaptive humor style items simultaneously as high or low. Not
accounting for this effect could lead to misinterpretation of the results. Thus, two humor style
classification criteria’s were defined. The first is that respondent’s humor style score on one
item (e.g adaptive humor style) had to differ from the other humor style (e.g. maladaptive humor
style) by equal or more than 15 scale points. The second is that, simultaneously to the first
criterion, the sum of one humor style needed to have an overall higher score than the other one.
If the responses did not match up with the aforementioned criteria, they were considered as
invalid and excluded from the analyses. The scale point difference has been chosen as a
threshold, because a difference in 14 scale points is equal to 25 percent which was judged as
high enough to separate the two styles of humor. In another form this can be expressed as the
following:
ΣAHS –ΣMHS ≥ 15 & AHS ≥ MHS => AHS
ΣMHS –ΣAHS ≥ 15 & MHS ≥ AHS => MHS
As a result of the classification, the final sample size was found to be 191 respondents. 98 of
the total final sample were ascribed to the adaptive humor and 93 respondents were ascribed to
the maladaptive humor style. As discussed, the sample mainly consists of students; hence the
average age of the participants was 19,77 years. Moreover, there have been more male (55%)
than female (45%) participants and Germans (47,1%) and Dutch (26,7%) made up the big
majority of represented nationalities, followed by Belgians (10,5%), French (2,1%) and Others
(13,6%).
Data Screening and Test of Assumptions
Before the actual hypotheses testing, the data was assessed in order to make sure that the
the sample size was large enough to find appropriate relationships between the variables. In the
past there has been a lot of debate on the “right “sampling size with a variety of
recommendations. Harris (1985) proposes that the number of participants should exceed the
number of independent variables by a minimum of 50. Van Voorhis and Morgan (2007) define
the absolute minimum of 10 participants when using 6 or more independent variables, even
though it is better to have 30 participants per variable. A complete different approach was
introduced by Morse (2000) who criticizes that literature offers rigid rules rather than guidelines
for the accurate sample size. Accordingly, he recommends that scientists base their sample size
on the quality of the data, the study design, the possible use of shadowed data and the topic
itself. Either way, the sample size of this study complies with the proposed sample sizes.
Next, a correlation analysis has been conducted to quantify the association between the
variables. The Pearson correlation coefficients can be found in Table 1 for adaptive humor style
and Table 2 for maladaptive humor style.
Consistent with the proposed model, the correlations of adaptive humor with psychological
safety (mediating variable) and productivity, development and group viability (dependent
variables) show high positive numbers. Maladaptive humor also shows high correlations
between the variables and is negatively correlated with psychological safety, which is likewise
22 Table 1
Correlations among Study Variables for Adaptive Humor Style
1 2 3 4 5
1. Adaptive Humor Style 1
2. Psychological Safety ,255* 1
3. Productivity ,240* ,580** 1
4. Development ,353** ,759** ,707** 1
5. Group Viability ,277** ,830** ,712** ,868** 1
N =98, *p < ,05, **p < ,01, ***p < ,001
Table 2
Correlations among Study Variables for Maladaptive Humor Style
1 2 3 4 5
1. Maladaptive Humor Style 1
2. Psychological Safety -,273** 1
3. Productivity -,278** ,719** 1
4. Development -,332** ,717** ,707** 1
5. Group Viability -,327** ,735** ,787** ,793** 1
N =93, *p < ,05, **p < ,01, ***p < ,001
The correlations between the different dependent variables are relatively high, which could be
a sign for multicollinearity, meaning that one variable can be linearly predicted from another
variable with a substantial degree of accuracy. In order to exclude multicollinearity the variance
that measures how much the variance of an estimated regression coefficient can be accredited
to collinearity and the results can be found in Table 3.
Table 3
Variance Inflection Factors (VIF)
AHS MHS
Psychological Safety 3,298 2,651
Productivity 2,181 3,013
Development 6,093 3,909
Group Viability 4,437 3,057
Many researchers have stated that a variance inflection point larger than 10 gives concern for
serious multicollinearity (Marquardt, 1970; Kennedy, 1992 and Neter, Wasserman & Kutner,
1989). The tested factors fall under the threshold and hence, multicollinearity can be excluded.
In the next step, the basic underlying assumptions of a regression analysis, namely reliability,
linearity, normality and homoscedasticity, were tested for. Reliability means that the data has
been measured without error and can be checked by the Cronbach alpha, the factor loadings
and the composite reliability. In the past Cronbach alpha coefficient scores have been widely
used as an estimator of the reliability of tests and scores. The coefficient alpha scores of this
study have already been discussed and have shown sufficient numbers above the threshold of
0,70 (Nunnally, 1978). Even though the Cronbach alpha score is widely accepted and applied,
there are still critics in its use and interpretation (Cortina, 1993 and Sijtsma, 2009). The main
critique is that Cronbach alpha underestimates the true reliability since it is just a lower bound
on true reliability which is why researchers started to make use of the composite reliability as
24
composite reliability has been calculated and reveals that the scores are likewise higher than
the proposed threshold of 0,70 (Hair, 2008). A summary of all the measured Cronbach alphas
and the composite reliability can be found in Table 4.
Table 4 Reliability tests
Cronbach Alpha Composite Reliability
Adaptive Humor Style 0,96 0,97
Maladaptive Humor Style 0,95 0,96
Psychological Safety 0,89 0,91
Productivity 0,93 0,95
Development 0,93 0,92
Group Viability 0,96 0,97
Last, the factor loadings also indicate unidimensionality of the scales. As a rule of thumb, factor
loadings of 0,32 are seen as a minimum loading to be acceptable (Tabachnick & Fidell, 2001),
whereas loadings of more than 0,50 are seen as desirable and indicate a solid factor (Osborne
& Costello, 2009). All the loadings for this study’s factor have exceeded the proposed
thresholds by far and can therefore be considered as strongly loaded. A summary of all the
Table 5 Factor Loadings
AHS MHS PS P D GV
AHS_Q1 0,75
AHS_Q2 0,94
AHS_Q3 0,92
AHS_Q4 0,91
AHS_Q5 0,74
AHS_Q6 0,94
AHS_Q7 0,92
AHS_Q8 0,93
MHS_Q1 0,82
MHS_Q2 0,86
MHS_Q3 0,92
MHS_Q4 0,93
MHS_Q5 0,90
MHS_Q6 0,81
MHS_Q7 0,86
MHS_Q8 0,78
PS_Q1 0,72
PS_Q2 0,72
PS_Q3 0,88
PS_Q4 0,89
PS_Q5 0,86
PS_Q6 0,61
P_Q1 0,95
P_Q2 0,95
D_Q1 0,87
D_Q2 0,84
D_Q3 0,85
D_Q4 0,89
GV_Q1 0,94
GV_Q2 0,94
GV_Q3 0,93
GV_Q4 0,90
GV_Q5 0,95
26
Linearity was assessed by first checking a matrix scatterplot to see whether the data follow a
linear pattern. Afterwards, as a mean to double check, the residual plots were observed in which
a random distribution of positive and negative residual values indicate linearity (Hair, 2008).
Both measures of the assumption indicated that the variables follow a linear pattern, hence, the
assumption is met.
In regression analysis it is assumed that modelling errors are uncorrelated, meaning that their
variances do not vary with the modelled effects. If this assumption does not hold, it is caused
by heteroscedasticity which occurs when the variance of errors depend on the value of one or
more independent variables (Hair, 2008). Heteroscedasticity is not an issue for this study,
because the before mentioned residual plots were scattered, hence indicating homoscedasticity.
Additionally, the variables were assessed by the Levene’s test for equal variances. In line with
the previous finding, the significant F values indicated that no heteroscedasticity was present.
Lastly, the assumption of normality does not apply for this study, because only continuous data
can be normally distributed. Likert scales, as they have been used in this study, are skewed in
many cases. Moreover, with the Likert scale we are in the area of the so called non-parametric
statistics with ordinal scale data. All kinds of non-parametric statistic are known to be
distribution free. Therefore, the assumption about normality for this study is meaningless (Allen
& Seaman, 2007).
Hypotheses Testing
This study employed hierarchal multiple regression to test the effects of humor on group
effectiveness with the control variables nationality, gender and age. The software that was used
for the regression analysis was SPSS Statistics 21.0. The hypotheses were tested in two separate
parts: the direct relationships (Hypotheses 1-4) and the mediated relationships (Hypotheses
5-8). When assessed for the direct relationship, the data was split and analyzed for the adaptive
Baron and Kenny’s (1996) procedure for mediational hypotheses. The goal was to investigate
the (mediating) role of psychological safety within the relationship of humor and Hackman’s
three indicators of group effectiveness (see dashed lines in Figure 2).
Results of Direct Relationships
Hypothesis 1a stated that the use of adaptive humor style would be positively related to
productivity in groups. As can be seen from Table 6 the control variables were regressed for
first, before adding the independent variable to the regression. Results indicate that the control
variables nationality, gender and age predict 8 percent of the variance in productivity (Table 6,
Model 1). When adding adaptive humor style (Table 6, Model 2) the prediction of the variance
increases by 4 percent to a total of 12 percent. Both, Model 1 and Model 2 were significant,
thus Hypothesis 1a was supported. Hypothesis 1b predicted a negative relationship between
maladaptive humor styles and productivity. Left alone, the control variables were not able to
significantly predict productivity, which can be seen by the low F-value of 1,75 (Table 5, Model
1). However, maladaptive humor style significantly revealed to have a negative relationship
towards productivity, while the prediction of variance increased by 9 percent to an overall of
12 percent (Table 7, Model 2). Hypothesis 1b was therefore supported.
Hypothesis 2a stated that adaptive humor would be positively related to the development of
groups. Considering the control variables alone did not show a significant relationship (R²adj=
0,03, F=1,83). The addition of adaptive humor style as an independent variable however,
explained an additional 12 percent, increasing the total prediction of the variance to 15 percent.
Also, the relationship appeared to be significant (β=.37, p<0,001), thus Hypothesis 2a was
significant (Table 6, Model 3 and 4). Hypothesis 2b predicted that maladaptive humor and
development in groups would be negatively related. The control variables were not significant
(Table 6, Model 3). However, this changed after maladaptive humor style was added as the
28
negative relationship while predicting 13 percent of the variances in group’s development
(Table 7, Model 4). Therefore, hypothesis 2b was supported.
In hypothesis 3a it was presumed that adaptive humor and group viability would be positively
related. As can be seen in Model 6 of Table 6 the relationship showed to be significant and
positive (β= .28, p<0,01), but only after adding adaptive humor in the regression analysis. The
control variables alone were not able to predict group viability (Table 6, Model 5). The overall
model significantly predicted 7 percent of the variance in group viability (R²adj= 0,07, F=3,52).
Hence, Hypothesis 3a was supported. Hypothesis 3b predicted a negative relationship between
maladaptive humor and group viability. The control variables alone were again not able to
significantly predict group viability (Table 7, Model 5). From Model 6 however it can be
observed that, after adding maladaptive humor, the results indicated a highly significant
negative relationship between maladaptive humor and group viability (β= -.34, p<0,001). The
model, including the control and the independent variable, significantly predicted 13 percent of
the variance in group viability (R²adj= 0,13, F=3,29). Hypothesis 3b is thus supported.
In order to test hypothesis 4a and 4b which anticipated a positive relationship between adaptive
humor and psychological safety and a negative relationship between maladaptive humor and
psychological safety, a hierarchical multiple regression analysis was run again. From Model 7
in Table 6 we can see that the control variables already significantly account for 9 percent of
the variance in psychological safety (R²adj= 0,09, F=4,23). As can be seen in Model 8 in Table
6, adding adaptive humor increased the variance by 5 percent to a total of 14 percent (R²adj=
0,14, F=4,97). Therefore, Hypothesis 4a was supported. Maladaptive humor in Hypothesis 4b
per contra showed opposing results. The regression of only the control variables did not indicate
to be significant. Also, adding maladaptive humor still indicated no significant relationship with
psychological safety as can be seen by the low F-value of 2,09 (Table 7, Model 8), even though
be significant at a 10 percent level (p=0,089), so just not enough to fall under the threshold of
a p-value lower than 0,05. In a last step maladaptive humor and psychological safety were
regressed for, unaccompanied from the control variables. The results revealed that the
prediction of the variance increased by further 18 percent and showed a significant negative
relationship between psychological safety and maladaptive humor (Table 7, Model 9), thus
supporting Hypothesis 4b.
In sum, we found evidence that, consistent with the predicted hypotheses, adaptive humor styles
have a positive effect on group effectiveness and maladaptive humor styles have a negative
relationship to group effectiveness. The control variables did not reveal to be very significant in
explaining the Model, except for nationality in the relationship of adaptive humor with
psychological safety and development (Table 6, Model 7) as well as maladaptive humor and
30 Table 6
Regression Results Direct Relationships: Adaptive Humor Style
Productivity Development
Group Viability
Psychological Safety
Model 1 Model 2 Model 3 Model 4 Model 5 Model 6 Model 7 Model 8
Control Variables
Nationality -0,28 -0,25 -0,21* -0,16 -0,19 -0,15 -0,33* -0,30
Gender 0,06 0,11 0,08 0,17 0,08 0,14 0,07 0,12
Age -0,20 -0,18 -0,06 -0,03 -0,14 -0,11 -0,06 -0,03
Independent Variable
Adaptive Humor Style 0,22* 0,37*** 0,28** 0,25*
F-Value 3,91* 4,34** 1,83 5,19*** 1,88 3,52** 4,23** 4,97***
R²adj 0,08 0,12 0,03 0,15 0,03 0,09 0,09 0,14
∆ R²adj 0,04 0,12 0,07 0,05
Standardized regression coefficient (β's) are shown, N =98, *p < ,05, **p < ,01, ***p < ,001
Table 7
Regression Results Direct Relationships: Maladaptive Humor Style
Productivity Development
Group Viability
Psychological Safety
Model 1 Model 2 Model 3 Model 4 Model 5 Model 6 Model 7 Model 8 Model 9
Control Variables
Nationality 0,21* 0,129 0,16 0,08 0,11 0,093 0,12
Gender 0,12 0,10 0,16 -0,01 0,08 0,06 0,04 0,02
Age 0,06 0,06 -0,04 -0,04 0,08 0,08 -0,04 -0,04
Independent Variable
Maladaptive Humor
Style -0,32** -0,36*** -0,34*** -0,28** -0,27**
F-Value 1,75 4,02** 0,53 3,71** 0,50 3,29* 0,34 2,09 7,301**
R²adj 0,02 0,12 0,02 0,15 0,02 0,13 0,12 0,46 0,64
∆ R² 0,09 0,13 0,12 0,34 0,18
Results of Mediated Relationships
To test the mediating effect of psychological safety on the relationship of humor and group
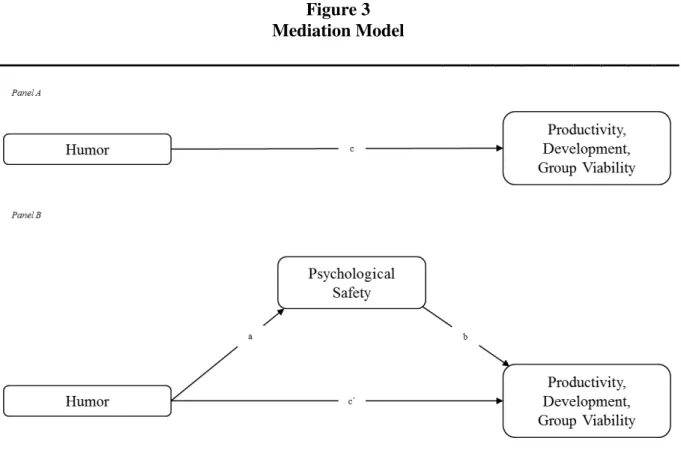
effectiveness, this study applied the stepwise method proposed by Baron and Kenny (1986).
Three underlying assumptions need investigation in order to conclude that psychological safety
has a mediating effect:
1. Humor significantly predicts productivity, development and group viability
(path c≠ 0, see Figure 3)
2. Humor significantly predicts psychological safety (path a≠ 0, see Figure 3)
3. Psychological safety significantly predicts productivity, development and group viability,
when simultaneously running a regression analysis with the control variables nationality,
gender and age and the independent variable humor (path b ≠ 0, see Figure 3)
Figure 3 Mediation Model
32 If the inclusion of the mediating variable has the effect that the relationship between the independent
and dependent variable becomes insignificant, the mediating form is known as full mediation (path
c`= o, see Figure 3) (Baron & Kenny, 1986; Rucker, Preacher, Tomala & Petty, 2011). When the
relationship between the independent and dependent variable decreases, however still remains
significant, one can observe partial mediation (Baron & Kenny, 1986).
The tests of Hypotheses 1-4 can be seen as the first step when investigating the mediating effect.
The previously discussed results revealed that all hypotheses had been supported and the first
assumption (path c≠ 0) has been met (Table 6 and Table 7). This study also found that the use
of adaptive humor was positively and the use of maladaptive humor was negatively related to
psychological safety, hence meeting the second assumption for a mediating role (path a ≠ 0).
In the third step, the dependent variables were regressed on both, the mediator psychological
safety and the independent variables adaptive humor (Table 8) and maladaptive humor (Table
9), respectively.
Results revealed that productivity was found to be significantly related to adaptive humor (β =
0,22, p<0,01). We then added psychological safety to test for a mediating effect. Since the
model became insignificant (β = 0,10, p>0,05) we can conclude that Hypothesis 5a can be
supported and we can observe a full mediation. The same holds for Hypotheses 5b in which
maladaptive humor and productivity showed to have a significant relationship (β = -0,32,
p<0,01), whereas the inclusion of the mediator psychological safety led to the model to become
insignificant (β = -0,13, p>0,05), therefore Hypothesis 5b can be supported with a full
mediation. Hypothesis 6a predicted a mediating role of psychological safety on the relationship
between adaptive humor and development. This hypothesis was partially supported,
considering that the addition of the mediator led to the decrease of the coefficient from 0,37
(p<0,001) to 0,19 (p<0,01), while still being significant. Similar results can be seen in
Hypothesis 6b. The direct relationship of maladaptive humor and development was initially
coefficient decreased but remained significant (β = -0,18, p<0,05). Hence, Hypothesis 6b is
partially supported. Full mediation can be found in Hypothesis 7a. Here the direct effect of
adaptive humor on group viability was significant (β = 0,28, p<0,01), but became insignificant
after the inclusion of psychological safety (β = 0,08, p>0,05), therefore, Hypothesis 7a was
supported. Lastly, the relationship of maladaptive humor and group viability was significant (β
= -0,34, p<0,01) and remained significant after the inclusion of psychological safety (β = -0,15,
p<0,001). Seeing that the coefficient decreased, we can conclude that Hypothesis 7b was
partially supported.
Table 8
Regression Results: Mediated Relationships AHS
Step 2 (Path a)) Step 3 (Path b and c) Step 4 (Sobel test)
Psychological
Safety Productivity Development Group
Viability Productivity Development Group Viability
Control Variables
Nationality -0,30 -0,094 0,06 0,11 -0,094 0,06 0,11
Gender 0,12 0,04 0,079 0,04 0,04 0,079 0,04
Age -0,03 -0,17 0,00 -0,09 -0,17 0,00 -0,09
Mediating Variable
Psychological Safety 0,518*** 0,722*** 0,842*** 0,518*** 0,722*** 0,842***
Independent Variable
Adaptive Humor
Style 0,25* 0,10 0,191** 0,08 0,10 0,191** 0,08
F-Value 4,97*** 11,203*** 28,978*** 46,203***
R²adj 0,14 0,35 0,59 0,70
Sobel test 2,4187* 2,5157* 2,5396*
34 Table 9
Regression Results: Mediated Relationships MHS
Step 2 (Path a) Step 3 (Path b and c) Step 4 (Sobel test)
Psychological
Safety Productivity Development
Group
Viability Productivity Development Group Viability
Control Variables
Nationality 0,152* 0,82 0,03 0,152* 0,82 0,03
Gender 0,08 -0,02 0,04 0,08 -0,02 0,04
Age 0,09 -0,01 0,11 0,09 -0,01 0,11
Mediating Variable
Psychological
Safety 0.688*** 0,669*** 0,699*** 0.688*** 0,669***
0,699** * Independent Variable Maladaptive Humor
Style -0,27** -0,13 -0,18* -0,15*** -0,13 -0,18*
-0,15***
F-Value 7,301** 24,311*** 21,235***
23,235**
*
R²adj 0,64 0,56 0,53 0,55
Sobel test 2,607** 2,60577**
2,6268* *
Standardized regression coefficient (β's) are shown, N =93, *p < ,05, **p < ,01, ***p < ,001
Table 10
Regression Results: Mediated Relationships AHS
βdirect βindirect Hypothesized effect Result
AHS
H1a: AHS → Productivity 0,22* + Supported
H2a: AHS → Development 0,37*** + Supported
H3a: AHS → Group Viability 0,28** + Supported
H4a: AHS → PS 0,25* + Supported
H5a: AHS → PS→ Productivity 0,10 0,52*** + Supported
H6a: AHS → PS → Development 0,19** 0,72*** + Partially supported
H7a: AHS → PS → Group Viability 0,08 0,84*** + Supported
MHS
H1b: MHS → Productivity -0,32** + Supported
H2b: MHS → Development -0,36*** + Supported
H3b: MHS → Group Viability -0,34*** + Supported
H4b: MHS → PS -0,27** + Supported
H5b: MHS → PS→ Productivity -0,13 0.69*** + Supported
H6b: MHS → PS → Development -0,18* 0,67*** + Partially supported
H7b: MHS → PS → Group Viability -0,15*** 0,70*** + Partially supported
βdirect= β coefficient for the direct relationship between independent variable and dependent variable βindirect= β coefficient for the relationship between mediating and dependent variable
The regression results of the hypotheses can be found in summarized form in Table 10. In
addition, the regression coefficient of the direct effects (Panel A) and mediated effects that
include indirect and the remaining directs effects (Panel B) are depicted in Figure 4. In Panel B
the solid line in the relationship between humor and the three group effectiveness indicators
indicate full mediation, whereas the change to the dotted lines indicates partial mediation.
Figure 4
Complete model with β coefficients before and after mediation
AHS
MHS
Panel A only depicts direct relationships before considering mediation Panel B depicts indirect and remaining direct effects after mediation Solid lines in Panel B depict full mediation
Panel A
Panel B