BGD
9, 14291–14325, 2012
Oxygen supply to tropical Atlantic OMZ
Fischer et al.
Title Page
Abstract Introduction
Conclusions References
Tables Figures
◭ ◮
◭ ◮
Back Close
Full Screen / Esc
Printer-friendly Version Interactive Discussion
Discussion
P
a
per
|
Dis
cussion
P
a
per
|
Discussion
P
a
per
|
Discussio
n
P
a
per
|
Biogeosciences Discuss., 9, 14291–14325, 2012 www.biogeosciences-discuss.net/9/14291/2012/ doi:10.5194/bgd-9-14291-2012
© Author(s) 2012. CC Attribution 3.0 License.
Biogeosciences Discussions
This discussion paper is/has been under review for the journal Biogeosciences (BG). Please refer to the corresponding final paper in BG if available.
Diapycnal oxygen supply to the tropical
North Atlantic oxygen minimum zone
T. Fischer, D. Banyte, P. Brandt, M. Dengler, G. Krahmann, T. Tanhua, and M. Visbeck
Helmholtz Centre for Ocean Research (GEOMAR), Kiel, Germany
Received: 1 October 2012 – Accepted: 2 October 2012 – Published: 17 October 2012
Correspondence to: T. Fischer ([email protected])
BGD
9, 14291–14325, 2012
Oxygen supply to tropical Atlantic OMZ
Fischer et al.
Title Page
Abstract Introduction
Conclusions References
Tables Figures
◭ ◮
◭ ◮
Back Close
Full Screen / Esc
Printer-friendly Version Interactive Discussion
Discussion
P
a
per
|
Dis
cussion
P
a
per
|
Discussion
P
a
per
|
Discussio
n
P
a
per
|
Abstract
The replenishment of consumed oxygen in the open ocean oxygen minimum zone (OMZ) off West Africa in the tropical North Atlantic Ocean is studied, with a focus on oxygen transport across density surfaces (diapycnal flux). The latter is obtained from a large observational set of oxygen profiles and diapycnal mixing data from years 2008
5
to 2010. Diapycnal mixing is inferred from different sources: a large scale tracer re-lease experiment, microstructure profiles, and shipboard acoustic current measure-ments plus density profiles. The average diapycnal diffusivity in the study area is 1×10⁻⁵m2s−1. No significant vertical gradient of average diapycnal diffusivities exists in the depth interval from 150 to 500 m. The diapycnal flux is found to contribute
sub-10
stantially to the oxygen supply of the OMZ. Within the OMZ core, 1.5 µmol kg−1a−1 of oxygen is supplied via diapycnal mixing, contributing about a third of the total demand. The oxygen that is contributed via diapycnal mixing originates from oxygen that has been laterally supplied within the overlying Central Water layer by advective and eddy fluxes. Due to the existence of a separate shallow oxygen minimum at about 100 m
15
depth throughout most of the study area, there is no direct net vertical oxygen flux from the surface layer of the study area into the Central Water layer. Thus all oxygen supply of the OMZ is associated with remote pathways.
1 Introduction
The open oceans host distinct permanent regions of low oxygen concentration (oxygen
20
minimum zones OMZs), many of them situated at eastern boundaries in the tropics outside the equatorial belt. Tropical OMZs have common features in their coinciding with weak mean circulation and in their typical core depth range of 200 to 700 m, but their spatial extent and overall oxygen levels are diverse, with relatively high values in the Atlantic compared to the Indian and Pacific Oceans (Karstensen et al., 2008;
25
BGD
9, 14291–14325, 2012
Oxygen supply to tropical Atlantic OMZ
Fischer et al.
Title Page
Abstract Introduction
Conclusions References
Tables Figures
◭ ◮
◭ ◮
Back Close
Full Screen / Esc
Printer-friendly Version Interactive Discussion
Discussion
P
a
per
|
Dis
cussion
P
a
per
|
Discussion
P
a
per
|
Discussio
n
P
a
per
|
activity (Lam and Kuypers, 2011; Wright et al., 2012), but pose a challenge or even lethal threat to certain marine animal species, with increasing numbers of threatened species the lower the oxygen level (Vaquer-Sunyer and Duarte, 2008; Ekau et al., 2010; Prince et al., 2010).
Being situated below the euphotic layer, the existence and position of oxygen
min-5
imum layers can be explained by a balance between oxygen loss by respiration of organic matter (consumption) and oxygen supply (excess of influx over outflux) that results from ventilation (Wyrtki, 1962). Density coordinates subdivide oxygen flux into isopycnal and diapycnal components, i.e. along and across surfaces of constant den-sity. In steady state there must be a balance betweenconsumption rateanddivergence
10
of isopycnal flux anddivergence of diapycnal flux. This balance is assumed to hold to first order despite some slow changes discussed below. The consumption rate may be seen as an external forcing exerted by sinking organic matter that originates in the sur-face layer, while parameters of ocean circulation like mean flow and eddy diffusivities set the system’s reaction: the emanating shape of the oxygen concentration field and
15
the size of associated oxygen fluxes. In this view, feedbacks on organic matter supply by long-term changes in circulation parameters are ignored.
For the future in the wake of a warming ocean with increasing stratification, a net decline of the global ocean oxygen content is expected, and with it an expansion and intensification of OMZs is anticipated (Keeling et al., 2010). Consequences of oxygen
20
decline for biogeochemical cycles, marine organisms and ecosystems are expected to be profound, particularly in regions that are already low in oxygen (Ekau et al., 2010; Gruber, 2011; Wright et al., 2012). Observations over the past decades indicate a re-cent decline in global subsurface ocean oxygen content (Stramma et al., 2010; Helm et al., 2011), with some exceptions particularly in the subtropical gyres (Stramma et al.,
25
BGD
9, 14291–14325, 2012
Oxygen supply to tropical Atlantic OMZ
Fischer et al.
Title Page
Abstract Introduction
Conclusions References
Tables Figures
◭ ◮
◭ ◮
Back Close
Full Screen / Esc
Printer-friendly Version Interactive Discussion
Discussion
P
a
per
|
Dis
cussion
P
a
per
|
Discussion
P
a
per
|
Discussio
n
P
a
per
|
2005); nonetheless they consistently predict global ocean oxygen loss under future climate scenarios (Keeling et al., 2010). What will happen to extent and intensity of individual OMZs in the future, is however less clear. Oxygen solubility, stratification, circulation, and organic export production are all processes that can be affected by climate change (Bopp et al., 2001, 2002), and each of them, by their effect on
ventila-5
tion and consumption, sensitively influences the extent and intensity of OMZs (Gruber, 2011). Simulation efforts have resulted in projections of future global OMZ volume from expansion (Matear and Hirst, 2003; Oschlies et al., 2008) to neutral (Gruber, 2011) to contraction (Duteil and Oschlies, 2011). The latter study found all three possible trends, with the sign of the predicted trend being sensitive to the amount of background
diapy-10
cnal mixing. Supply path research is still rated a critical issue at the base of OMZ process understanding and the ability to predict OMZ fate (Keeling et al., 2010). De-spite ongoing progress (e.g. Brandt et al., 2010; Banyte et al., 2012), uncertainties concerning size and relative importance of supply paths and processes remain.
Here we report on observed diapycnal mixing, and the corresponding diapycnal
oxy-15
gen supply, in the tropical North Atlantic OMZ, i.e. an OMZ that has shown a notice-able oxygen decline during the last 5 decades (Stramma et al., 2008b, 2009). In the framework of the German research programmes SFB754, SOPRAN, and NORTH AT-LANTIC and the EU project EUROSITES, observation activities intensified in this re-gion since 2008, with several cruises to the tropical North Atlantic OMZ. A large scale
20
tracer release experiment (GUTRE, Guinea Upwelling Tracer Release Experiment) in the oxycline above the OMZ core provided an integrative view on diapycnal diffusivity (Banyte et al., 2012). An extensive grid of local measurements of diapycnal diffusivity performed by microstructure profiling and shipboard acoustic current profiling, together with oxygen profiles, provided an independent approach and statistical background
in-25
BGD
9, 14291–14325, 2012
Oxygen supply to tropical Atlantic OMZ
Fischer et al.
Title Page
Abstract Introduction
Conclusions References
Tables Figures
◭ ◮
◭ ◮
Back Close
Full Screen / Esc
Printer-friendly Version Interactive Discussion
Discussion
P
a
per
|
Dis
cussion
P
a
per
|
Discussion
P
a
per
|
Discussio
n
P
a
per
|
2 Study site
2.1 Tropical North Atlantic oxygen minimum zone
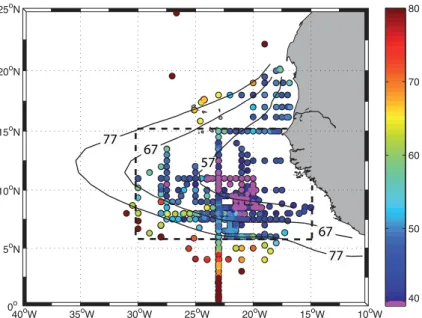
The OMZ in the tropical North Atlantic Ocean (Fig. 1) approximately matches the Guinea Dome region (Siedler et al., 1992). This coincidence is most likely caused by both, OMZ and Guinea Dome, being linked to the zone of weak circulation between
5
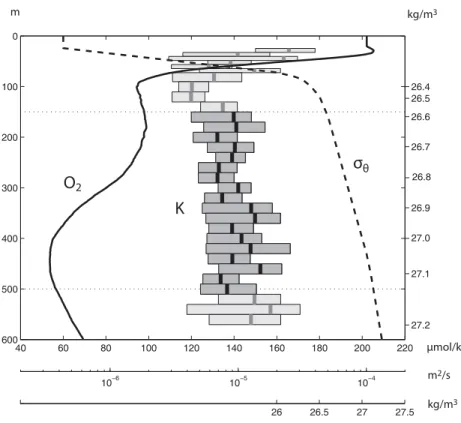
North Equatorial Current (NEC at 20◦N to 15◦N) and North Equatorial Countercur-rent/Undercurrent (NECC/NEUC at 5◦N) (Karstensen et al., 2008). Vertical oxygen profiles in this region typically exhibit two oxygen minimum layers at core depths of about 100 m and 450 m (Fig. 4). The shallow minimum exists in about 80 to 90 % of our observations, with observations that lack a shallow minimum being scattered
through-10
out the area, but becoming more frequent towards the southern edge of the OMZ. The oxygen minimum at about 450 m exists in all profiles in the region, and in the following we will only study this deeper, more voluminous and more intense oxygen minimum. Its core is at the interface between Antarctic Intermediate Water (AAIW) and the overlying Central Water (Stramma et al., 2008a). The vertical position of the core in the OMZ
re-15
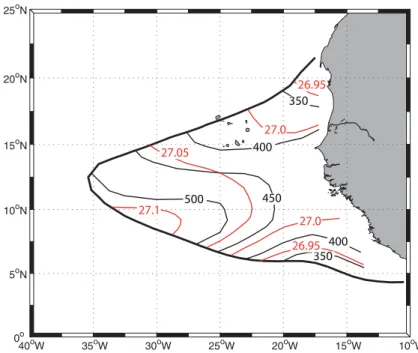
gion does neither perfectly follow isobaths nor isopycnals (Fig. 2). However it is better aligned to isopycnals: the standard deviation of the core vertical position in the OMZ is 60 m with respect to the mean core depth of 425 m, and 40 m with respect to the mean core isopycnal 27.03 kg m−3. The position of the maximum oxygen gradient above the OMZ core (at about 300 m depth) will be called “deep oxycline” throughout this study,
20
in order to distinguish it from the oxycline just below the mixed layer (Fig. 4). We de-fine horizontal OMZ extent by the 60 µmol kg−1 isoline of oxygen core concentration as observed between 2008 and 2010 (Fig. 1). The region encompassed by this iso-line excludes better ventilated adjacent regimes, particularly those associated with the eastward flow of the NECC/NEUC in the South and with the subtropical gyre at Cape
25
BGD
9, 14291–14325, 2012
Oxygen supply to tropical Atlantic OMZ
Fischer et al.
Title Page
Abstract Introduction
Conclusions References
Tables Figures
◭ ◮
◭ ◮
Back Close
Full Screen / Esc
Printer-friendly Version Interactive Discussion
Discussion
P
a
per
|
Dis
cussion
P
a
per
|
Discussion
P
a
per
|
Discussio
n
P
a
per
|
2.2 Analysis box
For the analysis of diapycnal oxygen flux, a box is chosen from 6 to 15◦N latitude, 30 to 15◦W longitude, and 150 to 500 m depth. This analysis box covers large parts of the OMZ at its 60 µmol kg−1 isoline of core concentration, and it is centered at the location of the lowest observed core concentrations just below 40 µmol kg−1 (Fig. 1).
5
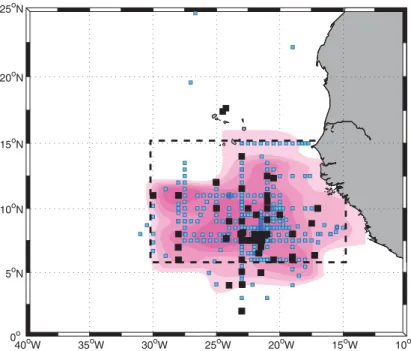
Nevertheless it omits some parts of the OMZ: to the Northeast a region associated with upwelling, to the West a part where we expect core concentrations between 50 and 60 µmol kg−1, and to the Southeast a part inside the shelf region and exclusive economic zones of some West African states. The chosen analysis box is the place where diapycnal mixing can be constrained best, because it was horizontally and
ver-10
tically filled with tracer in the later phase of tracer release experiment GUTRE (after 20 and 30 months), and because most supplemental diapycnal mixing measurements that are suitable for our analysis were conducted during GUTRE surveys inside the analysis box (Fig. 3). The chosen depth interval extends from below the shallow oxy-gen minimum via the deep oxycline down to the core of the deep oxyoxy-gen minimum
15
(Fig. 4). Thus our analysis is confined to the upper half of the deep oxygen minimum layer, and diapycnal oxygen flux to the OMZ from the well oxygenated waters below the OMZ will not be considered in this study. Stratification (N2) is near constant through the chosen depth interval for individual profiles but varies from 1×10⁻⁵to 2×10⁻⁵s−2 in the region with higher values found towards the Southeast (e.g. Banyte et al., 2012).
20
3 Data and methods
3.1 Diapycnal diffusivity, diapycnal flux, diapycnal flux divergence
and averaging
Diapycnal diffusivityK will be used to describe diapycnal mixing and to estimate the di-apycnal flux of watermass properties. Due to the presence of turbulence in the ocean,
BGD
9, 14291–14325, 2012
Oxygen supply to tropical Atlantic OMZ
Fischer et al.
Title Page
Abstract Introduction
Conclusions References
Tables Figures
◭ ◮
◭ ◮
Back Close
Full Screen / Esc
Printer-friendly Version Interactive Discussion
Discussion
P
a
per
|
Dis
cussion
P
a
per
|
Discussion
P
a
per
|
Discussio
n
P
a
per
|
diapycnal property fluxes are greatly enhanced compared to property fluxes in a non-turbulent fluid. Diapycnal diffusivities are thus strongly governed by the turbulent flow characteristics of the oceanic region, albeit in principleK must be differentiated with respect to the watermass property in focus. As in our case the appropriateKoxygen is
inaccessible, approximate estimates had to be used. In this study, three different
mea-5
surement methods are used to estimate K: from the diapycnal spreading of a tracer during GUTRE (Sect. 3.4), from direct measurements of the strength of turbulence us-ing microstructure shear profiles (Sect. 3.5) and from vessel mounted Acoustic Doppler Current Profiler (vmADCP) data (Sect. 3.6). While GUTRE delivered an estimate of Ktracer (orKTRE), with the tracer supposedly behaving similar to dissolved oxygen,
mi-10
crostructure and vmADCP measurements delivered an estimate ofKρ, the diapycnal diffusivity of mass.
The diapycnal oxygen flux Φ can be estimated using Fick’s first law of diffusion if simultaneous profiles of oxygen concentration (Sect. 3.3) and diapycnal diffusivity are available. The diapycnal flux is a down gradient flux perpendicular to density surfaces,
15
driven by diapycnal diffusivity. The necessary diapycnal gradient of oxygen concentra-tion to calculateΦcan be approximated by the vertical gradient of oxygen concentra-tion, so that
Φ =−ρ K
c ∂
∂zc (1)
withρ water density in kg m−3,Kc diapycnal diffusivity of oxygen in m
2
s−1,coxygen
20
concentration in µmol kg−1and resulting diapycnal fluxΦin µmol m−2s−1.
When regarding the oxygen budget in a volume enclosed by two isopycnal surfaces, the diapycnal influx across the first isopycnal surface does not need to be of the same magnitude as the diapycnal outflux across the second isopycnal surface. The difference of the two diapycnal fluxes is described by diapycnal flux divergence∇Φ, which can be
25
BGD
9, 14291–14325, 2012
Oxygen supply to tropical Atlantic OMZ
Fischer et al.
Title Page
Abstract Introduction
Conclusions References
Tables Figures
◭ ◮
◭ ◮
Back Close
Full Screen / Esc
Printer-friendly Version Interactive Discussion
Discussion
P
a
per
|
Dis
cussion
P
a
per
|
Discussion
P
a
per
|
Discussio
n
P
a
per
|
to quantify net oxygen supply of the density layer caused by diapycnal processes, it is necessary to observe−∇Φ.
Ultimately, the goal is to determine averaged profiles of diapycnal diffusivities, fluxes and flux divergences for the entire OMZ. Thus averaging along isopycnal surfaces is a necessary processing step which will be denoted by brackets, e.g. as inhKi. Unless
5
otherwise specified the brackets mean arithmetic averaging after objective mapping on isopycnal surfaces. For the objective mapping, the decorrelation scale was determined to 0.5◦. Additionally, averaging in diapycnal direction will occur and will be denoted by an overbar, e.g. as inK, so that a total average for the entire analysis box in this example would behKi.
10
3.2 Data overview
The data was collected during 4 cruises in November 2008 (R.V. Merian MSM10/1), November and December 2009 (R.V. Meteor M80/1 and M80/2) and October 2010 (R.V. Meteor M83/1), during the tracer surveys for GUTRE. Oxygen was measured using a Conductivity-Temperature-Depth profiler (CTD) with added Clark-type oxygen
15
sensors (CTD-O2). For most of the oxygen profiles, simultaneous estimates of
diapyc-nal diffusivity Kρ from microstructure profiles or vmADCP were available. In total, 400 complete profiles consisting of CTD-O2 and diapycnal diffusivity were collected in the
analysis box (Fig. 3). The tracer surveys delivered one additional independent space-time-averaged estimate of diapycnal diffusivity for the entire region for 2008 through
20
BGD
9, 14291–14325, 2012
Oxygen supply to tropical Atlantic OMZ
Fischer et al.
Title Page
Abstract Introduction
Conclusions References
Tables Figures
◭ ◮
◭ ◮
Back Close
Full Screen / Esc
Printer-friendly Version Interactive Discussion
Discussion
P
a
per
|
Dis
cussion
P
a
per
|
Discussion
P
a
per
|
Discussio
n
P
a
per
|
3.3 Oxygen and CTD data calibration
Each ship station that is considered here comprises a CTD-O2profile, down to at least
the deep oxygen minimum core at about 400 to 500 m. On the four cruises evaluated here (MSM10/1, M80/1, M80/2, and M83/1) similar CTD/rosette systems were used, consisting of a Seabird 911plus CTD equipped with dual Seabird temperature,
conduc-5
tivity, and oxygen sensors. During each of the cruises several hundred water samples were collected to calibrate the conductivity and oxygen sensors using a Guildline Au-tosal 8400B salinometer and a Winkler titration stand. The deviations between the in situ conductivity measured by the Seabird CTD and the high accuracy on-board wa-ter sample measurements using salinomewa-ters were used to derive a correction to the
10
CTD’s conductivity linear in pressure, temperature, and CTD conductivity itself. After applying the corrections, the resulting absolute accuracy of the CTD salinity values was estimated to 0.005, 0.002, 0.002, and 0.003 for the cruises MSM10/1, M80/1, M80/2, and M83/1, respectively. Laboratory calibration suggests the accuracy of the tempera-ture and pressure measurements to be better than 0.002 K and 1.5 dbar, respectively.
15
Similar to conductivity, the deviations between the CTD and the on-board Winkler titra-tions were used to derive a correction to the CTD’s oxygen measurements. The chosen correction was linear in pressure, temperature, and oxygen, and we estimate the ab-solute accuracy of the CTD’s oxygen measurements to be better than 3, 1, 1, and 1 µmol kg−1for the four cruises, respectively.
20
While these estimates of the CTD data’s absolute uncertainty and their only slowly varying corrections are useful for comparisons with other observations, for our analysis of vertical oxygen gradients an estimate of the oxygen sensor noise and precision is more relevant. We found that the oxygen sensors had a typical instrument noise of less than 0.2 µmol kg−1. The estimates of vertical oxygen gradients used here are based
25
BGD
9, 14291–14325, 2012
Oxygen supply to tropical Atlantic OMZ
Fischer et al.
Title Page
Abstract Introduction
Conclusions References
Tables Figures
◭ ◮
◭ ◮
Back Close
Full Screen / Esc
Printer-friendly Version Interactive Discussion
Discussion
P
a
per
|
Dis
cussion
P
a
per
|
Discussion
P
a
per
|
Discussio
n
P
a
per
|
3.4 K estimated from GUTRE
The deliberate Guinea Upwelling Tracer Release Experiment (GUTRE) was performed in the deep oxycline in the tropical North Atlantic OMZ, in order to obtain a time- and space-integrated estimate of diapycnal diffusivity at the OMZ’s upper limit. 92 kg of the halocarbonic compound SF5CF3 (Ho et al., 2008) were released in April 2008 at 8◦N
5
23◦W at the isopycnal surface σθ = 26.88 kg m−
3
. The expanding tracer patch was sampled during 3 survey campaigns (MSM10/1, M80 and M83/1) 7, 20 and 30 months after injection. After 20 and 30 months, the tracer essentially covered the analysis box horizontally and vertically. From the increase of the vertical extent of the isopycnally integrated tracer distribution, the time-space-averaged diapycnal diffusivity was
esti-10
mated to behKiTRE=(1.19±0.18)×10
−5
m2s−1(Banyte et al., 2012). The uncertainty on 95 % confidence level is based on bootstrapping and measurement errors. During all 3 surveys the mean tracer concentration profile showed no significant skew.
3.5 K estimated from microstructure data
As an independent method from GUTRE, diapycnal diffusivities were also estimated
15
using microscale shear recordings from a loosely-tethered microstructure profiler. Dur-ing the tracer survey cruises, the microstructure profiler MSS90D (termed MSS in the following) of Sea and Sun Technology, Trappenkamp, Germany, was used immediately after certain CTD casts. Usually 3 profiles in a series down to 500 m at 0.5 m s−1sink velocity were collected at these ship stations. In total, MSS data could be obtained on
20
45 ship stations in the analysis box.
On the way to estimate diapycnal diffusivities from MSS, the signal from 2 to 4 air-foil shear sensors at the profiler head was converted to profiles of microscale verti-cal shear. Then the dissipation rate ǫof turbulent kinetic energy could be estimated from the power spectrum of microscale vertical shear, by using a vertical wavenumber
25
BGD
9, 14291–14325, 2012
Oxygen supply to tropical Atlantic OMZ
Fischer et al.
Title Page
Abstract Introduction
Conclusions References
Tables Figures
◭ ◮
◭ ◮
Back Close
Full Screen / Esc
Printer-friendly Version Interactive Discussion
Discussion
P
a
per
|
Dis
cussion
P
a
per
|
Discussion
P
a
per
|
Discussio
n
P
a
per
|
Osborn parametrizationKρ= Γǫ N−2 (Osborn, 1980) with Γ the dimensionless dissi-pation ratio that is related to mixing efficiency.Γ was set 0.2, because simulation data by Shih et al. (2005) suggest this value to be appropriate for weak to moderate turbu-lence, what is what was found in the analysis box. The value 0.2 is further supported by findings of St. Laurent and Schmitt (1999), who reportΓ between 0.15 and 0.25 in
5
turbulence dominated regimes with weak mean shear, conditions that were also met in the analysis box. For the analyses of this study, vertical averages ofǫ and N2 for the depth interval 150 m through 500 m were used to infer a single averageKρ,MSSper
ship station via the Osborn parametrization. The uncertainty ofKρ,MSS was estimated
from quantifiable errors (essentially from sensor uncertainties and spectral estimation)
10
to be 60 % on a 95 % confidence level.
3.6 K estimated from vmADCP
The possibility to obtain additional estimates of Kρ from current velocity profiles via vmADCP substantially enhanced the number of “complete” station data comprising CTD plus oxygen plusK, which could be used to infer diapycnal oxygen flux; the
num-15
ber rising from 45 to 400 inside the analysis box (Fig. 3). The method is based on the observation that finescale vertical shear with vertical wavelengths of order 10 m to some 100 m and dissipation rateǫof turbulent kinetic energy can be related (Gargett, 1976; Gregg, 1989). It had been used before with Lowered ADCP data (Polzin et al., 2002; Kunze et al., 2006). The main processing strategy for the application to vmADCP
20
data during ship stations was: (1) generate velocity profiles with noise low enough, so that vertical shear signals can still be detected which are on the order of the open ocean background level; (2) obtain spectra of vertical shear of horizontal velocity, in finescale vertical wavenumber range; (3) obtain dissipation rateǫfrom shear power spectral level ΦS by a parametrization (see appendix), which uses MSS measurements for
calibra-25
BGD
9, 14291–14325, 2012
Oxygen supply to tropical Atlantic OMZ
Fischer et al.
Title Page
Abstract Introduction
Conclusions References
Tables Figures
◭ ◮
◭ ◮
Back Close
Full Screen / Esc
Printer-friendly Version Interactive Discussion
Discussion
P
a
per
|
Dis
cussion
P
a
per
|
Discussion
P
a
per
|
Discussio
n
P
a
per
|
Minutiae of processing were: During 3 survey cruises MSM10/1, M80/2 and M83/1, an RDI Ocean Surveyor 75 kHz vmADCP continuously recorded currents down to 600 m depth at 8 m vertical bin size. The broadband mode that we used, a high ping frequency (36 min−1), usually calm sea conditions, and a final two-dimensional filter-ing step of velocity fields in depth-time-space, resulted in one-minute-average velocity
5
data of 1 cm s−1 precision at 95 % level (for technical details refer to Fischer, 2011). From the one-minute-averaged and filtered velocity profiles, spectra of vertical shear were calculated for 150 to 533 m depth and corrected following Polzin et al. (2002) for variance losses caused by ADCP binning, tilting and ping averaging. The resulting one-minute shear power spectra were usable in the wavenumber band from 1/128 cpm
10
to 1/38.4 cpm. Power spectra were averaged over the duration of a ship station, and served to estimate a single value of shear power spectral levelΦSfor that ship station and the entire depth interval 150 to 500 m.ΦSled toǫADCPafter using the parametriza-tion Eq. (A5), and toKρ,ADCPafter using the Osborn parametrization. The uncertainty of
ǫADCPwas estimated to be 60 % on 95 % confidence level, resulting from measurement
15
noise, discrete spectrum estimation, and error progression through the parametrization Eq. (A5).
3.7 Implications ofK derived from different sources
Apart from physical differences of the derived diapycnal diffusivities, the 3 applied meth-ods deliveredK estimates, which also differ in the grade to which they represent spatial
20
and temporal averaged quantities. The immediate result of the MSS measurements were vertical profiles ofKρfor each ship station at about 0.5 m depth resolution, the re-sult of the vmADCP processing was a single vertical averageKρfor each ship station, and the TRE delivered essentially one time-space-averagehKi for the entire analysis box during 2008 to 2010. For the further processing ofK – i.e. to deliver estimates of
25
BGD
9, 14291–14325, 2012
Oxygen supply to tropical Atlantic OMZ
Fischer et al.
Title Page
Abstract Introduction
Conclusions References
Tables Figures
◭ ◮
◭ ◮
Back Close
Full Screen / Esc
Printer-friendly Version Interactive Discussion
Discussion
P
a
per
|
Dis
cussion
P
a
per
|
Discussion
P
a
per
|
Discussio
n
P
a
per
|
interval 150 to 500 m for timescales larger than several days. This assumption gets supported by the MSS derived averageKρprofilehKρiMSS, which shows no significant
gradient in 150 to 500 m (Fig. 4), as well as by GUTRE tracer profiles, which showed no significant deviation from a Gaussian (Banyte et al., 2012). Vertical homogeneity in 150 to 500 m is also suggested by the majority of individual density profiles in the
5
analysis box, which show a near constant stratification. The assumption of vertically homogeneousK implies that (1) vertical averaging ofK for MSS data is equivalent to averaging of longer timeseries, which we lack; (2)K defines the level of the assumed constantK profile at each ship station; in that sense K and K are equivalent for the process of isopycnal averaging (e.g. to estimatehΦi).
10
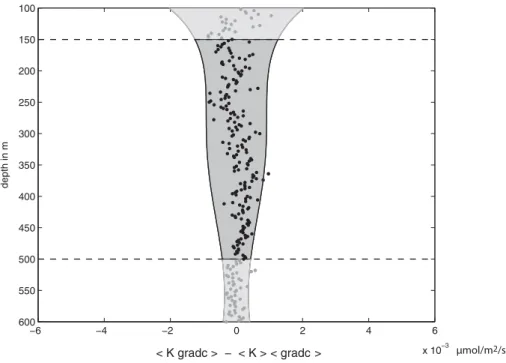
Another property of our dataset is the statistical independence ofKρ resp.Kρ from MSS/ADCP and the corresponding oxygen gradient, as shown in Fig. 5 for all depths between 150 and 500 m. The independence is expressed in the equivalence ofhKρ× gradciandhKρi×hgradci. This also means thathΦimay be calculated ashhKi×gradci, i.e.K may also be treated as if it was laterally homogeneous (but this time on the long
15
timescale of the TRE duration). The estimates of this effective long-term largescale K will be denoted hKiTRE andhKiMSS/ADCP (MSS and ADCP combined, because the
ADCP method was calibrated with MSS measurements).
4 Results and discussion
4.1 Diapycnal diffusivities
20
Estimates of diapycnal diffusivity were derived from the deliberate tracer release ex-periment GUTRE and from MSS/ADCP methods. The different estimates are eval-uated by comparing the box average hKiMSS/ADCP, calculated from microstructure
measurements enhanced by vessel mounted ADCP, to the GUTRE value hKiTRE.
From MSS/ADCP we find an average diapycnal diffusivity of mass of hKiMSS/ADCP
BGD
9, 14291–14325, 2012
Oxygen supply to tropical Atlantic OMZ
Fischer et al.
Title Page
Abstract Introduction
Conclusions References
Tables Figures
◭ ◮
◭ ◮
Back Close
Full Screen / Esc
Printer-friendly Version Interactive Discussion
Discussion
P
a
per
|
Dis
cussion
P
a
per
|
Discussion
P
a
per
|
Discussio
n
P
a
per
|
= 0.95×10⁻⁵m2s−1 with 95 % confidence interval [0.91 1.08]×10−5m2s−1 which has been estimated by a bootstrap method. Banyte et al. (2012) report a tracer di-apycnal diffusivity of hKiTRE = 1.19×10⁻⁵m2s−1 with 95 % confidence interval [1.01 1.37]×10−5m2s−1(Sect. 3.4). The difference betweenhKiMSS/ADCPandhKiTREis mod-erate but significant: the probability to find this or a greater difference is 2 %, when two
5
independent measurement methods are applied to estimate the value ofhKi, and these methods have uncertainties according to the two reported confidence intervals.
There are several possible physical reasons for the diffusivity of a passive tracer, KTRE, and the diffusivity of mass,Kρ, to be different. One fundamental difference be-tween the two is related to double diffusive processes: in salt finger regimes, salt and
10
other passive tracers are transported more effectively than buoyancy; thus tracer dif-fusivities are enhanced. In our case this would mean to get a low-biased value of
hKi when using hKiMSS/ADCP for an estimate. St. Laurent and Schmitt (1999) report
for another TRE site in the subtropical North Atlantic (NATRE), that double diffusion can make up for the difference that was found here between KTRE and Kρ. In order
15
to estimate the relative importance of double diffusion, double diffusive enhancement ofK was estimated from CTD profiles following St. Laurent and Schmitt (1999), with salt-finger thermal diffusivity k(f)
θ assumed to be 6×10 −6
m2s−1. Applying this method to the depth interval 150 to 500 m suggests that double diffusive enhancement could add 0.1×10⁻⁵m2s−1 tohKiMSS/ADCP in the upper part of the Central Water, then be
20
negligible for±50 m above and below the deep oxycline, while sharply rising just at the OMZ core depth to 0.3×10⁻⁵m2s−1 and further rising to 0.5×10⁻⁵m2s−1 below the core depth. For the entire 150 to 500 m depth interval this would result in an effective enhancement ofhKiMSS/ADCP by roughly 0.1×10−
5
m2s−1, which in turn would make the difference betweenhKiMSS/ADCP andhKiTREinsignificant.
25
Besides this possible explanation for the difference between hKiMSS/ADCP and
BGD
9, 14291–14325, 2012
Oxygen supply to tropical Atlantic OMZ
Fischer et al.
Title Page
Abstract Introduction
Conclusions References
Tables Figures
◭ ◮
◭ ◮
Back Close
Full Screen / Esc
Printer-friendly Version Interactive Discussion
Discussion
P
a
per
|
Dis
cussion
P
a
per
|
Discussion
P
a
per
|
Discussio
n
P
a
per
|
amount that could not be accounted for in the methods’ uncertainties. Concerning the TRE this applies to (1) the fact that for each tracer survey about half of the tracer patch could not be sampled and thus the deduced diapycnal extent of the patch might be bi-ased; (2)hKiTREbeing biased towards the early TRE period in which the tracer did only
cover a fraction of the entire region. Concerning MSS measurements this applies to (1)
5
underlying assumptions in the train of calculating turbulent diffusivity (e.g. the value of dissipation ratioΓin the Osborn parametrization), (2) seasonal bias, (3) some gaps in the sampling of the analysis box. We interpret the similarity of the two estimatedhKi
values as indication that the unaccounted systematic biases are small. But we cannot decide which of the twohKiestimates is better, and thus leave the two for further
calcu-10
lations, in their difference representing the additional uncertainty in estimated diapycnal diffusivity that results from applying different methods.
The average diapycnal diffusivity that we find for the analysis box is distinctly higher than expected for this latitude range. An internal wave field with background intensity and with stratification in the found range of 1 to 2×10⁻⁵s−2should exhibit ahKiof only
15
some 10−6m2s−1following the parametrization in Gregg et al. (2003). The discrepancy inhKiis coincident with rough bottom topography in the analysis box and an intensified internal wave field (Fischer, 2011).
4.2 Diapycnal oxygen flux in the analysis box
Diapycnal diffusivities and oxygen gradients are combined to an average profile of
di-20
apycnal oxygen flux as function of density for the analysis box (Fig. 6). Here the depth interval 150 to 500 m, for which we knowK, roughly corresponds to the potential den-sity range ofσθ=26.55 kg m−3to 27.1 kg m−3 in a near linear relation. Main features of the diapycnal oxygen flux profile are two layers of zero flux which correspond to positions of zero oxygen gradient in the mean oxygen profile, and a maximum
oxy-25
BGD
9, 14291–14325, 2012
Oxygen supply to tropical Atlantic OMZ
Fischer et al.
Title Page
Abstract Introduction
Conclusions References
Tables Figures
◭ ◮
◭ ◮
Back Close
Full Screen / Esc
Printer-friendly Version Interactive Discussion
Discussion
P
a
per
|
Dis
cussion
P
a
per
|
Discussion
P
a
per
|
Discussio
n
P
a
per
|
into an upper and a lower half and that oxygen supply can be assessed separately for these OMZ halves. The depth interval of our data only allows calculations for the upper half of the OMZ. The upper layer of zero diapycnal flux atσθ=26.63 kg m−3is situated in the overlying Central Water that carries a relatively high oxygen concentration, and it exists because of the widespread presence of a shallow oxygen minimum above. The
5
existence of the layer of zero diapycnal flux means that in the analysis box the oxygen supply to the OMZ has no direct link to the surface ocean. The diapycnal downflux of oxygen at the deep oxycline (σθ=26.85 kg m−
3
) is about (5±1)×10−3µmol m−2s−1. This may be interpreted as a diapycnal supply of about 1.5 µmol kg−1a−1 from the overlying Central Water to the upper half of the OMZ, or as a redistribution of oxygen
10
inside the water body that is limited by the two layers of zero diapycnal flux.
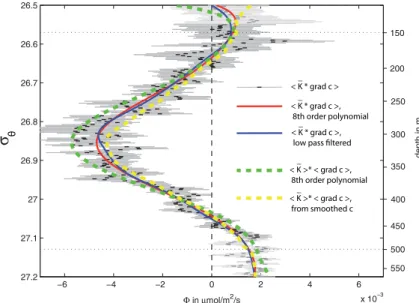
4.3 Sensitivity to data processing
The processing of the diapycnal flux profile was performed in various ways, with respect to the measurement method for K and the sequence order of processing steps, in order to explore the sensitivity of the result to processing decisions. The
15
reference method to obtain diapycnal flux, as defined by us, was calculating local flux profiles from local KMSS/ADCP and local oxygen gradients in small (2 m)
inter-vals, then averaging local flux profiles isopycnally to an aggregated flux profile and finally smoothing vertically (in a symbolic notation:hKMSS/ADCP×gradcismoothed). Other
ways of processing were tested against this reference. Swapping isopycnal
averag-20
ing and flux calculation ([hKMSS/ADCPi × hgradci]smoothed) has, as expected, little effect
since KMSS/ADCP and gradc are statistically independent in our dataset (Sect. 3.7).
Thus using hKiTRE to calculate diapycnal flux by [hKiTRE×hgradci]smoothed essentially
differs from hKMSS/ADCP×gradcismoothed by the factor hKiTRE / hKiMSS/ADCP. The at-tempt to reduce measurement error by smoothing local oxygen gradient profiles
be-25
BGD
9, 14291–14325, 2012
Oxygen supply to tropical Atlantic OMZ
Fischer et al.
Title Page
Abstract Introduction
Conclusions References
Tables Figures
◭ ◮
◭ ◮
Back Close
Full Screen / Esc
Printer-friendly Version Interactive Discussion
Discussion
P
a
per
|
Dis
cussion
P
a
per
|
Discussion
P
a
per
|
Discussio
n
P
a
per
|
[hKiTRE×hgradci]smoothed) not only reduces noise but also systematically reduces the
gradient and thus the estimated diapycnal flux (Fig. 6).
4.4 Sensitivity to coordinate choice
It may be worthwhile asking what the diapycnal flux across other surfaces than isopy-cnals is, even though then diapycnal flux is no longer perpendicular to these surfaces
5
and there also exists an isopycnal flux component across these surfaces. Obvious co-ordinate choices other than isopycnal could be isobaths or surfaces that are linked to features of the oxygen field. Such a different choice primarily changes the vertical shift with which profiles of oxygen gradient get aggregated in the process of averag-ing laterally (i.e. along the surfaces appropriate for the chosen coordinate system). We
10
examined two cases: (1) diapycnal flux across isobaths, (2) diapycnal flux across a sur-face that connects the gradient maxima of the deep oxycline. For case (1) the resulting diapycnal flux profile is similar in shape to the diapycnal flux profile of Fig. 6, but flux values are reduced by about 30 %; the downward diapycnal flux at the deep oxycline is about 3×10⁻³to 4×10⁻³µmol m−2s−1. A coordinate choice like in case (2) leads to
15
the maximum possible estimate of downward diapycnal flux at the deep oxycline; here the resulting flux is about 6×10⁻³to 7×10⁻³µmol m−2s−1.
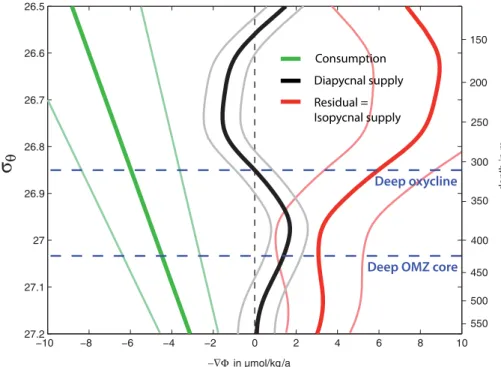
4.5 Diapycnal flux divergence and OMZ oxygen budget
Looking at the oxygen budget for individual isopycnal layers of the OMZ (Fig. 7) allows further insight into oxygen supply than just quantifying the oxygen flux across particular
20
surfaces. The contribution to oxygen supply by diapycnal processes, i.e. diapycnal sur-plus in units of moles oxygen per volume and time, is described by a negative diapycnal flux divergence (Sect. 3.1). Maximum diapycnal contribution happens at about the OMZ core, zero diapycnal contribution at the maximum oxygen gradients above and below the OMZ core. The overlying Central Water loses oxygen to the OMZ below by
diapy-25
BGD
9, 14291–14325, 2012
Oxygen supply to tropical Atlantic OMZ
Fischer et al.
Title Page
Abstract Introduction
Conclusions References
Tables Figures
◭ ◮
◭ ◮
Back Close
Full Screen / Esc
Printer-friendly Version Interactive Discussion
Discussion
P
a
per
|
Dis
cussion
P
a
per
|
Discussion
P
a
per
|
Discussio
n
P
a
per
|
the other terms of the oxygen budget – consumption rate and isopycnal supply –, con-sumption rate estimates may be taken from literature, while isopycnal supply is the difference of consumption rate and diapycnal supply, assuming steady state. Reported consumption rate profiles are diverse and uncertain (Keeling et al., 2010), but their principal shape is typically assumed to be exponential with depth (Martin et al., 1987;
5
Karstensen et al., 2008). Karstensen et al. (2008) estimated an exponential consump-tion rate profile specific for the Atlantic and Pacific OMZ regions from apparent oxygen utilization and estimated water ages. This profile is used here: consumption rate in µmol kg−1a−1is−0.5+12·exp(−0.0021·z) withz depth in meters. The uncertainty of the consumption rate was estimated to be 40 % (95 % confidence level) from the
scat-10
ter of Karstensen et al. (2008)’s reported oxygen utilization rates. Thus the resulting uncertainty of the deduced profile of isopycnal supply is large, but the main pattern seems clear: the profile of isopycnal oxygen supply resembles a step function, with large isopycnal supply in the Central water layer above the deep oxycline, and little isopycnal supply in the OMZ layer below the deep oxycline. The contribution of
diapy-15
cnal supply to the OMZ core may be estimated to be about a third of the demand, with large uncertainty.
5 Conclusions
The tracer release experiment and the MSS/ADCP measurements complement each other and delivered consistent estimates of diapycnal diffusivity K. For the 400
sta-20
tions in the analysis box, which covers large parts of the OMZ in the depth interval 150 to 500 m in the thermocline, we found statistical independence of local diapycnal diffusivity and local vertical oxygen gradient. This feature allows to estimate average diapycnal flux in the analysis box from the regional average of diapycnal diffusivity and the regional average of the oxygen gradient profile, given that these averages are
rep-25
BGD
9, 14291–14325, 2012
Oxygen supply to tropical Atlantic OMZ
Fischer et al.
Title Page
Abstract Introduction
Conclusions References
Tables Figures
◭ ◮
◭ ◮
Back Close
Full Screen / Esc
Printer-friendly Version Interactive Discussion
Discussion
P
a
per
|
Dis
cussion
P
a
per
|
Discussion
P
a
per
|
Discussio
n
P
a
per
|
gradients is also valid for other regions and substances, regional diapycnal fluxes may be estimated from datasets which comprise non-simultaneous measurements.
The estimated oxygen budget suggests that diapycnal mixing contributes substan-tially to oxygen supply of the tropical North Atlantic OMZ. In the layers of the analysis box associated with the OMZ core, about a third of total oxygen supply is diapycnal.
5
Such a rating of importance however depends on perspective and the chosen bound-aries, and potentially is subject to some adjustments when better estimates of isopyc-nal supply and consumption rate become available. It might be equally valid to assign the oxygen supply entirely to lateral processes: if choosing a layer bounded by isopy-cnal surfaces σθ = 26.63 kg m−3 and 27.03 kg m−3 (each with zero diapycnal flux),
10
the supply of the water column inbetween must be completely isopycnal and the role of diapycnal mixing would reduce to just generating internal oxygen redistribution. But even with this latter perspective, the role of diapycnal mixing is substantial. If diapyc-nal mixing was less intense than observed, the oxygen distribution in the adiapyc-nalysis box would certainly be another: given the other parameters kept constant, the vertical
oxy-15
gen gradient would most likely become sharper and the oxygen concentration in the OMZ core would become lower. In sum we conclude that the higher than expected level of diapycnal mixing in the study region (Sect. 4.1) plays a substantial role in shaping the oxygen concentration field and supposedly also in causing relatively high levels of oxygen in the core of the tropical North Atlantic OMZ compared to other OMZs.
20
The importance of diapycnal flux to supply the lower half of the deep OMZ with oxygen from AAIW can only hardly be evaluated with the present data, which mostly did not reach the necessary depths. But there are indications that the diapycnal influence is substantial as well. Although gradient and curvature of oxygen concentration are known to be lower in the lower half than in the upper half of the OMZ, turbulent diffusivity
25
BGD
9, 14291–14325, 2012
Oxygen supply to tropical Atlantic OMZ
Fischer et al.
Title Page
Abstract Introduction
Conclusions References
Tables Figures
◭ ◮
◭ ◮
Back Close
Full Screen / Esc
Printer-friendly Version Interactive Discussion
Discussion
P
a
per
|
Dis
cussion
P
a
per
|
Discussion
P
a
per
|
Discussio
n
P
a
per
|
above. A scheduled TRE starting by the end of 2012 aims at estimating isopycnal and diapycnal diffusivity around the OMZ core and will elucidate the relative importance of supply processes; together with ADCP and microstructure profiles down to 1000 m.
Local profiles of consumption rate are still difficult to obtain (e.g. Keeling et al., 2010), but are important for closing the budget. Nevertheless, the general tendency of
con-5
sumption rate to diminish with depth seems described well enough by the fitted ex-ponential of Karstensen et al. (2008), and moderate deviations from that profile would not change the main features of the deduced isopycnal oxygen supply profile as of (Fig. 7). In fact, some deviation from an exponential shape seems even probable, e.g. caused by active organic matter transport during diel vertical migration of zooplankton
10
(Angel, 1985; Steinberg et al., 2002). The local importance of the latter process for the OMZ region is unknown, but acoustic evidence of strong migrant activity suggests enhanced oxygen consumption at about 300 m and diminished oxygen consumption at about 200 m depth. This is a shape not uncommon in reported consumption profiles (Feely et al., 2004 for the Pacific), but on their reported level the effect would just be
15
shifting the jump in the isopycnal supply profile of Fig. 7 slightly downwards, while not changing the profile’s principal shape.
Concerning the shape of the deduced isopycnal supply profile, the sharp decline at the depth of the deep oxycline (Fig. 7) could principally originate from diffusive and/or advective supply. However we do not expect lateral diffusivities having a jump at the
20
deep oxycline, nor expect a vertical jump of proper sign in the second derivative of isopycnal oxygen distribution (supported by WOA09 climatological data; Garcia et al., 2010). This makes eddy processes an improbable reason for the sharp decline. Fur-ther we do not expect mean current velocities having a jump in magnitude or direction at the depth of the deep oxycline. Thus it is suggested that the main contribution to
25
BGD
9, 14291–14325, 2012
Oxygen supply to tropical Atlantic OMZ
Fischer et al.
Title Page
Abstract Introduction
Conclusions References
Tables Figures
◭ ◮
◭ ◮
Back Close
Full Screen / Esc
Printer-friendly Version Interactive Discussion
Discussion
P
a
per
|
Dis
cussion
P
a
per
|
Discussion
P
a
per
|
Discussio
n
P
a
per
|
of oxygen happening inside the region). The western boundary circulation character-ized by strong vertical shear is a likely candidate for generating sharp vertical oxygen gradients that could be transported within eastward current bands into the OMZ.
Appendix A
Dissipation rate parametrized from vessel mounted ADCP data
5
There is a widely known parametrization of dissipation rateǫfor the open ocean (Polzin et al., 1995; Gregg et al., 2003), which is based on the concept of breaking internal waves causing turbulence, dissipation and mixing. Important needed parameters to use this parametrization are finescale vertical shear and finescale vertical strain; “finescale” in this context comprises vertical wavenumbers of order 10 to order 100 m. In this study,
10
we had access to vertical shear via vmADCP data (Sect. 3.6), but for strain we lacked simultaneous data of satisfying quality. For remedy we fitted another parametrization with fewer parameters, using own data from the tropical North Atlantic Ocean, plus using data from midlatitudes, which were reported by Polzin et al. (1995) and formed the base of their parametrization.
15
Here two variables were used which have commonly been identified to influence mixing intensity in the open ocean: (1) the intensity of velocity vertical shear in the vertical wavelength band of tens to hundreds of meters, as providing the forcing, (2) the characteristic slope of internal waves, which influences their probability to break and cause turbulence, dissipation and mixing. The predictorsΨ1and Ψ2 we defined
20
for the parametrization were derived from these two variables, having been inspired by the Garrett-Munk (GM) internal wave model (Garrett and Munk, 1975; Munk, 1981). Ψ1was chosen proportional to the power spectral levelΦSof vertical finescale shear as
Ψ1=N2·G, (A1)
BGD
9, 14291–14325, 2012
Oxygen supply to tropical Atlantic OMZ
Fischer et al.
Title Page
Abstract Introduction
Conclusions References
Tables Figures
◭ ◮
◭ ◮
Back Close
Full Screen / Esc
Printer-friendly Version Interactive Discussion
Discussion
P
a
per
|
Dis
cussion
P
a
per
|
Discussion
P
a
per
|
Discussio
n
P
a
per
|
with N buoyancy frequency and G a nondimensional number describing the power spectral level of shear,ΦS, in relation to its GM background levelΦS,GM=const.·N2. Gwas estimated from vmADCP data by
G=
Φkmin...kmax
S
Φkmin...kmax
S,GM
, (A2)
and both Φkmin...kmax
S and Φ
kmin...kmax
S,GM were calculated in the vertical wavenumber
5
rangekmin=1/128 cpm to kmax=1/38.4 cpm by weighted averaging as Σ((9−i)/8·
ΦS,i)/Σ((9−i)/8) for the appropriateΦS,i at wavenumberski =(2+i)/384 cpm. This way to estimateG is specific to the used vmADCP configuration and the used depth interval for the analysis of 150 to 500 m. ButG is not expected to be sensitive to the particular choice ofki in the finescale range.Ψ2was chosen as
10
Ψ2= f
N, (A3)
withf the Coriolis parameter, because the characteristic slope of the internal wave field approximately is a power off ·N−1when assuming the GM model.
In order to fit a regression model we took the existing 45 stations with simultane-ous microstructure profiles, CTD profile and vmADCP measurements, plus data from
15
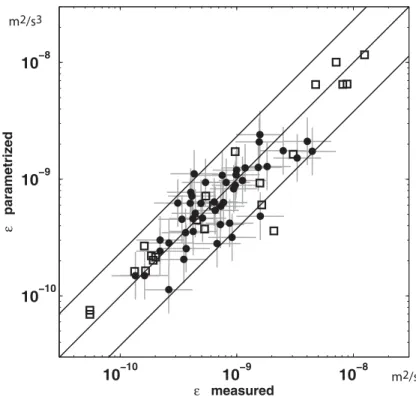
the High Resolution Profiler collected at several midlatitude locations as reported by Polzin et al. (1995). PredictorΨ1relied on vmADCP data for Gand CTD data forN2, predictorΨ2 needed latitude and CTD data forN, and predictand ǫwas provided by microstructure data. In order to avoid a skewed distribution in parameter space we did linear regression in logarithmic space, i.e. the regression model was logǫ=a0+a1·log
20
Ψ1+a2·logΨ2. The best model fit (Fig. 8) can be written as
ǫ= 1
100·Ψ
4/3 1 ·Ψ
5/9
BGD
9, 14291–14325, 2012
Oxygen supply to tropical Atlantic OMZ
Fischer et al.
Title Page
Abstract Introduction
Conclusions References
Tables Figures
◭ ◮
◭ ◮
Back Close
Full Screen / Esc
Printer-friendly Version Interactive Discussion
Discussion
P
a
per
|
Dis
cussion
P
a
per
|
Discussion
P
a
per
|
Discussio
n
P
a
per
|
with multiple correlationR2=0.80. This relation translates to
ǫ= 1
100·f
5/9·N19/9·G4/3
. (A5)
Acknowledgements. This study benefitted from cruises, infrastructure and financial sup-port by the German Federal Ministry of Education and Research through the co-operative projects SOPRAN and NORTH ATLANTIC, and by German Science Foundation’s Sonder-5
forschungsbereich SFB754 “Climate Biogeochemistry Interactions in the Tropical Ocean”. We acknowledge the support of the European Commission (FP7-EuroSITES grant agreement No. 202955). The support of captains, crews and scientific crews of Meteor cruise 80, Meteor cruise 83/1, Merian cruise 08/1, Merian cruise 10/1, L’Atalante cruises GEOMAR/3 and GEOMAR/4 is highly appreciated. We thank Johannes Karstensen for fruitful discussions. 10
The service charges for this open access publication have been covered by a Research Centre of the Helmholtz Association.
References
15
Angel, M. V.: Vertical migrations in the oceanic realm: possible causes and probable effects, in: Migration: Mechanisms and Adaptive Significance, Contributions in Marine Science, suppl. Vol. 27, edited by: Rankin, M. A., Checkley, D., Cullen, J., Kitting, C., and Thomas, P., Marine Science Institute, Austin, Texas, 45–70, 1985. 14310
Banyte, D., Tanhua, T., Visbeck, M., Wallace, D. W. R., Karstensen, J., Krahmann, G., 20
Schneider, A., Stramma, L., and Dengler, M.: Diapycnal diffusivity at the upper bound-ary of the tropical North Atlantic oxygen minimum zone, J. Geophys. Res., 117, C09016, doi:10.1029/2011JC007762, 2012. 14294, 14296, 14300, 14303, 14304
Bograd, S. J., Castro, C. G., Di Lorenzo, E., Palacios, D. M., Bailey, H., Gilly, W., and Chavez, F. P.: Oxygen declines and the shoaling of the hypoxic boundary in the California 25
BGD
9, 14291–14325, 2012
Oxygen supply to tropical Atlantic OMZ
Fischer et al.
Title Page
Abstract Introduction
Conclusions References
Tables Figures
◭ ◮
◭ ◮
Back Close
Full Screen / Esc
Printer-friendly Version Interactive Discussion
Discussion
P
a
per
|
Dis
cussion
P
a
per
|
Discussion
P
a
per
|
Discussio
n
P
a
per
|
Bopp, L., Monfray, P., Aumont, O., Dufresne, J.-L., Le Treut, H., Madec, G., Terray, L., and Orr, J. C.: Potential impact of climate change on marine export production, Global Bio-geochem. Cy., 15, 81–99, 2001. 14294
Bopp, L., Le Quere, C., Heimann, M., and Manning, A. C.: Climate-induced oceanic oxygen fluxes: Implications for the contemporary carbon budget, Global Biogeochem. Cy., 16, 1022, 5
doi:10.1029/2001GB001445, 2002. 14294
Brandt, P., Hormann, V., K ¨ortzinger, A., Visbeck, M., Krahmann, G., Stramma, L., Lumpkin, R., and Schmid, C.: Changes in the Ventilation of the Oxygen Minimum Zone of the Tropi-cal North Atlantic, J. Phys. Oceanogr., 40, 1784–1801, doi:10.1175/2010JPO4301.1, 2010. 14294, 14295
10
Duteil, O. and Oschlies, A.: Sensitivity of simulated extent and future evolution of marine sub-oxia to mixing intensity, Geophys. Res. Lett., 38, L06607, doi:10.1029/2011GL046877, 2011. 14293, 14294
Ekau, W., Auel, H., P ¨ortner, H.-O., and Gilbert, D.: Impacts of hypoxia on the structure and pro-cesses in pelagic communities (zooplankton, macro-invertebrates and fish), Biogeosciences, 15
7, 1669–1699, doi:10.5194/bg-7-1669-2010, 2010. 14293
Feely, R. A., Sabine, C. L., Schlitzer, R., Bullister, J. L., Mecking, S., and Greeley, D.: Oxy-gen utilization and organic carbon remineralization in the upper water column of the Pacific Ocean, J. Oceanogr., 60, 45–52, 2004. 14310
Fischer, T.: Diapycnal diffusivity and transport of matter in the open ocean estimated from 20
underway acoustic profiling and microstructure profiling, Ph.D. thesis, Leibniz Institute of Marine Sciences (GEOMAR), University of Kiel, Germany, 105 pp., 2011. 14302, 14305 Garcia, H. E., Locarnini, R. A., Boyer, T. P., Antonov, J. I., Baranova, O. K., Zweng, M. M.,
and Johnson, D. R.: World Ocean Atlas 2009 Volume 3 (Dissolved Oxygen, Apparent Oxy-gen Utilization, and OxyOxy-gen Saturation), NOAA Atlas NESDIS 70, edited by: Levitus, S., US 25
Government Printing Office, Washington, DC, 344 pp., 2010. 14310, 14318, 14319
Gargett, A. E.: An investigation of the occurrence of oceanic turbulence with respect to finestructure, J. Phys. Oceanogr., 6, 139–156, 1976. 14301
Garrett, C. and Munk, W.: Space-time scales of internal waves: A progress report, J. Geophys. Res., 80, 291–297, 1975. 14311
30
BGD
9, 14291–14325, 2012
Oxygen supply to tropical Atlantic OMZ
Fischer et al.
Title Page
Abstract Introduction
Conclusions References
Tables Figures
◭ ◮
◭ ◮
Back Close
Full Screen / Esc
Printer-friendly Version Interactive Discussion
Discussion
P
a
per
|
Dis
cussion
P
a
per
|
Discussion
P
a
per
|
Discussio
n
P
a
per
|
Gregg, M., Sanford, T. B., and Winkel, D. P.: Reduced mixing from the breaking of internal waves in equatorial waters, Nature, 422, 513–515, 2003. 14305, 14311
Gruber, N.: Warming up, turning sour, losing breath: ocean biogeochemistry under global change, Philos. T. Roy. Soc. A, 369, 1980–1996, doi:10.1098/rsta.2011.0003, 2011. 14293, 14294
5
Helm, K. P., Bindoff, N. L., and Church, J. A.: Observed decreases in oxygen content of the global ocean, Geophys. Res. Lett., 38, L23602, doi:10.1029/2011GL049513, 2011. 14293 Ho, D. T., Ledwell, J. R., and Smethie Jr., W. M.: Use of SF5CF3 for ocean tracer release
experiments, Geophys. Res. Lett., 35, L04602, doi:10.1029/2007GL032799, 2008. 14300 Karstensen, J., Stramma, L., and Visbeck, M.: Oxygen minimum zones in the 10
eastern tropical Atlantic and Pacific oceans, Prog. Oceanogr., 77, 331–350, doi:10.1016/j.pocean.2007.05.009, 2008. 14292, 14295, 14308, 14310, 14324
Keeling, R. F., K ¨ortzinger, A., and Gruber, N.: Ocean deoxygenation in a warming world, Annu. Rev. Mar. Sci., 2, 199–229, doi:10.1146/annurev.marine.010908.163855, 2010. 14293, 14294, 14308, 14310
15
Kunze, E., Firing, E., Hummon, J. M., Chereskin, T. K., and Thurnherr, A. M.: Global abyssal mixing inferred from lowered ADCP shear and CTD strain profiles, J. Phys. Oceanogr., 36, 1553–1576, 2006. 14301
Lam, P. and Kuypers, M. M. M.: Microbial nitrogen cycling processes in oxygen minimum zones, Annu. Rev. Mar. Sci., 3, 317–345, doi:10.1146/annurev-marine-120709-142814, 20
2011. 14293
Martin, J. H., Knauer, G. A., Karl, D. M., and Broenkow, W. W.: VERTEX: carbon cycling in the northeast Pacific, Deep-Sea Res., 34, 267–285, 1987. 14308
Matear, R. J. and Hirst, A. C.: Long-term changes in dissolved oxygen concentrations in the ocean caused by protracted global warming, Global Biogeochem. Cy., 17, 1125, 25
doi:10.1029/2002GB001997, 2003. 14294
Meissner, K. J., Galbraith, E. D., and V ¨olker, C.: Denitrification under glacial and interglacial con-ditions: A physical approach, Paleoceanography, 20, PA3001, doi:10.1029/2004PA001083, 2005. 14293
Munk, W. H.: Internal waves and small-scale processes, in: Evolution of Physical Oceanogra-30
BGD
9, 14291–14325, 2012
Oxygen supply to tropical Atlantic OMZ
Fischer et al.
Title Page
Abstract Introduction
Conclusions References
Tables Figures
◭ ◮
◭ ◮
Back Close
Full Screen / Esc
Printer-friendly Version Interactive Discussion
Discussion
P
a
per
|
Dis
cussion
P
a
per
|
Discussion
P
a
per
|
Discussio
n
P
a
per
|
Najjar, R. G., Jin, X., Louanchi, F., Aumont, O., Caldeira, K., Doney, S. C., Dutay, J.-C., Follows, M., Gruber, N., Joos, F., Lindsay, K., Maier-Reimer, E., Matear, R. J., Mat-sumoto, K., Monfray, P., Mouchet, A., Orr, J. C., Plattner, G.-K., Sarmiento, J. L., Schlitzer, R., Slater, R. D., Weirig, M.-F., Yamanaka, Y., and Yool, A.: Impact of circulation on export pro-duction, dissolved organic matter, and dissolved oxygen in the ocean: results from phase II 5
of the Ocean Carbon-cycle Model Intercomparison Project (OCMIP-2), Global Biogeochem. Cy., 21, GB3007, doi:10.1029/2006GB002857, 2007. 14293
Oakey, N. S.: Determination of the rate of dissipation of turbulent energy from simultaneous temperature and velocity shear microstructure measurements, J. Phys. Oceanogr., 12, 256– 271, 1982. 14300
10
Osborn, T. R.: Estimates of the local rat of vertical diffusion from dissipation measurements, J. Phys. Oceanogr., 10, 83–89, 1980. 14301
Oschlies, A., Schulz, K. G., Riebesell, U., and Schmittner, A.: Simulated 21st century’s increase in oceanic suboxia by CO2-enhanced biotic carbon export, Global Biogeochem. Cy., 22, GB4008, doi:10.1029/2007GB003147, 2008. 14294
15
Paulmier, A. and Ruiz-Pino, D.: Oxygen minimum zones (OMZs) in the modern ocean, Prog. Oceanogr., 80, 113–128, doi:10.1016/j.pocean.2008.08.001, 2009. 14292
Polzin, K. L., Toole, J. M., and Schmitt, R. W.: Finescale parameterizations of turbulent dissipa-tion, J. Phys. Oceanogr., 25, 306–328, 1995. 14311, 14312, 14325
Polzin, K., Kunze, E., Hummon, J., and Firing, E.: The finescale response of lowered ADCP 20
velocity profiles, J. Atmos. Ocean. Tech., 19, 205–224, 2002. 14301, 14302
Prince, E. D., Luo, J., Goodyear, C. P., Hoolihan, J. P., Snodgrass, D., Orbesen, E. S., Ser-afy, J. E., Ortiz, M., and Schirripa, M. J.: Ocean scale hypoxia-based habitat compres-sion of atlantic istiophorid billfishes, Fish. Oceanogr., 19, 448–462, doi:10.1111/j.1365-2419.2010.00556.x, 2010. 14293
25
Shih, L. H., Koseff, J. R., Ivey, G. N., and Ferziger, J. H.: Parameterization of turbulent fluxes and scales using homogeneous sheared stably stratified turbulence simulations, J. Fluid Mech., 525, 193–214, 2005. 14301
Siedler, G., Zangenberg, N., and Onken, R.: Seasonal changes in the tropical Atlantic circula-tion: observation and simulation of the guinea dome, J. Geophys. Res., 97, 703–715, 1992. 30