ABSTRACT: The interannual variability of precipitation in El Niño/Southern Oscillation-neutral years was studied for the Centro de Lançamento de Alcântara region. Monthly precipitation, sea surface temperature, wind at 925 hPa and outgoing longwave radiation data from various gridded datasets for the 1951–2010 period (60 years) were used. The data grouping was based on terciles. For the Centro de Lançamento de Alcântara in El Niño/Southern Oscillation-neutral years, March is the month of the rainy quarter (March to May) when the interhemispheric gradient of the sea surface temperature anomalies over the Atlantic (GRAD) and the atmospheric circulation at 925 hPa over the Centro de Lançamento de Alcântara were able to best explain the variability of precipitation. In this month, the wind direction at 925 hPa was the factor that explained the highest fraction of precipitation variance (40%), followed by GRAD (30%) and the wind magnitude (20%). For the Centro de Lançamento de Alcântara, in general, above-average precipitation was related to weak north-northeasterly low-level winds and southward GRAD, while below-average precipitation was related to strong east-northeasterly low-level winds and northward GRAD. These features were related to an eastward expansion of the Amazon convection towards the northern Northeast Brazil and might be related to a slight southward displacement of the Intertropical Convergence Zone in above-average precipitation years.
KEYWORDS: Precipitation anomaly, Low-level wind direction, Meridional dipole.
Interannual Variability of Precipitation for
the Centro de Lançamento de Alcântara
in ENSO-Neutral Years
Rosa de Fátima Cruz Marques1, Marcos Daisuke Oyama1
INTRODUCTION
he interannual variability of precipitation in the northern Northeast Brazil (NNEB) has been studied extensively over the last decades. Since sea surface temperature anomalies (SSTAs) play a key role in the climatic predictability of tropical regions (Shukla 1998), numerous papers have focused on the relation between the precipitation variability in the NNEB and the SSTAs in the tropical Paciic and Atlantic oceans (review in Kayano and Andreoli 2009). For the tropical Paciic, the inluence would occur through the El Niño/Southern Oscillation (ENSO) phenomenon; for the tropical Atlantic, through the interhemispheric SSTA gradient (GRAD).
he main features of ENSO are SSTAs in the central and eastern equatorial Paciic linked to the Southern Oscillation, which is aneast-west seesaw pattern in surface pressure over the tropical Paciic (Trenberth and Hoar 1996; Kane 1997). In the ENSO-warm (cold) phase, also called El Niño (La Niña), positive (negative) SSTAs are found in the central and eastern equatorial Paciic. he general relation between the ENSO phases and the precipitation variability in the NNEB — warm (cold) phase associated to below- (above-) average precipitation — is well known (e.g. Ropelewski and Halpert 1987).
In the ENSO-neutral phase, i.e. without the occurrence of El Niño or La Niña, the ascending (descending) branch of the Walker cell is located over the warmer (colder) surface waters in western (eastern) tropical Paciic. hese two branches are connected by easterly trade winds over the tropical Paciic. Cold waters from the ocean upwelling along the west coast of South America spread westward towards central Paciic. In the
1.Departamento de Ciência e Tecnologia Aeroespacial – Instituto de Aeronáutica e Espaço – Divisão de Ciências Atmosféricas – São José dos Campos/SP – Brazil.
Author for correspondence: Rosa de Fátima Cruz Marques | Instituto de Aeronáutica e Espaço/Divisão de Ciências Atmosféricas | Praça Mal. Eduardo Gomes, 50 Vila das Acácias | CEP: 12.228-904 – São José dos Campos/SP – Brazil | Email: [email protected]
ENSO-warm (cold) phase, there is weakening (intensiication) of the trade winds and the coastal upwelling, leading to positive (negative) SSTAs in eastern Paciic and to an anomalous ascending (descending) motion over this region, which is partially balanced by an anomalous descending (ascending) motion over the NNEB. Since anomalous descending (ascending) motion means less (more) favorable conditions to deep convection, precipitation over the NNEB decreases (increases). hese processes explain how the ENSO phases could inluence the precipitation in the NNEB. However, in general, this inluence is clearer only for the more intense El Niño and La Niña events (Kane 1997; Andreoli et al. 2004; Lucena et al. 2011; Marques and Fortes 2012).
For the tropical Atlantic, numerical simulations (Moura and Shukla 1981) and observational analysis (Hastenrath and Heller 1977; Nobre and Shukla 1996) indicated that precipitation anomalies in the NNEB would be associated with a meridional dipole of SSTAs, called the Atlantic dipole. It was regarded as an ocean-atmosphere coupled mode of variability on decadal timescales (Chang et al. 1997), and it would afect the precipitation in NNEB through anomalies in the position and intensity of the Intertropical Convergence Zone (ITCZ). he concept of Atlantic dipole evolved to the GRAD (Enield et al. 1999; Andreoli et al. 2004). During the NNEB rainy season, a southward GRAD — due to positive SSTAs in the tropical South Atlantic and/or negative in the tropical North Atlantic — would be related to lower (higher) surface pressure in the tropical South Atlantic (North Atlantic), weaker (stronger) southeast (northeast) trade winds, southward displacement of the trade winds conluence axis and above average precipitation in the NNEB. For a northward GRAD, the opposite features would occur, ending up with below-average precipitation in the NNEB.
Due to the importance of both tropical oceans, numerous papers have focused on the interaction between ENSO and the variability in tropical Atlantic (Saravanan and Chang 2000; Andreoli and Kayano 2007; Münnich and Neelin 2005; Giannini et al. 2004). his interaction does exist, but there is also considerable independence between them, which justiies considering the ENSO phases (warm/cold) and the GRAD direction (northward/southward) as distinct variables related to the precipitation anomalies in the NNEB. Which one is more important? Although higher correlation is found between the precipitation anomalies and the GRAD direction (Moura et al. 2009), Andreoli and Kayano (2007) point out that the ENSO phase and the GRAD direction act to reinforce or inhibit the precipitation anomalies (e.g. for El Niño conditions, northward
GRAD would intensify the negative precipitation anomalies in the NNEB rainy season).
In the present study, we focus on the variability of precipitation for a speciic region in the NNEB: the Centro de Lançamento de Alcântara (CLA) region, located at the northern coast of Brazil. From the CLA, the space vehicles developed at the Instituto de Aeronáutica e Espaço, such as sounding rockets (VS-30, VS-40, VSB-30, among others) and the satellite launch vehicle (VLS), are launched. Since these space vehicles are not designed to withstand adverse meteorological conditions, such as rain and/or lightning occurrence, the knowledge of the interannual variability of precipitation is important for the planning of rocket launching missions (Marques and Fisch 2005).
In the CLA, the rainy season extends from February to mid-June, when the ITCZ reaches its southernmost position and the rainiest months are March and April, when precipitation is on average higher than 300 mm/month (Marques and Baungartner 2008). he rainy season features — onset and demise day, as well as total precipitation amount — show a pronounced interannual variability. Previous studies suggest that this variability would be related to oceanic factors, such as the ENSO phases and the GRAD direction, and to dynamical factors, such as the meridional position of the Atlantic ITCZ and the low-level circulation over the CLA. For instance, Pinheiro and Oyama (2013) showed that anomalies in the rainy season onset, for speciic years, would be related to the ENSO phase, GRAD direction and meridional position of the Atlantic ITCZ. Marques and Fortes (2012) showed that the relation between ENSO-warm (cold) phase and below- (above-) average precipitation in the CLA would hold only in intense El Niño or La Niña events occurring in the rainiest months.
In ENSO-neutral years, preliminary studies indicate that the variability of precipitation in the CLA, comparing contrasting years (few above- and below-average years), would depend on the combined action of GRAD direction and meridional position of the Atlantic ITCZ (Marques et al. 2013; Pereira and Marques 2014). Marques and Correa (2014) showed that, independently from the GRAD direction, the low-level circulation over the CLA is related to the precipitation anomalies: weak (strong) northeasterly (easterly) winds would favor (inhibit) precipitation occurrence.
Variable Dataset Reference Grid spacing Temporal coverage
Period used here
Precipitation GPCC/V6 Schneider et al. (2014) 0.5° x 0.5° 1901–2010 1951–2010 Sea surface
temperature
NOAA Extended
Reconstructed SST/V3b Smith et al. (2008) 2° x 2° 1854–present 1951–2010
Wind at 925 hPa NCEP/NCAR Reanalysis Kalnay et al. (1996);
Kistler et al. (2001) 2.5° x 2.5° 1948–present 1951–2010
OLR NOAA Interpolated OLR Liebmann (1996) 2.5° x 2.5° June–1974 to
December–2013 1975–2010
Table 1. Brief description of the datasets used in this study.
Year
P
re
ci
p
ita
ti
o
n (mm)
1800
1200
1979 1985 1991 1997 2003 2009 GPCC CPC
600
0
not considered, because it is largely explained by the variability of the GRAD direction (Carvalho 2011). Diferently from the previous studies (Marques et al. 2013; Pereira and Marques 2014; Marques and Correa 2014), the present study uses longer datasets as well as standardizes the method to classify the anomalies and obtain more comprehensive and detailed results.
DATA AND METHODOLOGY
DATAMonthly precipitation, sea surface temperature, wind at 925 hPa and outgoing longwave radiation (OLR) data from various gridded datasets (Table 1) were used. he datasets were provided by Earth System Research Laboratory/National Oceanic and Atmospheric Administration (ESRL/NOAA):
• For the wind data, the 925 hPa level is used because it is a mandatory level representative of the lowest atmospheric layer.
• For the CLA, time series of precipitation and wind at 925 hPa are obtained from the gridded data. Precipitation values are computed as the area average over the four grid points that surround the CLA (Pinheiro and Oyama 2013), whereas wind values refer to the (45°W; 2.5°S) grid-point values. he computing procedures are not the same because the precipitation and wind data are given on diferent grids (Table 1), and the idea is to locate the CLA approximately at the center of the area for which the data is representative. • he SSTAs are obtained considering 1951–2010 as
the base period. he Niño 3 index is computed as the average SSTA over the 150°W–90°W; 6°S–6°N area. GRAD is deined as TNA minus TSA, where TNA (tropical North Atlantic) is the average SSTA over the 60°W–20°W; Equator–20°N area and TSA (tropical South Atlantic), over the 30°W–10°E; 20°S–Equator
area. Northward (southward) GRAD refers to positive (negative) diference. he deinition of the indices follows Andreoli and Kayano (2007).
The precipitation data from the Global Precipitation Climatology Centre (GPCC) have been used in climate studies (Schneider et al. 2014) and also in studies focusing on the South America precipitation variability (Kayano et al. 2011). For the CLA, GPCC data are compared to the Climate Prediction Center (CPC)/NOAA data, which were used by Pinheiro and Oyama (2013) to obtain the rainy season features for the CLA. For the total precipitation in the rainy quarter (March, April and May), there is close agreement between the time series in the 1979–2010 period, which is the common period for both datasets
(Fig. 1). The differences are small (< 10%), except in few speciic
years (e.g. 1991 and 2007), and the linear correlation between
the two datasets is high (Pearson correlation coeficient @ 0.97). Therefore, the use of GPCC data for the CLA is appropriate.
Figure 1. Accumulated precipitation over the CLA for the rainy quarter (March to May) from 1979 to 2010. Values obtained from the GPCC dataset (black line); and from the CPC/NOAA dataset (green line).
METHODOLOGY
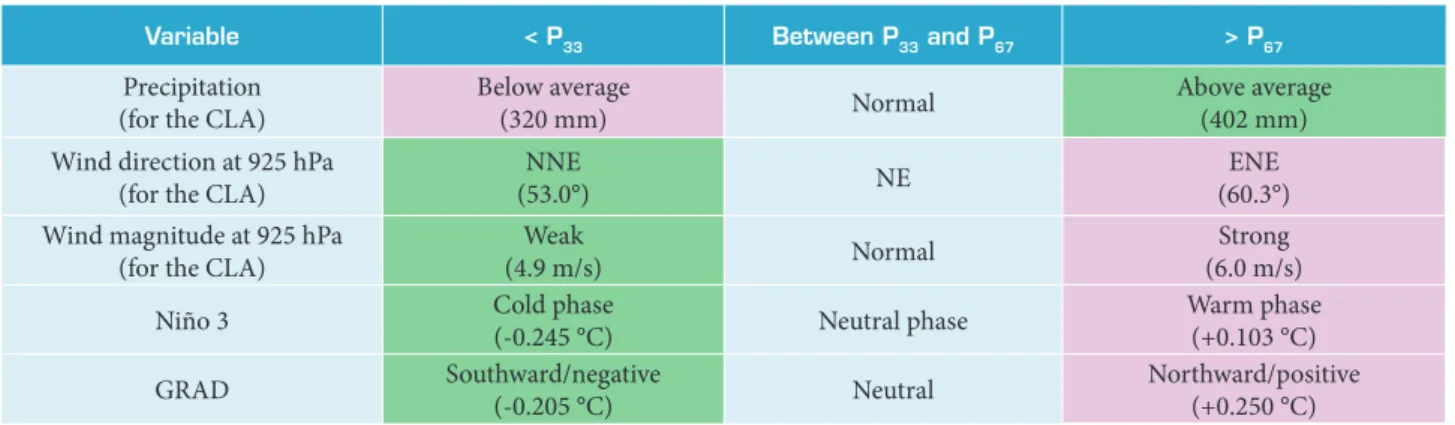
March, considering the data in ascending order, the irst (P33) and second terciles of precipitation (P67) are 320 and 402 mm, respectively (Table 2). hen, the 60-years data (1951–2010) are grouped in 3 categories:
• 20 years when precipitation is lower than P33 (below-average years).
• 20 years when precipitation is higher than P33 and lower than P67 (normal years).
• 20 years when precipitation is higher than P67 (above-average years).
Table 2 shows the terciles and categories for all the variables. From the visual inspection of the results (Table 3), it is possible to ind out the categories related to below- and above-average precipitation categories (pink and green cells in Table 2, respectively).
he procedure of grouping precipitation data using terciles was done by Kayano and Andreoli (2006). Here, the procedure is extended to the all variables to standardize the method to classify the anomalies. For the oceanic indices, the tercile-based procedure may lead to diferences, relative to the literature, in the classiication of the categories (ENSO phase and/or GRAD direction) for a given month:
• For the Niño 3 index, the classiication of the ENSO phases in March from the tercile-based procedure follows a simple rule: warm phase when the index is above +0.10 °C; cold phase, below -0.25 °C (Table 2). This procedure differs from the usual methods to identify the ENSO phases. For instance, Kayano and Andreoli (2006) used the Niño 3 index to identify the ENSO phases following the criterion proposed by Trenberth (1997): warm phase when the detrended and smoothed (5-month running mean) values remain,
for at least 6 consecutive months, above +0.5 °C; cold phase, below -0.5 °C. he tercile-based procedure has the advantage of not including the short warm/cold periods (< 6 consecutive months) in the neutral phase category, but has the limitation of not distinguishing between the intraseasonal and interannual variabilities. • For GRAD, the thresholds adopted here for March
(-0.21 °C and +0.25 °C; Table 2) are close to those used by Andreoli and Kayano (2007) for the December to February quarter (± 0.20 °C).
• he diferences may also result from the use of distinct base periods.
Composites of SSTA, circulation at 925 hPa and OLR for below- and above-average precipitation years in the ENSO-neutral phase (Table 3) are obtained. For a given variable, the statistical signiicance of the composite diferences is evaluated by applying the Student’s t-test. he conidence level is 90%. For the wind, the statistical signiicance is evaluated for the components (zonal and meridional wind) separately.
Given two variables, y and x, the coeicient of determination (R2) measures the maximum fraction of the variance of y which
could be explained by a linear model in x (y = ax + b, a and b
constants) (Costa Neto 1977). Here, R2 is used to single out the
factors (among wind direction, wind magnitude and GRAD) that would be more important to explain the variability of precipitation in the CLA for the ENSO-neutral phase.
RESULTS AND DISCUSSION
Before focusing on the ENSO-neutral phase, the general relation between the ENSO phases and the variability of
Variable < P33 Between P33 and P67 > P67
Precipitation (for the CLA)
Below average
(320 mm) Normal
Above average (402 mm) Wind direction at 925 hPa
(for the CLA)
NNE
(53.0°) NE
ENE (60.3°) Wind magnitude at 925 hPa
(for the CLA)
Weak
(4.9 m/s) Normal
Strong (6.0 m/s)
Niño 3 Cold phase
(-0.245 °C) Neutral phase
Warm phase (+0.103 °C)
GRAD Southward/negative
(-0.205 °C) Neutral
Northward/positive (+0.250 °C)
Table 2. Categories for each variable.
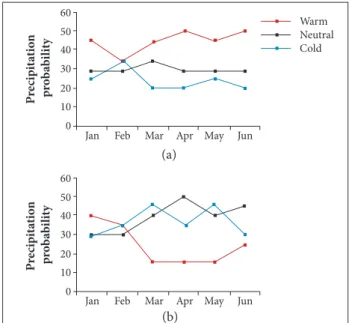
precipitation for the CLA is examined. Figure 2 shows the probability of above or below-average precipitation in the rainy quarter (March to May) for the three ENSO phases.
• he probability of below-average precipitation is lower (20 – 25%) for La Niña years, intermediate (30 – 35%) for ENSO-neutral years and clearly higher (45 – 50%) for El Niño years (Fig. 2a).
• he probability of above-average precipitation is similar for La Niña and ENSO-neutral years (35 – 50%), and clearly lower (15%) for El Niño years (Fig. 2b). herefore, in the rainy quarter, low probability — less than 20% — of below- (above-) average precipitation is found for La Niña (El Niño) years. For the ENSO-neutral years, there is no clear preference for one of the categories (below- or above-average precipitation).
The average and standard deviation of the monthly precipitation are not substantially afected when, instead of using all years to compute the statistics, only the ENSO-neutral years are used (Fig. 3). his is an intriguing result, because by removing one factor of interannual variability (the ENSO phase), a lower variability (i.e. lower standard deviation) would be expected. So, what are the factors that induce (or are related to) the high variability of precipitation for the ENSO-neutral phase?
Year Precipitation for the CLA [mm]
GRAD [°C]
Wind magnitude at 925 hPa for the CLA [m/s]
Wind direction at 925 hPa for the CLA [°]
1951 75 0.60 5.4 60
1990 239 -0.21 5.3 58
1972 254 -0.35 8.1 76
1954 279 0.34 5.2 63
2005 293 0.32 6.1 57
1970 298 0.92 6.9 79
1980 306 0.26 5.5 64
2006 326 -0.07 7.7 61
1982 331 0.12 6.2 51
2007 332 0.29 7.0 76
1965 359 -0.39 4.7 52
1959 392 -0.30 6.0 55
1978 407 0.49 4.8 48
1997 415 0.70 5.0 53
1991 435 -0.57 5.5 41
1988 442 -0.30 3.9 23
1984 453 -0.75 4.5 37
1994 468 -0.66 3.4 26
1963 480 0.01 4.4 54
1986 586 -0.82 5.0 42
Table 3. Monthly values for March in the ENSO-neutral phase.
Cell color refers to the categories shown in Table 2.
Jan Feb Mar Apr May Jun
Jan 0 10 20 30 40 50 60
Feb Mar Apr May Jun
0 10 20 30 40 50 60
Warm Neutral Cold
P
re
cip
it
ati
o
n
pr
o
b
abi
li
ty
P
re
cip
it
ati
o
n
pr
o
b
abi
li
ty
Figure 2. Probability of (a) below- or (b) above-average precipitation from January to June for the three ENSO phases.
As mentioned earlier, the inluence of three factors — GRAD, low-level wind magnitude and direction — is analyzed.
he fraction of precipitation variance explained by each factor (measured by the coeicient of determination, R2) is shown in
Fig. 4. For a given factor, there is considerable variation of the
(a)
fraction over the months, but two general features are noticeable: for all factors, the highest fraction occurs in March, followed by a marked decrease in April. herefore, in the rainy quarter, March is the month when all factors are able to best explain the variability of precipitation. Moreover, another interesting and novel result is that, for March, the low-level wind direction is the factor that explains the highest fraction of precipitation variance (R2 ~ 40%), followed by GRAD (30%) and the wind
magnitude (20%).
he values of precipitation, GRAD, wind magnitude and direction at 925 hPa in March for ENSO-neutral years are shown in Table 3. In general, above-average precipitation (green shaded cells) is related to weak north-northeasterly (NNE) low-level winds and southward (negative) GRAD; below-average precipitation (pink shaded cells), to strong east-northeasterly (ENE) low-level winds and northward (positive) GRAD. Exceptions to this general relationship do occur. For instance, in 1972 (1978), below- (above-) average precipitation occurs, but GRAD is southward (northward), and the precipitation anomaly sign is consistent only with the wind magnitude and direction anomalies. Next, the composites (average ields) of SSTA, circulation at 925 hPa and OLR in March for below- and above-average precipitation
years in the ENSO-neutral phase are shown to provide a broader view of the general relationship obtained for the CLA.
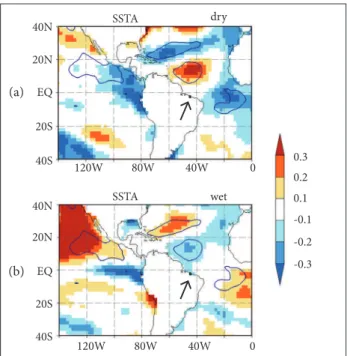
he composites of SSTA are shown in Fig. 5. A clear statistically signiicant dipole pattern between TNA and TSA is found in both composites, showing the usefulness of the meridional dipole concept (Moura and Shukla 1981) for the purposes of the present study. When precipitation is above (below) the average, TNA is negative (positive) and TSA, positive (negative); therefore, GRAD is southward (northward). his result is consistent with the literature (Giannini
et al. 2004; Kayano and Andreoli 2006; Andreoli and Kayano 2007). In both composites, however, substantial negative SSTAs are found in the Niño 1+2 region, close to the west coast of equatorial South America. It means that the ENSO-neutral phase, defined here considering the Niño 3 index, could be including numerous cases of La Niña onset, and it could also explain the smaller diferences between the ENSO-neutral and cold phases in Fig. 2 (particularly for the probability of above-average precipitation).
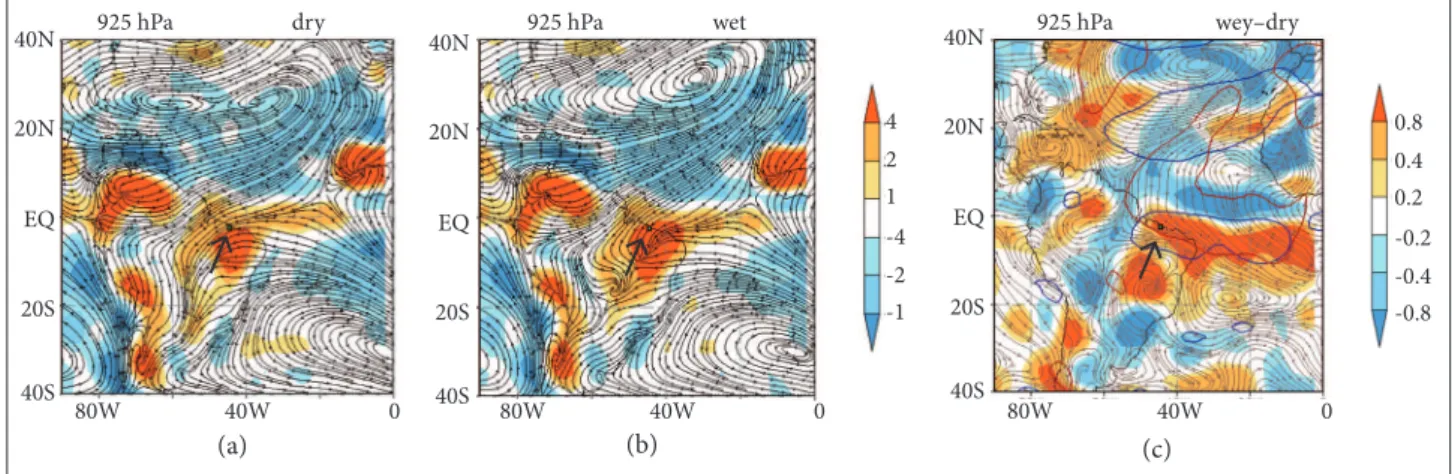
he composites of atmospheric circulation at 925 hPa are shown in Fig. 6. he large-scale circulation shows an easterly ITCZ-related conluence zone located between the north and south subtropical highs that turns counter-clockwise and becomes northeasterly when crossing the NNEB coast.
Figure 4. Fraction of precipitation variance explained by each factor: direction (GRAD), wind magnitude (MAG) and direction (DIR) at 925 hPa — from January to June in the ENSO-neutral phase.
Figure 3. Average (AVG, solid line) and standard deviation (STD, dashed line) of the monthly precipitation (mm) from January to June. For a given month, the AVG and STD were computed using all the 60 values (from 1951 to 2010; green) or only the 20 values for the ENSO-neutral phase (black).
500
400
300
200
100
AVG (all)
STD (all) STD (neutral) AVG (neutral)
0
Jan Feb Mar Apr May Jun
P
re
ci
p
ita
ti
o
n (mm)
40
30
20
10
DIR
MAG GRAD
0
Jan Feb Mar Apr May Jun
P
re
ci
p
ita
ti
o
n va
ri
anc
e
SSTA
SSTA wet
dry
80W 120W
40N
20N
EQ
20S
40S
40N
20N
EQ
20S
40S
0 40W
80W
120W 40W 0
0.3 0.2
0.1
-0.1
-0.2
-0.3
Figure 5. Composites of SSTA (°C) for (a) below- and (b) above-average precipitation years in the ENSO-neutral phase. The SSTA differences between the two panels are statistically signiicant at the 90% conidence level within the areas enclosed by the thick blue contours. The CLA location is indicated by the small box at the northern coast of Brazil.
(a)
80W 40W 0
OLR dry OLR wet OLR wey–dry
80W 40W 0 80W 40W 0
40N
20N
EQ
20S
40S
40N
20N
EQ
20S
40S
40N
20N
EQ
20S
40S 275 260 245 230 215 200
20 10 5
-5 -10 -20
80W 40W 0
925 hPa dry 925 hPa wet 925 hPa wey–dry
80W 40W 0 80W 40W 0
40N
20N
EQ
20S
40S
40N
20N
EQ
20S
40S
40N
20N
EQ
20S
40S 4 2 1 -4 -2 -1
0.8 0.4 0.2 -0.2 -0.4 -0.8 Over the NNEB, for the below-average years, there is smooth
confluence of the streamlines towards the central South America (Fig. 6a), and ENE winds are found over the CLA; for the above-average years, the counter-clockwise turning of the atmospheric l ow is increased, the streamlines converge (Fig. 6b) and NNE winds are found over the CLA. These circulation dif erences are statistically signii cant (for both wind components, zonal and meridional) over the NNEB coast. h e additional counter-clockwise turning of the wind direction over the CLA for above-average precipitation years is related to the pronounced convergence anomaly that comes out over the NNEB (Fig. 6c). h is convergence anomaly extends zonally towards the Atlantic, and divergence anomaly is found immediately to the north of it; this dipole pattern
Figure 6. Composites of circulation at 925 hPa for (a) below- and (b) above-average precipitation years, as well as the
difference between them (c), in the ENSO-neutral phase. Shading refers to atmospheric convergence (10-6/s). The zonal and
meridional wind differences are statistically signii cant at the 90% coni dence level within the areas enclosed by the thick blue and red contours, respectively (c). The CLA location is indicated by the small box at the northern coast of Brazil.
suggests that the ITCZ is slightly displaced to the south in above-average precipitation years, which is consistent with the more intense north Atlantic subtropical high and also to the dipole pattern related to the southward GRAD (negative SSTAs over TNA, and positive over TSA; Fig. 5b).
h e composites of OLR are shown in Fig. 7. Deep convection is found over South America and the ITCZ, while dry zones are found over the subtropical highs. h e convergence anomaly over the NNEB for the above-average years is related to the eastward expansion of the Amazon convection towards the NNEB (Figs. 7a and 7b), leading to a large statistically signii cant negative OLR anomaly over the NNEB (Fig. 7c). h e slight southward displacement of the ITCZ, suggested by the convergence/ divergence anomalies at 925 hPa (Fig. 6c) and the southward
Figure 7. Composites of OLR (W/m2) for (a) below- and (b) above-average precipitation years, as well as the difference between
them (c), in the ENSO-neutral phase. The OLR differences are statistically signii cant at the 90% coni dence level within the areas enclosed by the thick blue contours. The CLA location is indicated by the small box at the northern coast of Brazil.
(a) (a)
(b) (b)
Observed precipitation (mm)
E
st
ima
te
d
p
re
ci
p
ita
ti
o
n (mm)
100 100 300 500 700
300 500 700 900
GRAD (Fig. 5b), is also consistent with the symmetric dipole pattern of the OLR anomalies over the equatorial Atlantic (although this pattern lacks statistical signiicance). he OLR diference ield also shows a statistically signiicant reduction in deep convection over the northwestern and southern South America.
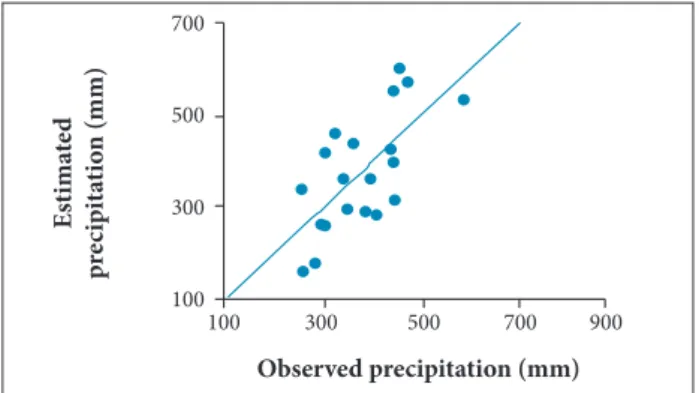
Regarding the predictability, considering GRAD and wind direction at 925 hPa in February as predictors of the precipitation in March, the use of linear multiple regression leads to R2 ~ 46% (adjusted R2 ~ 40%; Fig. 8). This is a
preliminary but promising result. Previously, it was showed that R2 for each factor separately at lag-0 ranged from 20 to
40% (Fig. 4). At lag-1, a decrease in R2 would be expected;
however, considering the GRAD and wind direction jointly, about half of the precipitation variance would continue to be explained. herefore, for the ENSO-neutral phase, precipitation in March could be reasonably predicted one month ahead from the GRAD and low-level wind direction in February.
Figure 8. Comparison between the estimated and observed precipitation in March for the ENSO-neutral phase.
only these neutral years, the interannual variability is pronounced (and close to the total variability). In the rainy quarter (March to May), March is the month when GRAD direction and low-level circulation are able to best explain the variability of precipitation. In this month, the wind direction at 925 hPa is the factor that explains the highest fraction of precipitation variance (40%), followed by GRAD (30%) and the wind magnitude (20%). For the CLA, in general, above average precipitation is related to weak NNE low-level winds and southward (negative) GRAD; below-average precipitation, to strong ENE low-level winds and northward (positive) GRAD.
The circulation at 925 hPa in March shows a northeasterly atmospheric flow crossing the NNEB coast from the equatorial Atlantic. For the below-average years, there is smooth confluence of the streamlines from the NNEB towards the central South America, and ENE winds are found over the CLA. For the above-average years, the streamlines turn counter-clockwise and converge over the NNEB, leading to NNE winds over the CLA. These circulation differences are statistically significant over the NNEB coast. The convergence anomaly over the NNEB is related to the eastward expansion of the Amazon convection, and this expansion explains the occurrence of above-average precipitation over the CLA. This is also explained, on the other hand, by the formation of a statistically significant meridional dipole pattern of negative (positive) SSTAs in TNA (TSA), which might be related to a slight southward displacement of the ITCZ. This integrated picture expands and synthesizes the results of previous studies (Marques et al. 2013; Pereira and Marques 2014; Marques and Correa 2014) and shows how the dynamical and oceanic factors shape the variability of precipitation in ENSO-neutral years. Moreover, for these neutral years, a preliminary but promising result showed that precipitation in March could be reasonably predicted one month ahead from the GRAD and low-level wind direction in February.
Andreoli RV, Kayano M (2007) A importância relativa do Atlântico Tropical Sul e Pacíico Leste na variabilidade de precipitação do Nordeste do Brasil. Rev Bras Meteorol 22(1):63-74.
Andreoli RV, Kayano MT, Guedes RL, Oyama MD, Alves MAS (2004) A inluência da temperatura da superfície do mar dos oceanos Pacíico e Atlântico na variabilidade de precipitação em Fortaleza. Rev Bras Meteorol 19(2):113-122.
REFERENCES
Carvalho MAV (2011) Variabilidade da largura e intensidade da Zona de Convergência Intertropical Atlântica: aspectos observacionais e de modelagem. (Master’s thesis). São José dos Campos: Instituto Nacional de Pesquisas Espaciais.
Chang P, Ji L, Li H (1997) A decadal climate variation in the tropical Atlantic Ocean from thermodynamic air-sea interactions. Nature 385(6):516-518. doi: 10.1038/385516a0
CONCLUSION
Costa Neto PLO (1977) Estatística. São Paulo: Edgard Blücher.
Enield DB, Mestas-Nuñez AM, Mayer DA, Cid-Serrano L (1999) How ubiquitous is the dipole relationship in tropical Atlantic sea surface temperature? J Geophys Res 104(C4):7841-7848. doi: 10.1029/1998JC900109
Giannini A, Saravanan R, Chang P (2004) The preconditioning role of tropical Atlantic variability in the development of the ENSO teleconnection: implications for the prediction of Nordeste rainfall. Clim Dynam 22(8):839-855. doi: 10.1007/s00382-004-0420-2
Hastenrath S, Heller L (1977) Dynamics of climatic hazards in northeast Brazil. Q J Roy Meteor Soc 103(435):77-92. doi: 10.1002/qj.49710343505
Kalnay E, Kanamitsu M, Kistler R, Collins W, Deaven D, Gandin L, Iredell M, Saha S, White G, Woollen J, Zhu Y, Leetmaa A, Reynolds R, Chelliah M, Ebisuzaki W, Higgins W, Janowiak J, Mo KC, Ropelewski C, Wang J, Jenne R, Joseph D (1996) The NCEP/NCAR 40-Year Reanalysis Project. Bull Amer Meteor Soc 77(3):437-471. doi: 10.1175/1520-0477(1996)077<0437:TNYRP>2.0.CO;2
Kane RP (1997) Prediction of droughts in north-east Brazil: Role of ENSO and use of periodicities. Int J Climatol 17(6):655-665. doi: 10.1002/(SICI)1097-0088(199705)17:6<655::AID-JOC144>3.0.CO;2-1
Kayano M, Andreoli RV (2006) Relationships between rainfall anomalies over northeastern Brazil and the El Niño-Southern Oscillation. J Geophys Res 111(D13): doi: 10.1029/2005JD006142
Kayano M, Andreoli RV (2009) Clima da Região Nordeste do Brasil. In: Cavalcanti IFA, Ferreira NJ, Justi da Silva MGA, Silva Dias MAF, editors. Tempo e clima no Brasil. São Paulo: Oicina de Textos. p. 213-233.
Kayano M, Andreoli RV, Souza R (2011) Evolving anomalous SST patterns leading to ENSO extremes: relations between the tropical Paciic and Atlantic Oceans and the inluence on the South American rainfall. Int J Climatol 31(8):1119-1134. doi: 10.1002/joc.2135
Kistler R, Kalnay E, Collins W, Saha S, White G, Woollen J, Chelliah M, Ebisuzaki W, Kanamitsu M, Kousky V, van den Dool H, Jenne R, Fiorino M (2001) The NCEP-NCAR 50-year reanalysis: monthly means CD-ROM and documentation. B Am Meteorol Soc 82(2):247-267. doi: 10.1175/1520-0477(2001)082<0247:TNNYRM>2.3.CO;2
Liebmann B (1996) Description of a complete (interpolated) outgoing longwave radiation dataset. Bull Am Meteorol Soc 77(6):1275-1277.
Lucena DB, Gomes Filho MF, Servain J (2011) Avaliação do impacto de ventos climáticos extremos nos oceanos Pacíico e Atlântico sobre a estação chuvosa no Nordeste do Brasil. Rev Bras Meteorol 26(2):297-312. doi: 10.1590/S0102-77862011000200013
Marques RC, Alves MA, Oyama MD (2013) Variabilidade interanual da precipitação no Centro de Lançamento de Alcântara em anos neutros no Pacíico. Proceedings of the V Simpósio Internacional de Climatologia, Florianópolis, Brazil.
Marques RC, Baungartner C (2008) Estudos das variáveis meteorológicas associadas a posição da ZCIT do Atlântico, durante a estação chuvosa no Centro de Lançamento de Alcântara (CLA). Proceedings of the XV Congresso Brasileiro de Meteorologia; São Paulo, Brazil.
Marques RC, Correa FN (2014) A relação do vento com as chuvas no Centro de Lançamento de Alcântara, em anos de El Niño, La Niña e
Neutro. Proceedings of the XVIII Congresso Brasileiro de Meteorologia; Recife, Brazil.
Marques RC, Fisch GF (2005) As atividades de Meteorologia Aeroespacial no Centro Técnico Aeroespacial (CTA). Bol Soc Bras Meteorol 29(3):21-26.
Marques RC, Fortes MA (2012) Estudo da variabilidade interanual da precipitação no Centro de Lançamento de Alcântara (CLA). Proceedings of the XVII Congresso Brasileiro de Meteorologia; Gramado, Brazil.
Moura AD, Shukla J (1981) On the dynamics of droughts in Northeast Brazil: observations, theory, and numerical experiments with a general circulation model. J Atmos Sci 38(12):2653-2675. doi: 10.1175/1520-0469(1981)038<2653:OTDODI>2.0.CO;2
Moura GBA, Aragão JOR, Melo JSP, Silva APN, Giongo PR, Lacerda FF (2009) Relationship between the rainfall of the eastern Northeast of Brazil and ocean temperature. Rev Bras Eng Agríc Ambient 13(4):462-469. doi: 10.1590/S1415-43662009000400014
Münnich M, Neelin JD (2005) Seasonal inluence of ENSO on the Atlantic ITCZ and equatorial South America. Geophys Res Lett 32(21):1-4. doi: 10.1029/2005GL023900
Nobre P, Shukla J (1996) Variations of sea surface temperature, wind stress, and rainfall over the tropical Atlantic and South American. J Climate 9(10):2464-2479. doi: 10.1175/1520-0442(1996)009<2464:VOSSTW>2.0.CO;2
Pereira RA, Marques RC (2014) Inluência do Atlântico Tropical na precipitação do CLA em anos neutros no Pacíico. Proceedings of the XVIII Congresso Brasileiro de Meteorologia; Recife, Brazil.
Pinheiro UA, Oyama MD (2013) Rainy season features for the Alcântara Launch Center. J Aerosp Technol Manag 5(4):439-448. doi: 10.5028/jatm.v5i4.266
Ropelewski C, Halpert M (1987) Global and regional scale precipitation patterns associated with the El Niño/Southern Oscillation. Mon Weather Rev 115(8):1606-1626. doi: 10.1175/1520-0493(1987)115<1606:GARSPP>2.0.CO;2
Saravanan R, Chang P (2000) Interaction between Tropical Atlantic variability and El Niño-Southern Oscillation. J Climate 13(13):2177-2194. doi: 10.1175/1520-0442(2000)013<2177:IBTAVA>2.0.CO;2
Schneider U, Becker A, Finger P, Meyer-Christoffer A, Ziese M, Rudolf B (2014) GPCC’s new land surface precipitation climatology based on quality-controlled in situ data and its role in quantifying the global water cycle. Theor Appl Climatol 115(1-2):15-40. doi: 10.1007/s00704-013-0860-x
Shukla J (1998) Predictability in the midst of chaos: a scientiic basis for climate forecasting. Science 282(5389):728-731. doi: 10.1126/ science.282.5389.728
Smith TM, Reynolds RW, Peterson TC, Lawrimore J (2008) Improvements to NOAA’s Historical Merged Land-Ocean Surface Temperature Analysis (1880–2006). J Climate 21(10):2283-2296. doi: 10.1175/2007JCLI2100.1
Trenberth KE (1997) The deinition of El Niño. Bull Amer Meteor Soc 78(12):2771-2777. doi: 0.1175/1520-0477(1997)078<2771: TDOENO>2.0.CO;2