Visual maps in the adult primate
cerebral cortex: some implications
for brain development and evolution
Department of Physiology, Monash University, Victoria, Australia M.G.P. Rosa
Abstract
In this paper, the topology of cortical visuotopic maps in adult primates is reviewed, with emphasis on recent studies. The observed visuotopic organisation can be summarised with reference to two basic rules. First, adjacent radial columns in the cortex represent partially overlapping regions of the visual field, irrespective of whether these columns are part of the same or different cortical areas. This primary rule is seldom, if ever, violated. Second, adjacent regions of the visual field tend to be represented in adjacent radial columns of a same area. This rule is not as rigid as the first, as many cortical areas form discontinuous, second-order representations of the visual field. A developmental model based on these physiological observations, and on comparative studies of cortical organisation, is then proposed, in order to explain how a combination of molecular specification steps and activity-driven processes can generate the variety of visuotopic organisations observed in adult cortex.
Correspondence
M.G.P. Rosa
Department of Physiology Monash University Victoria 3800 Australia
Fax: +61-3-9905-2547 E-mail:
Presented at the IV International UNESCO Course on “What the Developing Cerebral Cortex Tells About the Adult Cortex (and Vice Versa)”, Rio de Janeiro, RJ, Brazil, December 3-7, 2001.
Research supported by the Australian Research Council and the National Health and Medical Research Council.
Received July 12, 2002 Accepted September 17, 2002
Key words
·Primate ·Vision
·Receptive fields ·Cortical areas ·Development ·Specification
Introduction
In mammals, the anatomical connections subserving vision are characterised by pre-cise patterns of origins and terminations. This anatomical specificity is such that infor-mation coming from topographically corre-sponding points of the two retinae converges onto single cells in the primary visual area (V1), and cells in adjacent regions of the same retina project to adjacent points of V1. As a result, cells in adjacent V1 columns always have receptive fields that represent slightly different, but overlapping portions of the visual field (1). This orderly relation-ship creates a visuotopic map, whereby V1 neurones on one side of the brain
collec-tively represent the entire contralateral half of the visual field in a gradual and predict-able fashion (2,3).
extrastriate areas described by the pioneer-ing mapppioneer-ing studies in monkeys, only two have become universally accepted: the sec-ond (V2), and middle temporal (MT) areas. Other cortical fields that were initially de-scribed as forming equally well-organised visuotopic maps have since been further sub-divided, or had parts recombined with adja-cent cortex to form new areas, which con-tinue to be the subject of much controversy (6,7). This uncertainty reflects not only the conflicting views of researchers regarding what constitutes a cortical area, but also the development of our understanding of cortical areas. We are now aware of more subtle and complex types of organisation than originally envisaged, which translate into important caveats that must be consid-ered when one interprets the way in which visuotopic maps relate to cortical areas. In this paper I will review some characteristics of cortical visuotopic maps in adults, and the implications that they may have for our un-derstanding of the development and evolu-tion of the cerebral cortex.
The numerous interactions between ex-citatory and inhibitory cells at each stage of visual processing result in cortical maps which depart in several ways from being precise point-to-point replicates of the sen-sory receptor surface. First, cortical maps are probabilistic: only the average receptive field position varies as a function of position in the cortex. Moreover, in many cases they include locally repetitive, mosaic-like repre-sentations of the same points of the visual field in adjacent columns, by cells with dif-ferent response properties and connections. Thus, even the smallest stimulus in the vi-sual field will evoke a response from an intricately shaped cluster of thousands of cortical cells distributed over a mean posi-tion. Second, cortical maps do not simply reflect the receptor densities at the periphery, and visuotopic maps can emphasise differ-ent parts of the visual field to differdiffer-ent ex-tents. For example, the central visual field is
even more highly magnified in V1 than would be expected on the basis of ganglion cell densities alone (8); this emphasis on foveal representation can be more or less marked in different areas (9,10). Finally, as detailed in the following section, the maps found in different cortical areas represent the con-tralateral visual hemifield according to dif-ferent topological rules.
Categories of visuotopic maps
(Figure 1B), where the upper and lower quad-rants of the contralateral hemifield are repre-sented in separate locations, being connected only by a small bridge corresponding to the foveal representation (4,13). As a result, al-though the representations of the upper and lower contralateral quadrants in V2 are in-ternally continuous (e.g., points a and b, or c and d ), the representations of points above or below the horizontal meridian1 are non-adjacent in the cortex (points b and c).
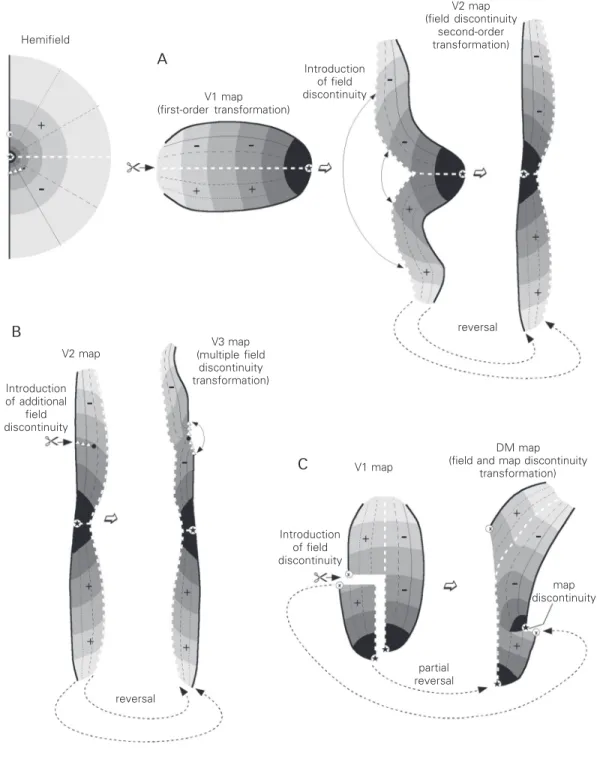
The map in V2 illustrates a type of sec-ond-order representation known as a field discontinuity map. These maps are organised as though a discontinuity had been intro-duced in the visual field or retina. The topol-ogy of this type of map can be considered by imagining that a first-order transformation has been cut along a line, such as the repre-sentation of the horizontal meridian, and physically parted (Figure 2). In the simian primates which have been studied to date, the line of field discontinuity in the V2 map corresponds to the horizontal meridian (4,9, 14,15). However, this is not necessarily the case, and in other animals, including prosimians, field discontinuities correspond-ing to different parts of the visual field have been reported (16,17). It was initially sug-gested that second-order transformations in-cluding a single field discontinuity (usually coinciding with the representation of the horizontal meridian) were common in pri-mate extrastriate cortex (e.g., 5,18-20). How-ever, it is now evident that extrastriate visuotopic maps can display more topologi-cal complexity than is apparent in V2, as well as more intra- and inter-specific vari-ability. This complexity is expressed in at least two ways: multiple field discontinuities can exist in the same visuotopic map, and these may also be combined with another
Figure 1. Visuotopic organisation of areas V1 and V2. A, Medial and lateral views of the right cerebral hemisphere of a marmoset monkey, indicating the locations of V1 and V2. In the medial view (top left) the banks of the calcarine sulcus have been separated to reveal portions of these areas. The star indicates the representation of the centre of the foveola, and isoeccentricity contours are indicated by fine dotted lines. The topological relationship between V1 and V2 on the medial and lateral surfaces is indicated by the arrows. B, A schematic unfolded representation of V1 and V2 indicating the locations of the representa-tions of different parts of the visual field. In this diagram, different visual field locarepresenta-tions are indicated by different grey shades and symbols, which are summarised in a schematic view of the animal’s contralateral hemifield (C). The representation of the central 1º of the visual field is indicated in black, and progressively more eccentric parts of the visual field in gradually lighter shades of grey. Representations of the vertical meridian are outlined by the black squares, representations of the horizontal meridian by white circles, and those of the temporal perimeter of the visual field by dashed lines. The “+” and “-” signs indicate representations of the upper and lower contralateral quadrant, respectively. C, Schematic representation of the animal’s left hemifield, with four points located along an isoeccentric arc (a-d) indicated. Note that while the representation of this arc in V1 is continuous (B), in V2 it is not; points above and below the horizontal meridian project to non-adjacent sets of cortical columns in this area. In this and all subsequent figures, the visual hemifield is illustrated from the experimenter’s point of view (see top right of panel C).
1The vertical and horizontal meridians are the axes of reference usually employed in describing visuotopic organisations. The vertical meridian is an imaginary vertical line
through the fixation point, which subdivides the visual field into right and left hemifields. It corresponds to the line of decussation between the left and right hemiretinae. The horizontal meridian is a line perpendicular to the vertical meridian, through the fixation point; it subdivides each hemifield into an upper and a lower quadrant.
type of non-topologically equivalent trans-formation, the map discontinuity.
imme-Figure 2. Different types of visuotopic map can be seen as topological transformations of the V1 map. Top left, Schematic representation of the visual hemifield, illustrating the coding of different visual field parts used in the maps shown in A-C. A, “Simple” field discontinuity maps, such as V2, can be imagined as a result of cutting and physically separating a first-order representation map. B, Visuotopic maps can include secondary field discontinui-ties, such as those observed along the rostral border of primate V3 (circle and triangles). C, More rarely, maps may include map discontinuities, regions where the receptive field coordinates change suddenly. For example, in the dorsomedial (DM) area of marmosets the central and peripheral parts of the upper contralateral hemifield are represented in spatially segregated sectors. This transformation can be imagined as the result of cutting off an entire “island” of cortex, and re-attaching it to the map with a different orientation. As a result, there is a small region along the rostral border of DM where cells with receptive fields in the mid-peripheral region of the upper quadrant adjoin cells with receptive fields in the central lower quadrant (map discontinuity). Note, however, that this transformation preserves the continuity and the centroperipheral axis of the horizontal meridian representation (white dashed line), resulting in a congruent border between DM and V2 (see also Figure 3).
V2 map (field discontinuity
second-order transformation)
Introduction of field discontinuity V1 map
(first-order transformation) Hemifield
V2 map
V3 map (multiple field
discontinuity transformation) Introduction
of additional field discontinuity
Introduction of field discontinuity
DM map (field and map discontinuity
transformation)
map discontinuity V1 map
partial reversal reversal
reversal
A
B
diately anterior to V2 (Figure 3). Based on early anatomical tracing studies, the organi-sation of this area in primates was originally considered to be a reduced mirror-image version of V2, with a continuous representa-tion of the vertical meridian forming its ante-rior boundary (13,20,21). However, subse-quent detailed electrophysiological studies have revealed that several locations along the rostral boundary of V3 represent parts of the visual field away from both the vertical and the horizontal meridians, indicating that the visuotopic map includes multiple field discontinuities (6,22). This type of transfor-mation can be interpreted by imagining that the visuotopic map of V2 (which, as outlined above, already includes a primary field discontinuity) has received further cuts along its perimeter. The outcome of this (Figure 2B) is that the rostral boundary of V3 is formed in part by cells with receptive fields including the vertical meridian, and in part by cells representing other sectors of the visual field. The entire vertical meridian is still represented, but in a discontinuous man-ner, such that the representation is located in two mutually complementary regions of the cortex. This complex topography of V3 has been observed in all three species of monkey that have been extensively studied by means of electrophysiological recordings (6,22,23). Multiple field discontinuities also appear to exist in the middle temporal crescent (MTc; this area includes the V4 transitional re-gion), where the representation of the hori-zontal meridian receives further cuts. Thus, the receptive fields of cells near the outer boundary of this area sometimes represent the horizontal meridian, and sometimes other parts of the visual field (10). Finally, the pattern of secondary field discontinuities may differ significantly between individuals of the same species. Although this has been best documented in carnivores (24-27), sug-gestions of similar variability have arisen in primates (6,22).
In the areas described above, adjacent
cortical columns always represent adjacent or overlapping parts of the visual field. While this is characteristic of the great majority of cortical representations, there are exceptions. For example, a map discontinuity (i.e., an imaginary line separating two adjacent popu-lations of neurones with non-overlapping receptive fields) exists in primary somatosen-sory cortex, at the boundary between the representations of the hand and the face (28). To date, it remains unclear whether cortical map discontinuities correspond to regions of extremely rapid change in recep-tive field position, or true fractures in the representation, where adjacent neurones can have non-overlapping receptive fields.
In primate visual cortex, the only well-documented example of a second-order trans-formation including a map discontinuity is the dorsomedial (DM) area of marmosets (29). The visuotopic organisation of DM includes both a field and a map discontinuity (Figure 2C). As a result of the field disconti-nuity, the representation of the upper quad-rant in this area occupies two non-adjacent regions: a lateral sector, which represents the central visual field, and a medial sector, which represents the peripheral visual field. In macaques, a similar pattern of representa-tion has been revealed in visual area 6 (V6; 30), the Old World monkey homologue of DM (7). In both DM and V6, the medial sector of the upper quadrant representation is topologically continuous with the lower quadrant representation, creating a relatively simple map of the peripheral visual field (this peripheral representation is sometimes referred to as the parietooccipital area). However, at least in the marmoset (Figure 2C), the lateral sector of upper quadrant representation adjoins the remainder of DM along a map discontinuity, which separates cells with receptive fields in parafoveal and mid-peripheral parts of the upper quadrant and cells with receptive fields in the foveal lower quadrant.
of the brain, including V1 and most of the areas connected to it, cells are maximally responsive to stimuli presented within rela-tively well-defined receptive fields. By con-trast, in areas near the occipitotemporal and occipitoparietal transitions the single unit receptive fields are large, and the visuotopic organisations are best described in terms of coarse gradients. These rostral visual areas cannot be appropriately described in terms of the transformations discussed above. For example, multiunit recordings in cytoarchi-tectural area TEO have revealed a gradual change of receptive field locations from the central to the peripheral visual field, and a segregation between cells representing the upper and lower contralateral quadrants (6,31). However, despite these general trends, changes in receptive field position cannot be predicted with any accuracy, and their cen-tres alternate between the vicinities of the horizontal and vertical meridians in a seem-ingly random manner. Due to this large scat-ter, a continuous representation of each quad-rant is still achieved, without a systematic mapping of polar angle. Other regions that preserve a coarse segregation between the representations of the upper, lower, central and peripheral visual fields include visual area 6A (V6A; 32), the lateral intraparietal area (33), and the motion-sensitive areas adjacent to MT (34). In the region of the inferior temporal cortex located in the ven-tral bank of the superior temporal sulcus, only a crude centroperipheral gradient is preserved; cells with receptive fields centred in the upper and lower quadrants are ob-served in no particular order (35).
A last possible category of visuotopic map is that of incomplete representations. A number of studies have raised the possibility of maps which fail to represent all regions of the visual field. However, more extensive examination often reveals that areas with supposedly incomplete maps are actually parts of larger areas with complete visual field representation. One such case, the
Figure 3. Supra-areal visuotopic organisation of primate visual cortex. A, Lateral view of the right hemisphere of a marmoset monkey, illustrating the anatomical relationships within the cortical region shown in part B. In generating this figure parts of the cerebral cortex normally hidden from view (those located along the dorsal midline and ventral surface) have been graphically “unfolded”; moreover, an artificial discontinuity has been introduced along the horizontal meridian representation in V1 (arrows). The grey lines indicate the boundaries of cortical areas, according to a scheme of subdivision based on physiological mapping and architecture (6,10,29). B, Magnified view of the same map, with the visual topography indicated. The thick dashed lines indicate the dorsal and ventral limits of the cortex that is normally exposed on the dorsal and lateral surfaces of the brain. The numbers to the left of V1 indicate the range of receptive field centre eccentricities observed within the regions coded by the different tones of grey (0-2º, 2-4º, 4-8º, etc.). Representations of the horizontal meridian are indicated by white circles, representations of the vertical meridian by black squares, representations of the upper quadrant by the “+” signs, and those of the lower quadrant by the “-” signs. Although it is likely that visuotopy extends beyond the areas shown in this figure, the detailed organisation of these maps has not yet been established in the marmoset. POm, parietooccipital medial area; M, medial visual area; DM, dorsomedial area; DA, dorsoanterior visual area; DI, dorsointermediate visual area; MT, middle temporal visual area; MTc, middle temporal crescent; ITc, caudal subdivision of the inferior temporal visual area.
dorsal
caudal rostral
parietooccipital area, was initially de-scribed as having no foveal representation, but can now be viewed as the peripheral representation of a complete area, V6 (7,30). Similarly, the ventral posterior area, which was once characterised as represent-ing only the upper quadrant of the visual field, is now known to correspond to the ventral half of a larger subdivision, which includes near-symmetrical representations of both quadrants (6). At present, there is no compelling evidence for areas in the primate cortex with grossly incomplete representa-tions. A related, but more difficult problem is determining whether or not there are vi-sual areas lacking representations of the far periphery of the visual field. In most areas, the major emphasis on representation of cen-tral visual fields creates significant sampling problems, making it difficult to determine on the basis of microelectrode recordings alone whether far peripheral fields are truly absent from a map.
Supra-areal visuotopic organisation
The above descriptions of visuotopic maps fail to convey one of the most striking features of the primate visual cortex: the coherence of visual topography across func-tional boundaries. Receptive field position does not change suddenly as the boundary between two areas is crossed. Instead, the gradient of representation usually reverts in such a way that adjacent maps are mirror-symmetrical in the neighbourhood of their common boundary. Less frequently, the rep-resentations of the upper and lower quad-rants in two adjacent areas meet at a border that represents the horizontal meridian. The continuity of visuotopic organisation is clearly demonstrated by Figure 3, which pre-sents a composite view of the visuotopic organisations of several areas in the marmo-set monkey. For example, the foveal repre-sentations of several areas align near the lateral convexity of the occipital lobe,
form-ing an elongated strip that does not respect areal boundaries. Similarly, the representa-tions of gradually more eccentric parts of the visual field form continuous bands, which occupy progressively more medial locations. Although neurones near areal boundaries often have receptive fields which include the vertical and horizontal meridians, this is not necessarily the case, as outlined above.
Summary: the main rules of cortical visuotopic organisation
In conclusion, there appear to be two underlying rules which govern the topology of cortical visuotopic maps and which may be significant in determining the mechan-isms involved in the formation of cortical areas.
Rule 1: adjacent radial columns in the cortex must represent adjacent regions of the visual field, irrespective of whether these columns are part of the same or adjacent areas. It remains unclear whether or not there are any exceptions to this rule (true map discontinuities, where adjacent cell col-umns have non-overlapping receptive fields). At the microscopic level, map discontinui-ties may be bridged by neurones with rapidly changing (23), unusually large (36), or dual (Calford MB and Rosa MGP, unpublished observations) receptive fields.
Rule 2: adjacent regions of the visual field tend to be represented in adjacent ra-dial columns of a same given area. This rule is not as strictly enforced as the first one. For example, second-order representations of the visual field are far more common than first-order representations.
Implications for developmental mechanisms guiding the formation of cortical maps
forma-tion of cortical visuotopic maps (37). More-over, it is only recently that the genetic mechanisms underlying the specification of cortical areas have begun to be elucidated (38,39). Thus, it may be instructive at this point to consider the implications which the characteristics of adult maps, reviewed above, may have for understanding cortical devel-opment.
Current views regarding the formation of visuotopic maps are strongly influenced by studies on retino-recipient subcortical nu-clei, such as the superior colliculus (40). In these projections, gradients of cell surface chemicals define the polarity of the repre-sentation by guiding afferent axons to their approximate targets. This genetically hard-wired step determines the coarse features of the map, such as the orientation of the centro-peripheral axis. An activity-depend-ent stage follows once afferactivity-depend-ents establish synaptic contact, and the map is gradually refined. Simulations of activity-dependent processes in spatially contained structures (e.g., nuclei with sharp histological limits) have indicated that first-order representa-tions can form spontaneously, requiring only temporally patterned inputs and Hebbian rules (41). Given that retinal adjacency is such a powerful determinant of correlated activity (42), it is biologically plausible that a precise map reflecting the receptor densi-ties would form in these structures, even if only on the basis of the epigenetic, activity-driven step (43). The initial guidance provid-ed by cell membrane ligands provides a non-random starting point for the activity-de-pendent stage, which helps to explain con-sistency of the maps between individuals.
The fact that visuotopy is relatively con-sistent across individuals suggests that a chemical specification step may also charac-terise the initial stages of cortical map for-mation, although the evidence in visual cor-tex remains inconclusive and alternative mechanisms have been proposed (44). In addition, there is substantial evidence to
sug-gest that an activity-dependent component is involved in the formation of cortical maps (e.g., 45). Despite these parallels, there are at least two important characteristics of corti-cal areas that need to be accounted for by any model of cortical map development. First, the boundaries of cortical areas are rarely sharply defined; most do not coincide with obvious architectural transitions, there be-ing no evidence of sharp interruptions in columnar patterns or intrinsic connections across borders (46,47). Rather, cortical ar-eas could be viewed as gradually merging into each other. Second, as outlined above, overlap between the receptive fields of cells in adjacent columns in adult cortex takes precedence over continuity in the represen-tation within a given area. This local congru-ency of receptive field topography is maxi-mised both within and across areal bound-aries. These observations suggest that visual cortical maps are not independent of each other, and that it may not be appropriate to think in terms of the development of each area separately.
with independent molecular gradients for each developing area. However, one prob-lem with the molecular specification hypo-thesis lies in the complex distribution pattern of cell surface molecules required to achieve the large number of areas and the prevalence of second-order representations seen in vi-sual cortex. While the outlines of first-order representations can be specified on the basis of only two monotonic gradients of cell sur-face molecules (e.g., centroperipheral and dorsoventral), the specification of second-order representations on the basis of affer-ents arising from a first-order map would require more complicated, and non-mono-tonic patterns of molecule distribution. For example, the maps of V2, V3 and V4 would require molecules specifying a putative foveal-peripheral gradient to distribute si-multaneously from the middle of these areas to the dorsal and ventral extremities. The specification of polar angles would be even more complicated, perhaps requiring alter-nating, band-like distributions.
An alternative to this complex molecular pattern is to have a few key maps specified by molecular cues, and serving as topographic anchors for the development of adjacent areas; the visuotopy in these other areas would then be largely defined by activity-dependent processes. Let us consider, for example, that the V1 map develops in a similar manner to the collicular map (i.e., broad genetic specification, chemical or otherwise, followed by refinement), and that the V2 map self-organises around it accord-ing to Hebbian rules imposed by correlated retinal activity. The need to preserve a con-gruent boundary with V1 would be suffi-cient condition to limit the range of possible V2 configurations to those observed experi-mentally in adult primates (e.g., cells near the posterior border of V2 would necessarily have receptive fields near the vertical meri-dian). This hypothesis predicts the existence of a type of cellular interaction during the activity-dependent stage, which limits
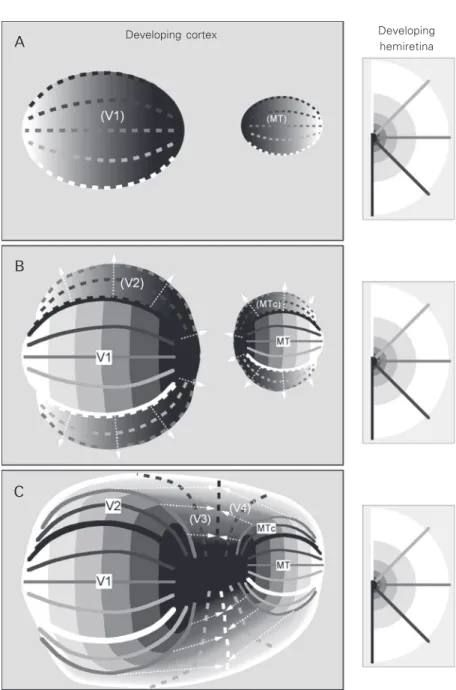
adja-Figure 4. Schematic view of the development of visuotopic maps according to the “molecular anchors” hypothesis. In these diagrams, dashed lines and continuous grey scale gradients indicate regions undergoing early stages of the process of visuotopic map formation. A, Two primary visual maps (corresponding to adult visual primary (V1) and middle temporal (MT) areas, the only first-order representations in the adult brain) are specified early in development, either by gradual distributions of cell surface chemoattrac-tant/chemorepellent molecules (40) or by spatiotemporal patterning of the afferent projec-tion (44). B, With the V1 and MT maps defined, the visuotopic maps in adjacent areas (V2 and MTc) start to self-organise around these “anchors”. Two rules guide this process: 1) the receptive fields of neurones in adjacent columns must overlap, and 2) the gradient of representation does not revert within a given area (arrows). This ensures that the same part of the visual field is not represented more than once in a given area, except along its boundaries. C, At a later stage of development, additional maps (e.g., V3 and V4) self-organise, using the established maps of V2 and MTc as “anchors”. Throughout pre- and post-natal development, activity-dependent mechanisms allow the fine-tuning of the maps.
Developing hemiretina Developing cortex
A
B
existence of two first-order representation anchors (V1 and MT) and time-dependent gradients of map maturation is sufficient to explain many of the characteristics of visuo-topic maps observed in adult primate cortex (Figure 4). As argued below, several lines of evidence suggest that V1 and MT may be both regarded as primary visual areas, in functional and evolutionary terms. It has also been demonstrated that they mature ear-lier than adjacent areas in terms of character-istics such as myelination and distribution of interneurones (50,51).
The molecular anchors hypothesis re-quires some cellular signal at the borders of late developing representations, to mark the point at which representational gradients should stop progressing. For example, while the receptive fields of neurones forming dor-sal V2 could be expected to self-organise from the vertical to the horizontal meridian in the lower field (Figure 4B), it is more difficult to explain why the map stops at the horizontal meridian, instead of invading the upper visual quadrant. One possibility is that the future borders of areas are pre-specified by molecular cues (38), and that one of the functions of the observed transitions in mo-lecular identity patterns is to signal the points where reversals in the representational gradients occur.
Finally, as a third possibility, it has been proposed that the early stages of visuotopic map formation in the cortex are completely dependent on the spatial organisation of tha-lamic maps. For example, according to one point of view, the visuotopic organisation of the pulvinar complex replicates in detail that of the extrastriate cortex (52). Thus, the as-signment of visuotopic identities to cortical cells could be accomplished by mechanisms such as the preservation of adjacency rela-tionships in the thalamocortical bundles, spa-tiotemporally graded maturation of the tha-lamocortical circuitry (44), or correspond-ing monotonic gradients of molecules. Un-fortunately, the merit of this hypothesis re-cent cells to having receptive fields in the
same part of the visual field (a biological implementation of rule 1 seen above). Such an interaction would occur throughout the early developing visual cortex, both within and across the borders of future areas (possi-bly involving the extensive network of inter-neuronal gap junctions observed during this period; 49). In such a scenario, those areas whose visuotopic identity is specified early in development could progressively limit the options governing the creation of subsequent maps. In fact, a simple model invoking the
Figure 5. A, Flat-mounted vibratome slice through the brain of a marmoset. Caudal is towards the left, and dorsal towards the top. This slice has not been stained, and the borders of primary visual (V1) and middle temporal (MT) areas are made visible only by differences in myelination (highly myelinated areas appearing lighter). Although the rostral border of V2 is only faintly visible in this type of preparation, it can be easily defined in cytochrome oxidase-stained material. B, Surface areas of V2 (light grey) and MT (dark grey) as a fraction of the V1 surface, in seven species of primates. All measurements were obtained from flat-mounted sections stained for myelin or cytochrome oxidase. C, Graphi-cally “unfolded” reconstructions of the posterior neocortex of three species of diurnal primates with different brain sizes (note different scale bars at the bottom of each panel). The extents of V1, V2 and MT, as well as the location of rostral border of V3, are indicated. Left: marmoset; middle: macaque; right: human (from Ref. 53). In order to reduce the distortions introduced by the graphic unfolding, discontinuities were introduced in the maps, either along the perimeter of V1 (left, centre) or across this area (right). The human map does not indicate the full extent of V1 and V2, as only the central 15-20º of the visual field were mapped, using non-invasive imaging techniques.
Ratio of surface areas
1.0
0.8
0.6
0.4
0.2
0.0
Homo
Macaca
Cebus
Saimiri
Callithrix
Aotus
Galago
Callithrix Macaca Homo
A
C
B
mains difficult to judge, as the topographic organisation of the pulvinar nuclei is still a subject of intense debate. However, even if the assumption of isomorphic cortical and thalamic maps proves to be true, this would merely shift the emphasis to explaining the formation of different types of thalamic visuotopic representations. The same issues raised above (complexity of the required molecular gradients, mechanism for preserv-ing congruency) would still apply.
Primate visual cortex in evolution
Whatever mechanisms are responsible for the establishment of visuotopic maps in the developing cortex, it is clear that they allow for considerable variation among spe-cies. Thus, although much can be learned about the principles of organisation of the human visual system from studies in mon-keys, the proper interpretation of data also requires knowledge about the rules govern-ing this variability. Moreover, a long-term evolutionary perspective can be helpful in interpreting mechanisms of brain develop-ment, by demonstrating which types of changes are likely to occur, and which of these are unlikely to succeed in the context of natural selection.
Larger primate brains are not simply ho-mogeneously scaled versions of smaller brains. This can be demonstrated by com-paring the relative sizes of clearly defined cortical fields, such as V1, V2 and MT, which can be directly visualised in histologi-cal sections (Figure 5A,B). Despite a four-teen-fold change in absolute values between marmosets and humans, the ratio of the sur-face areas of MT and V1 shows only a modest variation among primates (MT occu-pying cortex equivalent to 6-8% of the sur-face area of V1). In contrast, the relative size of V2 changes dramatically, from being nearly equal to that of V1 in larger primates with diurnal habits (Homo, Macaca) to about one-third of the size, in nocturnal primates
(Aotus, Galago). Smaller diurnal New World species lie between these extremes. The ex-pansion of V2 in larger primate species has been accompanied by a relative growth of the visual cortex situated between V2 and MT, including the third and fourth visual complexes (Figure 5C). In humans, this re-gion also includes what appear to be evolu-tionarily new areas, which have no clear homologues in the most intensively studied species of monkey (53,54). These areas, lo-cated rostral to the putative homologue of V4, are characterised by ill-defined visuo-topic organisations, including extensive rep-resentations of the ipsilateral hemifield. Con-versely, in flying foxes (animals which may share some of the cortical organisation pres-ent in early primates), there is only a narrow strip of cortex interposed between V2 and MT, which is entirely devoted to a single, V3-like topographically organised area (55). These observations suggest that one of the main trends in the evolutionary history of anthropoids has been the selective expan-sion of the visual cortex between V1 and MT. This can be interpreted in the light of the molecular anchors hypothesis (Figure 4). An early origin of these areas (both in terms of evolution and development) could be re-lated to characteristics such as the presence of first-order representations of the visual field and sharp architectural boundaries. Newer areas, in contrast, have more com-plex visuotopic maps, less defined visual topographies, and are architecturally indis-tinct. It is intriguing that V1 and MT also share a number of important functional char-acteristics, including being cortical targets of thalamic retino-recipient nuclei (56), and responding to visual stimulation in parallel (57). In fact, it could be argued that they are both primary visual areas.
On the relationship between visuotopic maps and areas
cerebral cortex is divided into morphologi-cally distinct, functionally dedicated and ste-reotypically connected fields, reflecting Brodmanns view of areas as the organs of the brain. However, it should be realised that our knowledge of cortical organisation is far from being this clear. Even in the most intensively studied animal models, the de-gree of precision and confidence with which one can delimit visual areas varies enor-mously, from pencil-sharp limits to tenuous transitions. There are relatively few examples of well-segregated areas (mainly, primary sensory/motor areas), and it is possible that intermediate configurations, including par-tially overlapping or interdigitating fields, exist. This is clearly illustrated by what we know of visual areas. There are some, such as V1, which can be unambiguously identi-fied using a number of different techniques, while other regions, despite intensive inves-tigation, are still not well characterised. For example, histological transitions in the infe-rior temporal cortex are gradual, the patterns of interconnections are difficult to assign as clearly intrinsic or extrinsic (58,59), and visuotopic maps are coarse. All evidence considered, the organisation of this region
can be just as adequately described in terms of gradual changes, without the implication of sharply defined, functionally segregated areas.
Falling between these extremes lie a num-ber of topographically organised visual ar-eas which remain a source of controversy. One such example concerns the organisation of the cortical belt immediately anterior to V2 in monkeys (Figure 6). Although it has become now clear that ventral V3, or the ventral posterior area, is part of a larger area which represents both the upper and lower quadrants (6), studies regarding the extent and visuotopy of dorsal V3 (the lower quadrant representation) have generated incompatible results. According to one in-terpretation, based on electrophysiological data in New World monkeys, there is a cortical area (DM) representing the upper quadrant immediately adjacent to dorsal V2 (Figure 6, left), and the V3-like area is re-stricted to ventral and lateral cortices. How-ever, anatomical tracing experiments in the same species have given rise to a differ-ent interpretation (Figure 6, right), suggest-ing that dorsal V3 in fact extends to the dorsal midline, separating V2 from DM (60).
Although many of the current controver-sies may be solved by future studies, one must also be prepared to accept the possibil-ity that the cerebral cortex is not a mosaic of clearly defined, homogeneous fields. Bor-ders which are sharply defined and method-ologically robust in adults may well reflect those which are specified by the sharpest transitions in the expression of cell surface molecules during development (e.g., V1; 38). As discussed earlier, such boundaries are likely to be characteristic of phylogeneti-cally older areas, which change relatively little across primate species. In evolution-arily newer cortices, interdigitating areas, gradual transition zones, more complex visuotopic maps and larger individual varia-bility are to be expected, particularly if
activ-Figure 6. Alternative hypotheses regarding the organisation of the third visual complex. Lateral views of the brain of a New World mon-key, illustrating two models of the organisation of the cortex imme-diately anterior to V2. These are graphically “unfolded” views of the cortex hidden in the medial and ventral surfaces of the brain.
Light grey indicates representations of the upper contralateral quadrant (or parts thereof), and dark grey indicates representations of the lower contralateral quadrant. A, Hypothesis based on the results of electrophysiological recordings. According to this view, the dorsolateral and ventral regions of extrastriate cortex include a field homologous to area 19 of most mammals, named the ventrolateral posterior area (VLP), or V3 (6). Because neurones with receptive fields in the upper quadrant have been recorded immediately anterior to V2 in the dorsome-dial cortex, the extension of V3 to the dorsal midline is regarded as unlikely. Instead, it is proposed that a dorsomedial area (DM) exists in this region. DM and V3 also differ in terms of myeloarchitecture. B, An alternative hypothesis, based on the results of anatomical tracing (60). As in the first diagram, the cortex anterior to ventral V2 forms a relatively simple representation of the upper quadrant. However, it is hypothesised that the dorsomedial cortex anterior to dorsal V2 lacks upper quadrant representations. Instead, it is proposed that a simple strip-like dorsal V3 exists in the corresponding location, representing only the lower contralateral quadrant. V1, V2, MT: primary, second and middle temporal visual areas.
A B
DM
MT V2 V1
V3
V2 V1
V2
V2 V1
V1 V3
ity-dependent processes respond for a large fraction of the formation of the circuitry. These regions are also likely to be more variable among species, thereby compound-ing the inherent difficulty in identifycompound-ing ho-mologous fields (54). Clarification of the developmental mechanisms underlying the formation of cortical maps, and in particular the degree of genetic specification involved in the establishment of different areas, will have a significant impact on our understand-ing of the functional organisation and
evolu-tion of the visual cortex.
Acknowledgments
Equipment support from the Clive and Vera Ramaciotti Foundation and the ANZ Charitable Trust is gratefully acknowledged. Special thanks to Prof. Roberto Lent, for the organisation of a fantastic symposium, and to Rowan Tweedale, for many hours of dis-cussion and for reading earlier versions of this paper.
References
1. Hubel DH & Wiesel TN (1974). Uniformity of monkey striate cortex: A parallel rela-tionship between field size, scatter, and magnification factor. Journal of Compara-tive Neurology, 158: 295-306.
2. Cowey A (1964). Projection of the retina onto striate and prestriate cortex in the squirrel monkey, Saimiri sciureus. Journal of Neurophysiology, 27: 366-393. 3. Allman JM & Kaas JH (1971).
Representa-tion of the visual field in striate and adjoin-ing cortex of the owl monkey (Aotus trivir-gatus). Brain Research, 35: 89-106. 4. Allman JM & Kaas JH (1974). The
organi-zation of the second visual area (V II) in the owl monkey: A second order transfor-mation of the visual hemifield. Brain Re-search, 76: 247-265.
5. Allman JM & Kaas JH (1975). The dorso-medial cortical visual area: A third tier area in the occipital lobe of the owl monkey (Aotus trivirgatus). Brain Research, 100: 473-487.
6. Rosa MGP & Tweedale R (2000). Visual areas in lateral and ventral extrastriate cortices of the marmoset monkey. Jour-nal of Comparative Neurology, 422: 621-651.
7. Rosa MGP & Tweedale R (2001). The dor-somedial visual areas in New World and Old World monkeys: homology and func-tion. European Journal of Neuroscience, 13: 421-427.
8. Azzopardi P & Cowey A (1993). Preferen-tial representation of the fovea in the pri-mary visual cortex. Nature, 361: 719-721. 9. Rosa MG, Fritsches KA & Elston GN (1997). The second visual area in the mar-moset monkey: visuotopic organisation, magnification factors, architectonical boundaries, and modularity. Journal of
Comparative Neurology, 387: 547-567. 10. Rosa MGP & Elston GN (1998).
Visuo-topic organisation and neuronal response selectivity for direction of motion in visual areas of the caudal temporal lobe of the marmoset monkey (Callithrix jacchus): middle temporal area, middle temporal crescent, and surrounding cortex. Journal of Comparative Neurology, 393: 505-527. 11. Allman JM & Kaas JH (1971). A represen-tation of the visual field in the caudal third of the middle temporal gyrus of the owl monkey (Aotus trivirgatus). Brain Re-search, 31: 85-105.
12. Fritsches KA & Rosa MGP (1996). Visuo-topic organisation of striate cortex in the marmoset monkey (Callithrix jacchus).
Journal of Comparative Neurology, 372: 264-282.
13. Zeki SM (1969). Representation of central visual fields in prestriate cortex of mon-key. Brain Research, 14: 271-291. 14. Rosa MGP, Sousa APB & Gattass R
(1988). Representation of the visual field in the second visual area in the Cebus
monkey. Journal of Comparative Neurol-ogy, 275: 326-345.
15. Sereno MI, Dale AM, Reppas JB, Kwong KK, Belliveau JW, Brady TJ, Rosen BR & Tootell RB (1995). Borders of multiple vi-sual areas in humans revealed by func-tional magnetic resonance imaging. Sci-ence, 268: 889-893.
16. Rosa MGP, Casagrande VA, Preuss T & Kaas JH (1997). Visual field representa-tion in striate and prestriate cortices of a prosimian primate (Galago garnetti). Jour-nal of Neurophysiology, 77: 3193-3217. 17. Rosa MGP & Krubitzer LA (1999). The
evolution of visual cortex: where is V2?
Trends in Neurosciences, 22: 242-248.
18. Allman JM & Kaas JH (1974). A crescent-shaped cortical visual area surrounding the middle temporal area (MT) in the owl monkey (Aotus trivirgatus). Brain Re-search, 81: 199-213.
19. Allman JM & Kaas JH (1976). Representa-tion of the visual field on the medial wall of occipital-parietal cortex in the owl mon-key. Science, 191: 572-575.
20. Zeki SM (1977). Simultaneous anatomical demonstration of the representation of the vertical and horizontal meridians in areas V2 and V3 of rhesus monkey visual cortex. Proceedings of the Royal Socie-ty of London. B, Biological Sciences, 195: 517-523.
21. Cragg BG & Ainsworth A (1969). The to-pography of the afferent projections in the circumstriate visual cortex of the mon-key studied by the Nauta method. Vision Research, 9: 733-747.
22. Gattass R, Sousa APB & Gross CG (1988). Visuotopic organization and extent of V3 and V4 of the macaque. Journal of Neuro-science, 8: 1831-1845.
23. Sereno MI, McDonald CT & Allman JM (1994). Analysis of retinotopic maps in extrastriate cortex. Cerebral Cortex, 4: 601-620.
24. Tusa RJ, Rosenquist AC & Palmer LA (1979). Retinotopic organization of areas 18 and 19 in the cat. Journal of Compara-tive Neurology, 185: 657-678.
25. Albus K & Beckmann R (1980). Second and third visual areas of the cat: interindi-vidual variability in retinotopic arrange-ment and cortical location. Journal of Physiology, 299: 247-276.
cor-tex. Visual Neuroscience, 10: 131-158. 27. Manger PR, Kiper D, Masiello I, Murillo L,
Tettoni L, Hunyadi Z & Innocenti GM (2002). The representation of the visual field in three extrastriate areas of the fer-ret (Mustela putorius) and the relationship of retinotopy and field boundaries to cal-losal connectivity. Cerebral Cortex, 12: 423-437.
28. Manger PR, Woods TM, Munoz A & Jones EG (1997). Hand/face border as a limiting boundary in the body representa-tion in monkey somatosensory cortex.
Journal of Neuroscience, 17: 6338-6351. 29. Rosa MGP & Schmid LM (1995). Visual
areas in the dorsal and medial extrastriate cortices of the marmoset. Journal of Com-parative Neurology, 359: 272-299. 30. Galletti C, Fattori P, Gamberini M & Kutz
DF (1999). The cortical visual area V6: brain location and visual topography. Eu-ropean Journal of Neuroscience, 11: 3922-3936.
31. Boussaoud D, Desimone R & Ungerleider LG (1991). Visual topography of area TEO in the macaque. Journal of Comparative Neurology, 306: 554-575.
32. Galletti C, Fattori P, Kutz DF & Gamberini M (1999). Brain location and visual topog-raphy of cortical area V6A in the macaque monkey. European Journal of Neurosci-ence, 11: 575-582.
33. Ben Hamed S, Duhamel JR, Bremmer F & Graf W (2001). Representation of the visual field in the lateral intraparietal area of macaque monkeys: a quantitative re-ceptive field analysis. Experimental Brain Research, 140: 127-144.
34. Komatsu H & Wurtz RH (1988). Relation of cortical areas MT and MST to pursuit eye movements. I. Localization and visual properties of neurons. Journal of Neuro-physiology, 60: 580-603.
35. Hikosaka K (1998). Representation of foveal visual fields in the ventral bank of the superior temporal sulcus in the poste-rior inferotemporal cortex of the macaque monkey. Behavioural Brain Research, 96: 101-113.
36. Payne BR & Siwek DF (1990). Receptive fields of neurons at the confluence of ce-rebral cortical areas 17, 18, 20a, and 20b in the cat. Visual Neuroscience, 4: 475-479.
37. Krug K, Smith AL & Thompson ID (1998). The development of topography in the hamster geniculo-cortical projection. Jour-nal of Neuroscience, 18: 5766-5776.
38. Donoghue MJ & Rakic P (1999). Molecu-lar gradients and compartments in the embryonic primate cerebral cortex. Cere-bral Cortex, 9: 586-600.
39. Rubenstein JLR, Anderson S, Shi L, Miyashita-Lin E, Bulfone A & Hevner R (1999). Genetic control of cortical region-alization and connectivity. Cerebral Cor-tex, 9: 524-532.
40. O’Leary DD, Yates PA & McLaughlin T (1999). Molecular development of sen-sory maps: representing sights and smells in the brain. Cell, 96: 255-269.
41. Willshaw DJ & Von der Malsburg C (1976). How patterned neural connections can be set up by self-organisation. Pro-ceedings of the Royal Society of London. B,Biological Sciences, 194: 431-435. 42. Wong RO, Meister M & Shatz CJ (1993).
Transient period of correlated bursting ac-tivity during development of the mamma-lian retina. Neuron, 11: 923-938. 43. Elliott T & Shadbolt NR (1999). A
neu-rotrophic model of the development of the retinogeniculocortical pathway in-duced by spontaneous retinal waves.
Journal of Neuroscience, 19: 7951-7970. 44. Molnár Z, Adams R & Blakemore C (1998).
Mechanisms underlying the early estab-lishment of thalamocortical connections in the rat. Journal of Neuroscience, 18: 5723-5745.
45. Herrmann K & Shatz CJ (1995). Blockade of action potential activity alters initial ar-borization of thalamic axons within corti-cal layer 4. Proceedings of the National Academy of Sciences, USA, 92: 11244-11248.
46. Malach R, Schirman TD, Harel M, Tootell RB & Malonek D (1997). Organization of intrinsic connections in owl monkey area MT. Cerebral Cortex, 7: 386-393. 47. White LE, Bosking WH & Fitzpatrick D
(2001). Consistent mapping of orientation preference across irregular functional do-mains in ferret visual cortex. Visual Neu-roscience, 18: 65-76.
48. Vanderhaeghen P, Lu Q, Prakash N, Frisen J, Walsh CA, Frostig RD & Flanagan JG (2000). A mapping label required for nor-mal scale of body representation in the cortex. Nature Neuroscience, 3: 358-365. 49. Bittman K, Becker DL, Cicirata F & Parna-velas JG (2002). Connexin expression in homotypic and heterotypic cell coupling in the developing cerebral cortex. Journal of Comparative Neurology, 443: 201-212. 50. Watson JDG, Myers R, Frackowiak RSJ,
Hajnal JV, Woods RP, Mazziotta JC, Shipp S & Zeki SM (1993). Area V5 of the human brain: Evidence from a combined study using positron emission tomography and magnetic resonance imaging. Cerebral Cortex, 3: 79-94.
51. Condé F, Lund JS & Lewis DA (1996). The hierarchical development of monkey vi-sual cortical regions as revealed by the maturation of parvalbumin-immunoreac-tive neurons. Developmental Brain Re-search, 96: 261-276.
52. Dick A, Kaske A & Creutzfeldt OD (1991). Topographical and topological organiza-tion of the thalamocortical projecorganiza-tion to the striate and prestriate cortex in the marmoset (Callithrix jacchus). Experimen-tal Brain Research, 84: 233-253. 53. Tootell RB, Mendola JD, Hadjikhani NK,
Liu AK & Dale AM (1998). The representa-tion of the ipsilateral visual field in human cerebral cortex. Proceedings of the Na-tional Academy of Sciences, USA, 95: 818-824.
54. Tootell RBH & Hadjikhani N (2001). Where is ‘dorsal V4’ in human visual cortex? Reti-notopic, topographic and functional evi-dence. Cerebral Cortex, 11: 298-311. 55. Rosa MGP (1999). Topographic
organisa-tion of extrastriate areas in the flying fox: implications for the evolution of mamma-lian visual cortex. Journal of Comparative Neurology, 411: 503-523.
56. O’Brien BJ, Abel PL & Olavarria JF (2001). The retinal input to calbindin-D28k-de-fined subdivisions in macaque inferior pulvinar. Neuroscience Letters, 312: 145-148.
57. Ffytche DH, Guy CN & Zeki S (1995). The parallel visual motion inputs into areas V1 and V5 of human cerebral cortex. Brain, 118: 1375-1394.
58. Kondo H, Hashikawa T, Tanaka K & Jones EG (1994). Neurochemical gradient along the monkey occipito-temporal cortical pathway. NeuroReport, 5: 613-616. 59. Suzuki W, Saleem KS & Tanaka K (2000).
Divergent backward projections from the anterior part of the inferotemporal cortex (area TE) in the macaque. Journal of Com-parative Neurology, 422: 206-228. 60. Lyon DC & Kaas JH (2001). Connectional