Normative data for the Brazilian
population in the Boston Diagnostic
Aphasia Examination: influence of
schooling
Departamentos de 1Neurologia, and 2Fisioterapia, Fonoaudiologia e
Terapia Ocupacional, Faculdade de Medicina, Universidade de São Paulo, São Paulo, SP, Brasil
M. Radanovic1,
L.L. Mansur2
and M. Scaff1
Abstract
In Neurolinguistics, the use of diagnostic tests developed in other countries can create difficulties in the interpretation of results due to cultural, demographic and linguistic differences. In a country such as Brazil, with great social contrasts, schooling exerts a powerful influ-ence on the abilities of normal individuals. The objective of the present study was to identify the influence of schooling on the performance of normal Brazilian individuals in the Boston Diagnostic Aphasia Examination (BDAE), in order to obtain reference values for the Brazilian population. We studied 107 normal subjects ranging in age from 15 to 84 years (mean ± SD = 47.2 ± 17.6 years), with educational level ranging from 1 to 24 years (9.9 ± 4.8 years). Subjects were compared for scores obtained in the 28 subtests of the BDAE after being divided into groups according to age (15 to 30, N = 24, 31 to 50, N = 33 and 51 years or more, N = 50) and education (1 to 4, N = 26, 5 to 8, N = 17 and 9 years or more, N = 61). Subjects with 4 years or less of education performed poorer in Word Discrimination, Visual Confrontation Naming, Reading of Sentences and Paragraphs, and Primer-Level Dictation (P < 0.05). When breakdown by schooling was 8 years or less, subjects performed poorer in all subtests (P < 0.05), except Responsive Naming, Word Recognition and Word-Picture Matching. The elderly performed poorer (P < 0.05) in Com-plex Ideational Material, Visual Confrontation Naming, Comprehen-sion of Oral Spelling, Written Confrontation Naming, and Sentences to Dictation. We present the reference values for the cut-off scores according to educational level.
Correspondence
M. Radanovic
Rua Cristiano Viana, 163/92 05411-000 São Paulo, SP Brasil
Fax: +55-11-3088-9708 E-mail: radano@tecway.com.br Publication supported by FAPESP.
Received February 26, 2004 Accepted July 21, 2004
Key words
•Boston Diagnostic Aphasia Examination
•Schooling
•Brazilian population
Introduction
Language abilities are strongly influenced by sociocultural characteristics. For this rea-son, we have been trying to determine the
subjects and tried to determine which demo-graphic variables could influence their per-formance in the BDAE, as well as to obtain reference values for our population (2).
In the original validation of the BDAE for the American population there was no specific concern about adjusting the scores for subgroups of different sociocultural lev-els. Yet Pineda et al. (3), in a study con-ducted in Colombia, observed the impor-tance of this correction. In Brazil, a country in which social differences are also extreme, it is expected that educational level may represent a powerful influence on the perfor-mance of subjects in neuropsychological tests in general (4,5). However, in the study cited above (2) we were unable to find unequivo-cal differences. Thus, we realized that it was necessary to increase the sample size to in-clude different educational levels.
The formation of the less educated group was not a straightforward task, because it is becoming increasingly harder to find partici-pants less than 30 years old who report that they have not attended school, thanks to the implantation of policies to eradicate illit-eracy in Brazil since the mid 1980’s (6,7). However, these efforts do not guarantee that these individuals will score well in tasks that involve formal knowledge, and often these subjects are in the functional illiteracy range (8).
On the other hand, the modern world provides mass communication media that are accessible to all population segments, leading to high exposure to the literate world, thus minimizing in some ways the deficiency of knowledge acquisition at school and at-tenuating these differences to a certain de-gree.
The purpose of the present study was to determine in greater detail the influence of schooling on the performance of Brazilian subjects on the BDAE, and to obtain more precise reference values for our population derived from a sample larger than the one of the previous study (2).
Participants and Methods
The Portuguese version of the BDAE (1) was applied to 107 Brazilian volunteers (64 women and 43 men), who were healthy, independent regarding daily life activities, without neurological or psychiatric anteced-ents, and who were all native Portuguese speakers living in São Paulo for more than 10 years. Subjects were recruited among the relatives of speech therapy students, hospital employees and outpatients’ relatives or caregivers, with care taken to form groups that could represent age and schooling influ-ences on the performance of normal indi-viduals. Functional and conversational flu-ency evaluations were not considered for this study.
Speech therapy students were trained in the administration of the BDAE and applied the test using a uniform procedure while a speech therapy professor reviewed the scores obtained. Data were analyzed using the SPSS® version 10.0 and MedCalc® version
7.2.1.0 software. To evaluate the effect of formal education, the subjects were divided into two groups: up to 8 years of study (N = 43), and 9 years or more (N = 61). The group with up to 8 years of education was then further divided into two subgroups: up to 4 years (N = 26), and from 5 to 8 years (N = 17) of schooling for further comparison. In order to evaluate the age effect, the subjects were divided into three groups: A, 15 to 30 years (N = 24); B, 31 to 50 years (N = 33); C, 51 years or more (N = 50).
of the Dunn’s post-test to the previous anal-ysis. The results for animal fluency (which had a normal distribution) were compared by ANOVA followed by the Tukey-Kramer post-test. A value of P < 0.05 was considered to be statistically significant for all analyses.
Results
The age of the normal subjects studied ranged from 15 to 84 years (mean ± SD = 47.2 ± 17.6 years), and educational level, defined as time devoted to formal study,
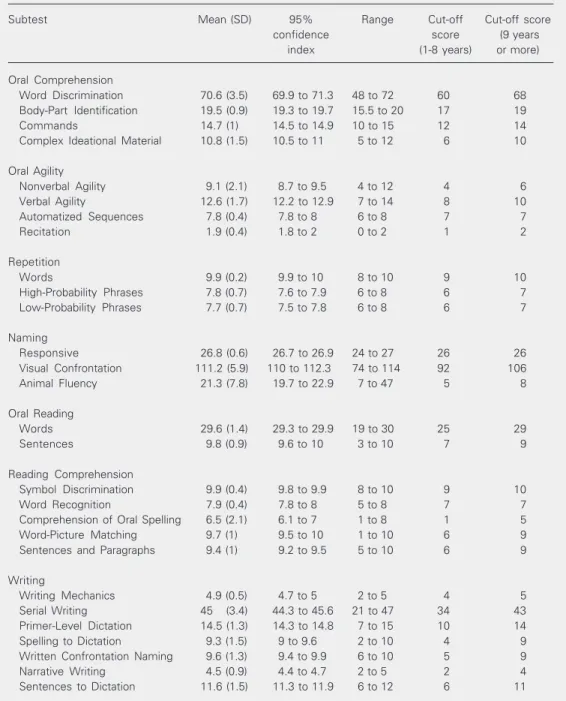
Table 1. Performance of subjects on the Boston Diagnostic Aphasia Examination (N = 107) and recom-mended cut-off scores as a function of years of schooling.
Subtest Mean (SD) 95% Range Cut-off Cut-off score
confidence score (9 years
index (1-8 years) or more)
Oral Comprehension
Word Discrimination 70.6 (3.5) 69.9 to 71.3 48 to 72 60 68 Body-Part Identification 19.5 (0.9) 19.3 to 19.7 15.5 to 20 17 19
Commands 14.7 (1) 14.5 to 14.9 10 to 15 12 14
Complex Ideational Material 10.8 (1.5) 10.5 to 11 5 to 12 6 10
Oral Agility
Nonverbal Agility 9.1 (2.1) 8.7 to 9.5 4 to 12 4 6
Verbal Agility 12.6 (1.7) 12.2 to 12.9 7 to 14 8 10
Automatized Sequences 7.8 (0.4) 7.8 to 8 6 to 8 7 7
Recitation 1.9 (0.4) 1.8 to 2 0 to 2 1 2
Repetition
Words 9.9 (0.2) 9.9 to 10 8 to 10 9 10
High-Probability Phrases 7.8 (0.7) 7.6 to 7.9 6 to 8 6 7 Low-Probability Phrases 7.7 (0.7) 7.5 to 7.8 6 to 8 6 7
Naming
Responsive 26.8 (0.6) 26.7 to 26.9 24 to 27 26 26
Visual Confrontation 111.2 (5.9) 110 to 112.3 74 to 114 92 106
Animal Fluency 21.3 (7.8) 19.7 to 22.9 7 to 47 5 8
Oral Reading
Words 29.6 (1.4) 29.3 to 29.9 19 to 30 25 29
Sentences 9.8 (0.9) 9.6 to 10 3 to 10 7 9
Reading Comprehension
Symbol Discrimination 9.9 (0.4) 9.8 to 9.9 8 to 10 9 10
Word Recognition 7.9 (0.4) 7.8 to 8 5 to 8 7 7
Comprehension of Oral Spelling 6.5 (2.1) 6.1 to 7 1 to 8 1 5
Word-Picture Matching 9.7 (1) 9.5 to 10 1 to 10 6 9
Sentences and Paragraphs 9.4 (1) 9.2 to 9.5 5 to 10 6 9
Writing
Writing Mechanics 4.9 (0.5) 4.7 to 5 2 to 5 4 5
Serial Writing 45 (3.4) 44.3 to 45.6 21 to 47 34 43 Primer-Level Dictation 14.5 (1.3) 14.3 to 14.8 7 to 15 10 14
Spelling to Dictation 9.3 (1.5) 9 to 9.6 2 to 10 4 9
Written Confrontation Naming 9.6 (1.3) 9.4 to 9.9 6 to 10 5 9
Narrative Writing 4.5 (0.9) 4.4 to 4.7 2 to 5 2 4
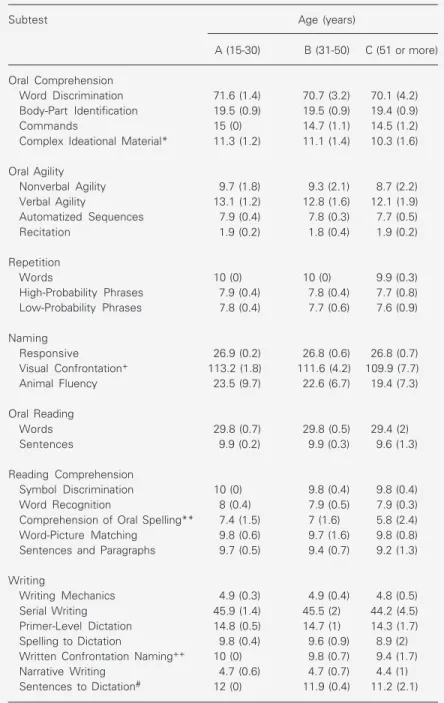
Comparison of performance among the three age groups revealed a significant dif-ference in the Complex Ideational Material, Visual Confrontation Naming, Comprehen-sion of Oral Spelling, Written Confrontation Naming, and Sentences to Dictation subtests (Table 3). The mean educational level for the three groups was 12.5 ± 2.3 years for group A, 10.7 ± 5.1 years for group B, and 7.8 ± 4.8 years for group C. There was a significant difference in average educational level among these groups, as follows: group A vs C (P < 0.001) and group B vs C (P = 0.019).
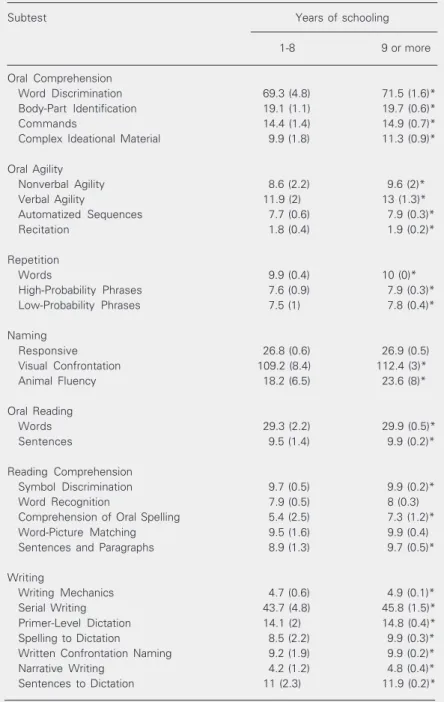
Educational level (1 to 8 vs 9 years or
more) influenced performance in all subtests, except Responsive Naming, Word Recogni-tion and Word-Picture Matching (Table 4). However, the comparison between the sub-groups with 1 to 4 and 5 to 8 years revealed significant differences in Word Discrimina-tion, Visual Confrontation Naming, Com-prehension of Sentences and Paragraphs, and Primer-Level Dictation (Table 5).
Discussion
The content of a language test must re-flect the basic linguistic knowledge of a particular social group. In fact, our results show that subjects with less than 8 years of education behave in a relatively homoge-neous way. This becomes more evident as they are subdivided into subgroups of 1 to 4 and 5 to 8 years of education, when there are no differences in most of the subtests, except for Word Discrimination, Visual Confronta-tion Naming, Comprehension of Sentences and Paragraphs, and Primer-Level Dictation (Table 5). Indeed, Word Discrimination, Vis-ual Confrontation Naming and Primer-Level Dictation are all tasks that demand a greater degree of semantic knowledge (especially because they involve geometric shapes and syntactically complex numbers), whereas the Comprehension of Sentences and Paragraphs task requires a reading ability, which
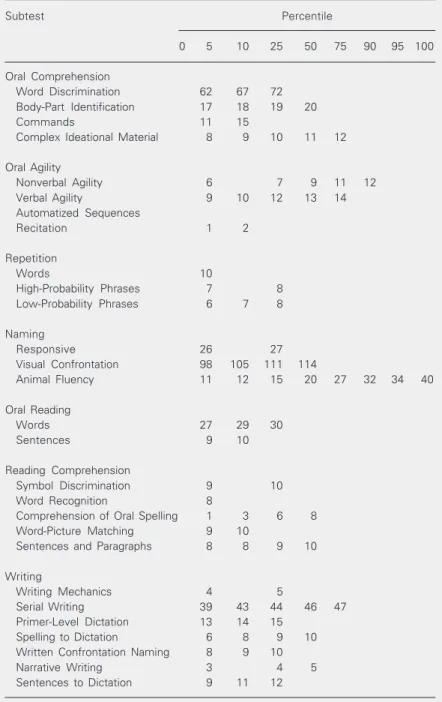
im-Table 2. Performance of subjects on the Boston Diagnostic Aphasia Examination.
Subtest Percentile
0 5 10 25 50 75 90 95 100
Oral Comprehension
Word Discrimination 62 67 72 Body-Part Identification 17 18 19 20
Commands 11 15
Complex Ideational Material 8 9 10 11 12
Oral Agility
Nonverbal Agility 6 7 9 11 12
Verbal Agility 9 10 12 13 14
Automatized Sequences
Recitation 1 2
Repetition
Words 10
High-Probability Phrases 7 8 Low-Probability Phrases 6 7 8
Naming
Responsive 26 27
Visual Confrontation 98 105 111 114
Animal Fluency 11 12 15 20 27 32 34 40
Oral Reading
Words 27 29 30
Sentences 9 10
Reading Comprehension
Symbol Discrimination 9 10
Word Recognition 8
Comprehension of Oral Spelling 1 3 6 8 Word-Picture Matching 9 10
Sentences and Paragraphs 8 8 9 10
Writing
Writing Mechanics 4 5
Serial Writing 39 43 44 46 47
Primer-Level Dictation 13 14 15
Spelling to Dictation 6 8 9 10
Written Confrontation Naming 8 9 10
Narrative Writing 3 4 5
Sentences to Dictation 9 11 12
Data are reported for 107 subjects in percentile.
proves with increasing years of formal edu-cation.
When breakdown by schooling was 8 years or less we observed differences in all subtests, except for Responsive Naming, Word Recognition and Word-Picture Match-ing (Table 4). The tasks for which this differ-ence was more marked were Word Discrimi-nation, Body Part Identification, Complex Ideational Material, Animal Fluency, Com-prehension of Oral Spelling, Comprehen-sion of Sentences and Paragraphs, Spelling to Dictation, Written Confrontation Nam-ing, and Sentences to Dictation. The Word Discrimination subtest involves semantic categories whose knowledge is related to the experience frequently acquired at school, like geometric shapes and details of body parts. The comprehension and memoriza-tion of texts, necessary for the Complex Ideational Material and Comprehension of Sentences and Paragraphs tasks, demand the establishment of complex semantic relations in order to derive their meaning. The com-prehension of texts is based on the analysis of propositions on a logical basis, necessary in the making of inferences, indicating the subject’s ability to transpose his personal experience, both factual and concrete (9). It can be noticed that this difficulty was ob-served as much in the comprehension of oral texts as in the written texts (Comprehension of Sentences and Paragraphs), not surpris-ingly given that the oral texts in this task were in fact previously devised in the written modality, so that the oral presentation main-tains the characteristics of the written lan-guage, such as the absence of redundancies, among others.
The influence of schooling on the gen-eration of lexical items in a particular se-mantic category (animal) had already been studied in the Brazilian population (10). The knowledge of semantic categories, supplied by formal education, probably helps the man-agement and organization of the semantic groups, leading to the generation of a greater
number of lexical items by the more edu-cated subjects.
The differences observed in the written subtests (Spelling to Dictation, Written
Con-Table 3. Performance of subjects on the Boston Diagnostic Aphasia Examination by age.
Subtest Age (years)
A (15-30) B (31-50) C (51 or more)
Oral Comprehension
Word Discrimination 71.6 (1.4) 70.7 (3.2) 70.1 (4.2) Body-Part Identification 19.5 (0.9) 19.5 (0.9) 19.4 (0.9)
Commands 15 (0) 14.7 (1.1) 14.5 (1.2)
Complex Ideational Material* 11.3 (1.2) 11.1 (1.4) 10.3 (1.6)
Oral Agility
Nonverbal Agility 9.7 (1.8) 9.3 (2.1) 8.7 (2.2) Verbal Agility 13.1 (1.2) 12.8 (1.6) 12.1 (1.9) Automatized Sequences 7.9 (0.4) 7.8 (0.3) 7.7 (0.5)
Recitation 1.9 (0.2) 1.8 (0.4) 1.9 (0.2)
Repetition
Words 10 (0) 10 (0) 9.9 (0.3)
High-Probability Phrases 7.9 (0.4) 7.8 (0.4) 7.7 (0.8) Low-Probability Phrases 7.8 (0.4) 7.7 (0.6) 7.6 (0.9)
Naming
Responsive 26.9 (0.2) 26.8 (0.6) 26.8 (0.7) Visual Confrontation+ 113.2 (1.8) 111.6 (4.2) 109.9 (7.7)
Animal Fluency 23.5 (9.7) 22.6 (6.7) 19.4 (7.3)
Oral Reading
Words 29.8 (0.7) 29.8 (0.5) 29.4 (2)
Sentences 9.9 (0.2) 9.9 (0.3) 9.6 (1.3)
Reading Comprehension
Symbol Discrimination 10 (0) 9.8 (0.4) 9.8 (0.4) Word Recognition 8 (0.4) 7.9 (0.5) 7.9 (0.3) Comprehension of Oral Spelling** 7.4 (1.5) 7 (1.6) 5.8 (2.4) Word-Picture Matching 9.8 (0.6) 9.7 (1.6) 9.8 (0.8) Sentences and Paragraphs 9.7 (0.5) 9.4 (0.7) 9.2 (1.3)
Writing
Writing Mechanics 4.9 (0.3) 4.9 (0.4) 4.8 (0.5) Serial Writing 45.9 (1.4) 45.5 (2) 44.2 (4.5) Primer-Level Dictation 14.8 (0.5) 14.7 (1) 14.3 (1.7) Spelling to Dictation 9.8 (0.4) 9.6 (0.9) 8.9 (2) Written Confrontation Naming++ 10 (0) 9.8 (0.7) 9.4 (1.7)
Narrative Writing 4.7 (0.6) 4.7 (0.7) 4.4 (1) Sentences to Dictation# 12 (0) 11.9 (0.4) 11.2 (2.1)
Data are reported as means (SD) for 107 subjects.
*P < 0.05 for A vs C and B vs C. +P < 0.05 for A vs B and A vs C. **P < 0.05 for A vs C
and B vs C; ++P < 0.05 for A vs C. #P < 0.05 for A vs C and B vs C (Kruskal-Wallis with
frontation Naming and Sentences to Dicta-tion) reflect the sensitivity of these tasks not only to the instrumental abilities related to the phoneme-grapheme conversion and spelling irregularities, but also to the ability of
process-ing verbal material in short-term memory (11). The results of the present study show that the continuum of changes effected by formal instruction goes beyond the first years of elementary school and reveal that the effects of its deprivation in language tasks can be felt throughout the “Fundamental Level” (the first 8 years of schooling in Brazil). In fact, 9 years of education are necessary for indi-viduals to exhibit average scores that can almost equal the maximum possible score for each task - the expected result in a diag-nostic test which has been designed to differ-entiate normal individuals from those neuro-logically impaired - where specificity is more important. It is interesting to note that the authors of the BDAE validated the test on a population whose education ranged from less than eight grade through college (12), and where the mean was within a fraction of a point of the maximum possible score in most subtests. The few exceptions are in-variably found in the group of subjects over 60 years of age with fewer than 9 years of schooling (1).
Although there is wide propagation of knowledge by the communication media in modern life, thereby providing alternative ways for the acquisition of knowledge and for the cognitive functioning of less edu-cated individuals, we observed that school attendance can still cause significant differ-ences in the domain of metaknowledge re-quested by language tests such as the BDAE. In other words, this knowledge, although alternative, is not compensatory, as pointed out by Tfouni (13). On the other hand, for-mal education in school, by itself, does not guarantee the subject’s engagement in the social practices that require the interpreta-tion of complex texts or writing. Regarding this issue, it is well known that many indi-viduals who attend school still exhibit poor linguistic skills and can be considered to be functional illiterates (when presenting reading competence compatible with 0 to 4 years of schooling) or to be marginally literate
(com-Table 4. Performance of subjects on the Boston Diagnostic Aphasia Examination by educational level.
Subtest Years of schooling
1-8 9 or more
Oral Comprehension
Word Discrimination 69.3 (4.8) 71.5 (1.6)*
Body-Part Identification 19.1 (1.1) 19.7 (0.6)*
Commands 14.4 (1.4) 14.9 (0.7)*
Complex Ideational Material 9.9 (1.8) 11.3 (0.9)*
Oral Agility
Nonverbal Agility 8.6 (2.2) 9.6 (2)*
Verbal Agility 11.9 (2) 13 (1.3)*
Automatized Sequences 7.7 (0.6) 7.9 (0.3)*
Recitation 1.8 (0.4) 1.9 (0.2)*
Repetition
Words 9.9 (0.4) 10 (0)*
High-Probability Phrases 7.6 (0.9) 7.9 (0.3)*
Low-Probability Phrases 7.5 (1) 7.8 (0.4)*
Naming
Responsive 26.8 (0.6) 26.9 (0.5)
Visual Confrontation 109.2 (8.4) 112.4 (3)*
Animal Fluency 18.2 (6.5) 23.6 (8)*
Oral Reading
Words 29.3 (2.2) 29.9 (0.5)*
Sentences 9.5 (1.4) 9.9 (0.2)*
Reading Comprehension
Symbol Discrimination 9.7 (0.5) 9.9 (0.2)*
Word Recognition 7.9 (0.5) 8 (0.3)
Comprehension of Oral Spelling 5.4 (2.5) 7.3 (1.2)*
Word-Picture Matching 9.5 (1.6) 9.9 (0.4)
Sentences and Paragraphs 8.9 (1.3) 9.7 (0.5)*
Writing
Writing Mechanics 4.7 (0.6) 4.9 (0.1)*
Serial Writing 43.7 (4.8) 45.8 (1.5)*
Primer-Level Dictation 14.1 (2) 14.8 (0.4)*
Spelling to Dictation 8.5 (2.2) 9.9 (0.3)*
Written Confrontation Naming 9.2 (1.9) 9.9 (0.2)*
Narrative Writing 4.2 (1.2) 4.8 (0.4)*
Sentences to Dictation 11 (2.3) 11.9 (0.2)*
Data are reported as means (SD).
patible with 5 to 8 years of schooling) (8,14). The analysis of performance by age sub-group showed that this variable had no influ-ence on most subtests (Table 3). Although we detected differences in some tasks (Com-plex Ideational Material, Visual Confronta-tion Naming, Comprehension of Oral Spell-ing, Written Confrontation NamSpell-ing, and Sen-tences to Dictation), the coexistence of sta-tistically significant differences in educa-tional level among these groups does not allow us to attribute these results to the variable age alone. All of these tasks were influenced by the educational level of the subjects.
Based on the differences in performance found in relation to schooling, we propose the use of two cut-off scores in our population, as shown in Table 1. Although this study was conducted in São Paulo, we believe that the reference values are valid for the Brazilian population as a whole, because the only lexi-cal item that reflects a regional particularity for naming is “cactus”, which in some regions of the country can also be named “mandacaru” or “palma”. The remainder of the test contains items whose naming and meaning are the same for the whole country. It is worth empha-sizing that the recognition of the limitations caused by the lack of education is essential in order to minimize the occurrence of false-positive results for less educated individuals, leading to an overdiagnosis of language distur-bances in normal subjects.
Acknowledgments
The authors would like to thank the un-dergraduate students of the Speech Patholo-gy Course, Faculdade de Medicina, Univer-sidade de São Paulo, for collecting the data.
Table 5. Performance of subjects on the Boston Diagnostic Aphasia Examination by educational level.
Subtest Years of schooling
1-4 5-8
Oral Comprehension
Word Discrimination 68 (5.7) 71.2 (1.7)*
Body-Part Identification 18.9 (1.3) 19.5 (0.6)
Commands 14.2 (1.6) 14.6 (1)
Complex Ideational Material 9.5 (2) 10.6 (1.3)
Oral Agility
Nonverbal Agility 8.2 (2.1) 9.1 (2.3)
Verbal Agility 11.7 (1.6) 12.2 (2.7)
Automatized Sequences 7.7 (0.6) 7.6 (0.5)
Recitation 1.7 (0.5) 1.9 (0.2)
Repetition
Words 9.8 (0.4) 10 (0)
High-Probability Phrases 7.5 (1.2) 7.7 (0.4) Low-Probability Phrases 7.3 (1.2) 7.8 (0.4)
Naming
Responsive 26.7 (0.6) 26.7 (0.5)
Visual Confrontation 106.9 (9.9) 112.9 (2.3)*
Animal Fluency 18 (7) 18.6 (5.2)
Oral Reading
Words 28.9 (2.6) 29.8 (0.8)
Sentences 9.3 (1.8) 9.9 (0.3)
Reading Comprehension
Symbol Discrimination 9.6 (0.6) 9.9 (0.2)
Word Recognition 7.8 (0.7) 8 (0)
Comprehension of Oral Spelling 5.1 (2.7) 5.7 (2.3)
Word-Picture Matching 9.2 (2) 10 (0)
Sentences and Paragraphs 8.5 (1.5) 9.5 (0.6)*
Writing
Writing Mechanics 4.7 (0.7) 4.8 (0.4)
Serial Writing 43 (5.5) 44.6 (3.6)
Primer-Level Dictation 13.6 (2.4) 14.9 (0.3)*
Spelling to Dictation 8.2 (2.4) 9 (1.8)
Written Confrontation Naming 8.9 (2.3) 9.6 (1)
Narrative Writing 4 (1.3) 4.5 (0.7)
Sentences to Dictation 10.8 (2.7) 11.5 (1.5)
Data are reported as means (SD).
*P < 0.05 compared to 1-4 years of schooling (Mann-Whitney test).
References
1. Goodglass H & Kaplan E (1983). The Assessment of Aphasia and Related Disorders. 2nd edn. Lea & Febiger, Philadelphia, PA, USA. 2. Radanovic M & Mansur LL (2002). Performance of a Brazilian
3. Pineda DA, Rosselli M, Ardila A, Mejia SE, Romero MG & Pérez C (2000). The Boston Diagnostic Aphasia Examination - Spanish Ver-sion: Influence of demographic variables. Journal of the Interna-tional Neuropsychological Society, 6: 802-814.
4. Bertolucci PHF, Brucki SMD, Campacci SR & Juliano Y (1994). O Mini-Exame do Estado Mental em uma população geral. Impacto da escolaridade. Arquivos de Neuro-Psiquiatria, 52: 1-7.
5. Bertolucci PHF, Mathias SC, Brucki SMD, Carrilho PEM, Okamoto IH & Nitrini R (1994). Proposta de padronização do Mini-Exame do Estado Mental (MEEM): estudo piloto cooperativo (FMUSP/EPM).
Arquivos de Neuro-Psiquiatria, 52 (Suppl): P-225.
6. Di Pierro MC (2001). Decentralization and partnership: an assess-ment of the education of youngsters and adults in the Brazilian educational reform. Educação e Pesquisa, 27: 322-337.
7. Kleiman AB (2001). Development programs and research: the con-tribution of literacy studies to the education of youngsters and adults. Educação e Pesquisa, 27: 268-281.
8. Moreira DA (2003). Analfabetismo Funcional: O Mal Nosso de Cada Dia. Thomson, São Paulo, SP, Brazil.
9. Kamhi AG & Catts HW (1989). Language and reading convergences, divergences, and development. In: Kahmi AG & Catts HW (Editors),
Reading Disabilities - A Developmental Language Perspective. Col-lege-Hill Publication, Little, Brown and Company, Boston, MA, USA. 10. Brucki SM, Malheiros SM, Okamoto IH & Bertolucci P (1997). Normative data on the verbal fluency test in the animal category in our milieu. Arquivos de Neuro-Psiquiatria, 55: 56-61.
11. Kolinsky R (1996). Conséquences cognitives de l’illetrisme. In: Car-bonnell S, Gillet PM-D, Martory M-D & Valdois S (Editors), Approche Cognitive des Troubles de la Lecture et de l’Écriture Chez l’Enfant et l’Adulte. Collection Neuropsychologie, Solal, Marseille, France. 12. Borod J, Goodglass H & Kaplan E (1980). Normative data on the
Boston Diagnostic Aphasia Examination, parietal lobe battery and Boston Naming Test. Journal of Clinical Neuropsychology, 2: 209-216.
13. Tfouni LV (1988). Adultos Não Alfabetizados: O Avesso do Avesso. Pontes, Campinas, SP, Brazil.