OSD
12, 2473–2496, 2015Indian Ocean Dipole modulated wave climate of eastern
Arabian Sea
T. R. Anoop et al.
Title Page
Abstract Introduction
Conclusions References
Tables Figures
◭ ◮
◭ ◮
Back Close
Full Screen / Esc
Printer-friendly Version Interactive Discussion
Discussion
P
a
per
|
Discussion
P
a
per
|
Discussion
P
a
per
|
Discussion
P
a
per
|
Ocean Sci. Discuss., 12, 2473–2496, 2015 www.ocean-sci-discuss.net/12/2473/2015/ doi:10.5194/osd-12-2473-2015
© Author(s) 2015. CC Attribution 3.0 License.
This discussion paper is/has been under review for the journal Ocean Science (OS). Please refer to the corresponding final paper in OS if available.
Indian Ocean Dipole modulated wave
climate of eastern Arabian Sea
T. R. Anoop1, V. Sanil Kumar1, P. R. Shanas2, G. Johnson1, and M. M. Amrutha1
1
Ocean Engineering, CSIR-National Institute of Oceanography, Council of Scientific & Industrial Research, Dona Paula, Goa 403004, India
2
Marine Physics department, King Abdulaziz University, Jeddah, Saudi Arabia
Received: 8 September 2015 – Accepted: 10 October 2015 – Published: 27 October 2015
Correspondence to: V. S. Kumar ([email protected])
OSD
12, 2473–2496, 2015Indian Ocean Dipole modulated wave climate of eastern
Arabian Sea
T. R. Anoop et al.
Title Page
Abstract Introduction
Conclusions References
Tables Figures
◭ ◮
◭ ◮
Back Close
Full Screen / Esc
Printer-friendly Version Interactive Discussion
Discussion
P
a
per
|
Discussion
P
a
per
|
Discussion
P
a
per
|
Discussion
P
a
per
Abstract
Intrinsic modes of variability have a significant role in driving climatic oscillations in the ocean. In this paper, we investigate the influence of inter-annual variability, the Indian Ocean Dipole (IOD), on the wave climate of the eastern Arabian Sea (AS). Using measured, modeled and reanalysis wave data and reanalysis wind data, we
5
show that the IOD plays a major role in the variability of wave climate of the study region due to the IOD induced changes in equatorial sea surface temperature and sea level pressure. Inter-annual variability in the wave climate over the eastern AS during the IOD is due to the modification of winds from the northern AS. The change in wind field over the AS due to IOD influences the generation or dissipation of wave field and
10
hence causes the decrease in northwest short period waves during positive IOD and increase during negative IOD.
1 Introduction
The north Indian Ocean (IO) is unique compared to the northern Atlantic and Pacific oceans, because of the land locked northern boundary, the wind pattern in this region
15
shows semiannual reversal and causes boreal summer (June–September) and winter (December–February) monsoons (Anoop et al., 2015). The monsoon wind patterns in the north IO affects the spatial distribution of sea surface temperature (SST) in tropical IO which differs from that observed in Pacific and Atlantic that are warmer in the west (Vinayachandran et al., 2009). In the IO, warm water is in the east and colder water is
20
in the west (Vinayachandran et al., 2009). This SST distribution overturns during the coupled oceanic and atmospheric phenomena in the equatorial IO known as Indian Ocean dipole (IOD) (Saji et al., 1999). In equatorial IO, IOD appears as a dominant contributor of SST variability during the boreal fall season (October–December) (Saji and Yamagatta, 2003). About 12 % of the SST variability in the IO is associated with
OSD
12, 2473–2496, 2015Indian Ocean Dipole modulated wave climate of eastern
Arabian Sea
T. R. Anoop et al.
Title Page
Abstract Introduction
Conclusions References
Tables Figures
◭ ◮
◭ ◮
Back Close
Full Screen / Esc
Printer-friendly Version Interactive Discussion
Discussion
P
a
per
|
Discussion
P
a
per
|
Discussion
P
a
per
|
Discussion
P
a
per
|
lution between the eastern and western tropical IO (Saji et al., 2003) and the regions of positive anomaly (during positive IOD (PIOD)) continuously vary with year (Vinay-achandran et al., 2009). The PIOD event is associated with decreases (increases) of SST and increases (decreases) of sea level pressure over the eastern (western) trop-ical IO. The negative phase of the IOD is the intensification of the normal condition
5
(Vinayachandran et al., 2009). The Dipole Mode Index (DMI) is the quantitative repre-sentation of strength of IOD and is a measure of the anomalous zonal SST gradient across the equatorial IO. It is defined as the difference between SST anomaly in a west-ern (60–80◦E, 10◦S–10◦N) and an eastern (90–110◦E, 10–0◦S) box. Seasonal phase
locking is the important characteristic of the DMI time series, thus a significant anomaly
10
may appear in June and peak in October. It is moderately correlated with nino3 (ENSO) index, but it is strongly correlated with equatorial winds over the IO (Saji et al., 1999). Monthly DMI are available in the website of Japan Agency of Marine-Earth Science and Technology (www.jamstec.go.jp).
The tropical IO displays strong inter-annual climate variability associated with the
15
El Niño–Southern Oscillation (ENSO) and IOD (Murtugudde et al., 2000; Slingo and Annamalai, 2000). Baquero-Bernal et al. (2002) found that IOD shows good correla-tion with ENSO in the equatorial Pacific Ocean. However, the correlacorrela-tion between the strength of ENSO and IOD is not linear (Shimoda and Han, 2005). IOD co-occurring with ENSO are forced by a zonal wind shift in the descending branch of Walker
circula-20
tion in the eastern IO, but the processes that initiate IOD in the absence of ENSO are not clear (Vinayachandran et al., 2009).
The annual cycle of the surface wind field over the IO is dominated by the alteration between boreal summer and winter monsoon seasons. Strong westerly in the equato-rial IO is limited during short transition period between the monsoons. The equatoequato-rial
25
OSD
12, 2473–2496, 2015Indian Ocean Dipole modulated wave climate of eastern
Arabian Sea
T. R. Anoop et al.
Title Page
Abstract Introduction
Conclusions References
Tables Figures
◭ ◮
◭ ◮
Back Close
Full Screen / Esc
Printer-friendly Version Interactive Discussion
Discussion
P
a
per
|
Discussion
P
a
per
|
Discussion
P
a
per
|
Discussion
P
a
per
IO (Reverdin, 1985; Murtugudde et al., 2000; Saji et al., 1999; Webster et al., 1999; Sreenivas et al., 2012). The IOD forced wind anomalies are maximum in the central equatorial IO (Sreenivas et al., 2012) and the significant anomalies appear around June, intensify in the following months and peak in October. The anomalous easterlies weaken the eastward Wyrtki jets (Wyrtki, 1971) in the equatorial IO (Reverdin, 1985).
5
The wind anomaly produced during IOD has longer duration, but the wind anomaly with ENSO present has shorter duration (Rao et al., 2002).
The wave climate of eastern AS shows large response to seasons due to the al-teration of surface winds between boreal summer and winter monsoon seasons (Gle-jin et al., 2013a; Kumar et al., 2014). Apart from seasons, other locally and remotely
10
generated waves also influence the wave climate of this region (Neetu et al., 2006; Aboobacker et al., 2011; Glejin et al., 2013a, b; Anoop et al., 2014). Even though the influence of IOD on the wind pattern of IO is reported (Saji et al., 1999), the role of this event on the wind generated wave climate of IO is not yet studied. Glejin et al. (2013c) pointed out the possibility of influence of IOD on the wave climate of southeast coast
15
of India, but further analysis on this topic in this region has not been carried out. Most of the studies in the past have focused on the influence of IOD on the wind pattern of equatorial IO.
In this paper, we examine the impact of IOD on the surface wind field of Arabian Sea and its impact on the wave climate of eastern Arabian Sea. Figure 1a shows the study
20
area. The data sets used in this study and the details of the numerical models are described in Sect. 2. Section 3 describes results and discussion, and the main findings are summarized in Sect. 4.
2 Data and methods
The major challenge for the wave climate study in eastern AS is the scarcity of
long-25
OSD
12, 2473–2496, 2015Indian Ocean Dipole modulated wave climate of eastern
Arabian Sea
T. R. Anoop et al.
Title Page
Abstract Introduction
Conclusions References
Tables Figures
◭ ◮
◭ ◮
Back Close
Full Screen / Esc
Printer-friendly Version Interactive Discussion
Discussion
P
a
per
|
Discussion
P
a
per
|
Discussion
P
a
per
|
Discussion
P
a
per
|
2014) and offHonnavar (available from 2008 to 2014) offcentral west coast of India. Among these, Ratnagiri is the northern and Honnavar is the southern location and these locations are spaced at ∼350 km apart. The details of the data analysis are similar to that presented in Kumar et al. (2014). The spectral climatology of the study area is presented by Kumar and Anjali (2015).
5
Due to scarcity of sufficient measured data, we used reanalysis product of ECMWF (European Centre for Medium-Range Weather Forecasts) (i) ERA-40 (Uppalla et al., 2005) for the period 1958–1978 and (ii) ERA-Interim (Dee et al., 2011) for the period 1979–2014 for deriving the wind climatology. Spatial resolution of ERA-40 is 1.5◦
× 1.5◦ and ERA-Interim is 1◦
×1◦. ERA-Interim is the improved version of ERA-40 and it
10
shows marked improvement for wind and wave data from ERA-40 (Dee et al., 2011). Performance of ERA-Interim was evaluated over tropical and north IO and showed good performance with observation for wind and wave (Kumar et al., 2013; Shanas and Kumar, 2014; Kumar and Naseef, 2015). For SST data we used the daily averaged Tropflux SST with 1◦
×1◦resolution from 1979 to 2014 (Kumar et al., 2012).
15
In order to simulate the directional wave spectrum at the buoy location, we have used the coupled system which includes the third-generation spectral wave models WAVE-WATCH III (WW3) 4.18 and Simulating Waves Nearshore (SWAN) 41.01. WW3 is the wave model developed by NOAA/NCEP (Tolman, 1991, 2009) and is based on finite difference solving of the energy balance equation of the spectral wave action in the
ap-20
proximation of phase averaging. The coastal wave model SWAN is a third-generation, phase averaged numerical wave model for the simulation of waves in waters of deep, in-termediate and finite depth (Booij et al., 1999). The physical parameterization of model physics of WW3 is described in several works (e.g. Tolman, 1991, 2009) and that for SWAN by Booij et al. (1999), Ris et al. (1999) and Bunney (2011). We have
imple-25
mented a coarser resolution WW3 model with a resolution of 0.25◦
×0.25◦ in latitude and longitude covering the entire domain in the IO (20–78◦E and 70◦S
−35◦N) and a SWAN model with relatively finer grid of 1 min in the NIO (70–75◦E and 10–20◦N).
OSD
12, 2473–2496, 2015Indian Ocean Dipole modulated wave climate of eastern
Arabian Sea
T. R. Anoop et al.
Title Page
Abstract Introduction
Conclusions References
Tables Figures
◭ ◮
◭ ◮
Back Close
Full Screen / Esc
Printer-friendly Version Interactive Discussion
Discussion
P
a
per
|
Discussion
P
a
per
|
Discussion
P
a
per
|
Discussion
P
a
per
the world (ETOPO1) database (Amante and Eakins, 2009) available from the National Geophysical Data Centre (NGDC, United States).
Wave frequencies were discretized over 25 bins from 0.04 to 1 Hz on a logarithmic scale; direction was binned into 36 intervals of 10◦each. The coarser model WW3 runs
were done using physical processes contained in source term package-2 (ST2)
(Tol-5
man and Chalikov, 1996) and the two dimensional energy density spectra of time se-ries obtained from it are used as the boundary conditions for the higher-resolution near shore wave model SWAN. WW3 terms included depth induced breaking (Hasselmann et al., 1973) and bottom friction. The wind growth and white capping (Komen et al., 1984), quadruplet and triad interaction processes were activated. The wave model is
10
driven by the 10 m surface wind fields from ERA-Interim at every 6 h interval.
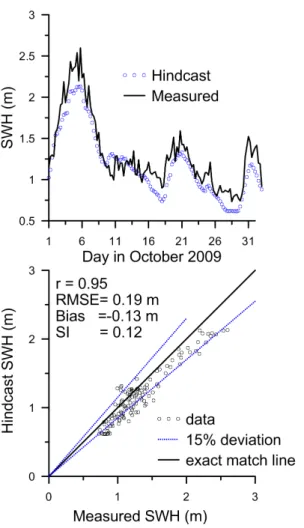
Comparison of the significant wave height (SWH) estimated in deep water with WW3 used measured wave data collected using a moored Seatex buoy (Oceanor, Norway) under the National Data Buoy Programme (Premkumar et al., 2000) at AS2 location in the AS (15.00◦N; 69.00◦E; water depth
∼3000 m) during October–December 2009.
15
The heave data of the buoy is recorded at 2 Hz for 17 min duration and from the recorded heave data, the wave spectrum is obtained through fast Fourier Transform and the SWH is estimated from the zeroth spectral moment (m0) as SWH=4√m0. For quantitative comparison between measured and model output, several error statis-tics have been determined; Pearson’s linear correlation coefficientr, root-mean-square
20
(RMS) error, bias, and scatter index (SI).
Comparison of the hindcast SWH with the measured SWH at the deep water location shows that the hindcast values are mostly within 15 % of the measured SWH (Fig. 2). The RMS error indicates that the major errors in the hindcast SWH do not exceed 0.19 m and the model underestimates the SWH values. The scatter index indicates low
25
OSD
12, 2473–2496, 2015Indian Ocean Dipole modulated wave climate of eastern
Arabian Sea
T. R. Anoop et al.
Title Page
Abstract Introduction
Conclusions References
Tables Figures
◭ ◮
◭ ◮
Back Close
Full Screen / Esc
Printer-friendly Version Interactive Discussion
Discussion
P
a
per
|
Discussion
P
a
per
|
Discussion
P
a
per
|
Discussion
P
a
per
|
3 Results and discussion
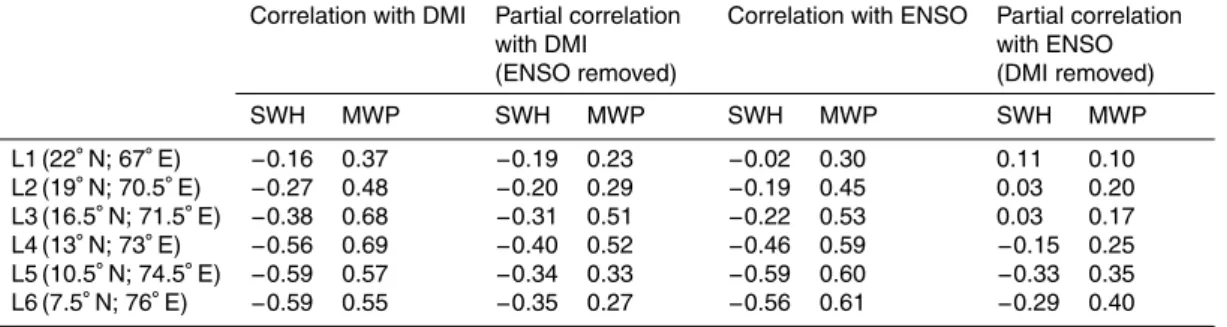
The months of October and November are the calm period for the AS (Glejin et al., 2013a), and during this time the DMI reaches its maximum value. For this particular period we examined the role of DMI on the wave climate of eastern AS and observed that during October surface waves in this region show response to DMI. We selected
5
six locations (Fig. 1a) along the eastern AS which are at more than 100 km away from the coast of India (Table 1). The time series of SWH and mean wave period (MWP) with DMI from 1979 to 2013 are shown in Fig. 3a. Correlation and partial correlation of the wave parameters with DMI and SOI (southern oscillation index) are shown in Table 1 and it shows that SWH is negatively related and MWP is positively related to
10
DMI. The influence of IOD increases towards south, but after removing ENSO (SOI) the correlation values in all locations decreases and maximum correlation is observed in the central AS (location L4). This implies that if influences of ENSO are removed, then IOD have more impact on the central eastern AS. Impact of ENSO with and without IOD is checked here and identified that without IOD, the impact of ENSO is significant
15
only in the southern part of eastern AS. From this it is certain that in the eastern AS region IOD has more impact than ENSO and its effect is dominant offthe central west coast of India. The anomaly in the SWH varies between−0.2 and 0.4 m and that for MWP from −2 to 1 s. Maximum SWH and MWP anomaly is observed during 1997, which is the strongest IOD year for the study period.
20
The composite climatology (using ERA-40 and ERA-I) of October wind pattern (from 1958 to 2014) of AS and a part of equatorial IO is shown in Fig. 1b. The eastern AS region shows comparatively strong wind compared to the western AS. The wind from the northern AS passes parallel to the Indian west coast to eastern equatorial IO after merging with equatorial westerly, while over the central AS the wind vectors are from
25
east-OSD
12, 2473–2496, 2015Indian Ocean Dipole modulated wave climate of eastern
Arabian Sea
T. R. Anoop et al.
Title Page
Abstract Introduction
Conclusions References
Tables Figures
◭ ◮
◭ ◮
Back Close
Full Screen / Esc
Printer-friendly Version Interactive Discussion
Discussion
P
a
per
|
Discussion
P
a
per
|
Discussion
P
a
per
|
Discussion
P
a
per
ern equatorial IO due to the warm water in this region compared to western equatorial IO (Vinayachandran et al., 2009).
Pure positive IOD and combined events are considered following Aparna et al. (2012). A pure IOD event is that which occurred in the absence of an ENSO event (Rao et al., 2002). A positive (negative) IOD event that co-occurred with an El Niño (La
5
Nina) is a combined IOD event. A pure ENSO event is defined similarly. The combined events are strong only if both El Niño and positive IOD events are strong. Figure 1c and d is the wind pattern during pure positive and combined IOD events respectively and these figures illustrate the wind pattern in the eastern AS, the north-westerly wind vectors being modified to north-easterly as observed from its climatology. Instead of
10
going to eastern equatorial IO it blows to western IO. This can be perceived as more strong in combined event of PIOD with comparatively weak wind vectors along the southwest of India. During the NIOD events (Fig. 1e and f) wind blows over the central and eastern AS as north-westerly which is in contrast to the wind pattern during PIOD. This modification in the wind pattern over the central AS to either westward or eastward
15
direction from its general climatology pattern during the PIOD or NIOD events is due to the IOD induced temperature variability in the equatorial IO.
Measured frequency-directional spectra of surface waves from the two locations off the central west coast of India are shown in Fig. 4. The wind pattern of corresponding years is shown in Fig. 4a and year wise SST anomaly in west, east and DMI index
20
for October is shown in Fig. 3a and b. For the years 2008–2014, it can be seen that maximum positive DMI index is observed during 2011 (Fig. 3a). During this year the wind in eastern AS has shifted its direction as north-easterly. Its influence is clearly visible in the frequency-directional spectrum of waves at Ratnagiri and Honnavar, as the decrease in short period waves from northwest (NW) direction. This difference in
25
OSD
12, 2473–2496, 2015Indian Ocean Dipole modulated wave climate of eastern
Arabian Sea
T. R. Anoop et al.
Title Page
Abstract Introduction
Conclusions References
Tables Figures
◭ ◮
◭ ◮
Back Close
Full Screen / Esc
Printer-friendly Version Interactive Discussion
Discussion
P
a
per
|
Discussion
P
a
per
|
Discussion
P
a
per
|
Discussion
P
a
per
|
short period wave energy. Similar patterns are observed in other years such as 2008, 2012 and 2014 which has got comparatively higher DMI.
In contrast to the above, the only year with negative DMI during 2008 to 2014 is in 2010. During 2010, the wind pattern is in NW direction and dominance of short waves from NW is higher. Similar pattern can be seen in 2009 and 2013 as these years
5
also have low DMI index. Unlike PIOD, during negative IOD (NIOD), the short period waves are slightly higher at Ratnagiri than at Honnavar and this may be due to the dissipation of the waves from NW due to the larger distance travelled by the waves to reach Honnavar than Ratnagiri. From Fig. 3b we can see that maximum positive anomaly in SST of western equatorial IO since 2008 is observed in 2009. However, the
10
influences of high SST anomalies are not observed either in the wind pattern or wave climate. This depicts that the modification of wind vectors not only depends on the SST anomaly in the west or east separately but also on the DMI index.
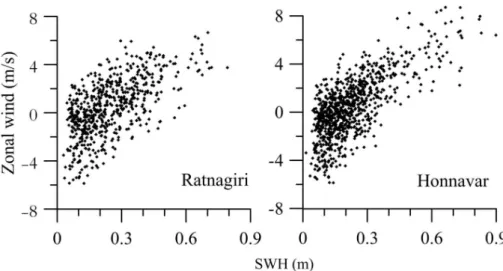
To confirm the influence of IOD induced turning wind pattern (Fig. 1b–f) on the waves offthe west coast of India, we spatial averaged the zonal wind component within the
re-15
gion where wind shows alteration in its direction (14–20◦N; 70–73◦E) and averaged the
short period waves within 0.14–0.29 Hz frequency and 280–320◦direction. The scatter
plot for both zonal wind and measured SWH in this particular direction and frequency range offRatnagiri and offHonnavar for all years are shown in Fig. 5. From the figure it can be seen that the zonal wind component in this region has a direct influence to
20
the wave climate of this region. For the positive value of zonal wind component, the influence on SWH is greater and it shows relatively higher SWH, but for negative value of zonal wind the influence is less.
The modelled frequency-directional spectrum offRatnagiri and Honnavar from 2010 to 2014 is shown in Fig. 4d and e. Comparison of measured (Fig. 4b and c) and
mod-25
elled spectra off Honnavar and Ratnagiri shows that the spectral energy is overesti-mated by the model since the ERA-Interim wind data used in the study is with a coarser resolution of 1◦
spec-OSD
12, 2473–2496, 2015Indian Ocean Dipole modulated wave climate of eastern
Arabian Sea
T. R. Anoop et al.
Title Page
Abstract Introduction
Conclusions References
Tables Figures
◭ ◮
◭ ◮
Back Close
Full Screen / Esc
Printer-friendly Version Interactive Discussion
Discussion
P
a
per
|
Discussion
P
a
per
|
Discussion
P
a
per
|
Discussion
P
a
per
tra. The influence of altering wind pattern is clearly evident in the modelled spectra as well.
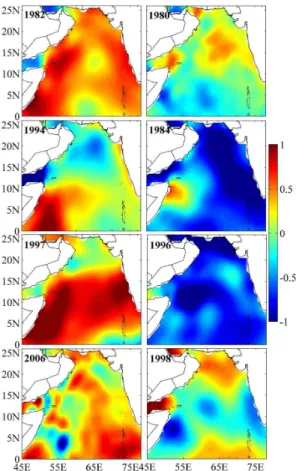
Influences of IOD on the temperature variability of the north IO are shown in Fig. 6. Here, we considered comparatively strong PIOD and NIOD events from 1979 to 2014. The PIOD years are 1982, 1994, 1997 and 2006 (left panel of Fig. 6). Among these, in
5
1994 IOD occurred in the absence of ENSO. The NIOD years are 1980, 1984, 1996 and 1998 (right panel). This SST variability produces variability in SLP (Fig. 7). It causes decrease of SLP in the western equatorial Indian Ocean and an increase of SLP in eastern equatorial IO (not shown in this figure) during the positive phase of IOD and vice versa for negative IOD. The wind pattern of the respective years for AS and part
10
of equatorial IO are shown in same figure. This low pressure system developed over the western and high pressure system in eastern equatorial IO (for positive phase of IOD) forces the modification of wind vectors in AS as discussed earlier. Since the NIOD is the intensification of the normal condition of October (Vinayachandran et al., 2009), the SLP in western equatorial IO is higher and lower in eastern equatorial IO. Hence,
15
the winds from the northern AS will propagate towards eastern equatorial IO along eastern AS. This is the influence of IOD induced temperature variability on SLP and wind direction.
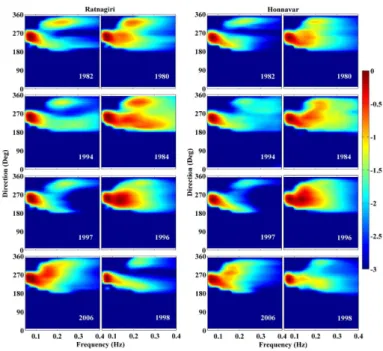
Since the performance of numerical model is good we have carried out further anal-ysis using this model for the period where measured data is not available. Simulated
20
directional spectra for the years 1980, 1982, 1984, 1994, 1996, 1997, 1998 and 2006 are shown in Fig. 8. Column one and three are for PIOD years off Ratnagiri and off
Honnavar respectively, similarly column 2 and 4 are for NIOD years. From the figure it is evident that for the positive phase of IOD, the short period waves from the NW direction is less at both locations, whereas in 2006 it shows a conflicting result. From
25
OSD
12, 2473–2496, 2015Indian Ocean Dipole modulated wave climate of eastern
Arabian Sea
T. R. Anoop et al.
Title Page
Abstract Introduction
Conclusions References
Tables Figures
◭ ◮
◭ ◮
Back Close
Full Screen / Esc
Printer-friendly Version Interactive Discussion
Discussion
P
a
per
|
Discussion
P
a
per
|
Discussion
P
a
per
|
Discussion
P
a
per
|
Similar pattern, but comparatively less spatial extension in wind vectors towards south is also evident during 1982 (Fig. 7).
In case of 1996, which is the strongest NIOD event considered for this study, we expect a more evident signature in SWH at the study locations: Ratnagiri and Hon-navar. However, in the wave spectrum its signature is weaker than that observed in
5
1980 and 1984. Wind pattern observed during the period, in 1996, is northerly down to 15◦N then it turns as north-westerly and propagates towards eastern equatorial IO
(Fig. 7). This makes the region over central west coast of India as calm area due to the change in wind pattern over the region which arises from the negative SLP anomaly at north of central west coast of India. The change in wind pattern from the composite
10
climatology of NIOD events (Fig. 1e and f) causes the weakening of short period waves arriving from the NW and corresponding influence in directional wave spectra. Similarly the second strongest NIOD events occurred in 1998, but the signature of this event is absent in the wave climate. This is due to the absence of NW winds in northern AS due to the associated negative SST anomaly, leading to the north-eastern AS region being
15
calm.
4 Conclusions
We analysed the wind pattern over the AS and examined the influence of IOD events on the wave climate of eastern Arabian Sea using reanalysis, observation, and model datasets. Analysis of wind pattern influenced by the IOD has been carried out by
par-20
tially removing the influence of ENSO from IOD and vice versa. It has been found that IOD has significant influence on the wave climate offcentral west coast of India compared to the northern and southern parts. The decrease of wave height is due to the decrease of short period waves from northwest direction. Wind blowing from the northern AS is the major determining factor on wave climate. In general, climatology of
25
OSD
12, 2473–2496, 2015Indian Ocean Dipole modulated wave climate of eastern
Arabian Sea
T. R. Anoop et al.
Title Page
Abstract Introduction
Conclusions References
Tables Figures
◭ ◮
◭ ◮
Back Close
Full Screen / Esc
Printer-friendly Version Interactive Discussion
Discussion
P
a
per
|
Discussion
P
a
per
|
Discussion
P
a
per
|
Discussion
P
a
per
SST anomaly which brings a weakening of wind field over the central and south of central west coast of India. Whereas, during NIOD events wind vectors turn to north-westerly instead of northerly winds in the composite climatology over the region during October. This PIOD change in direction of wind pattern in AS causes the decrease in wave height offcentral and south of central west coast of India. The signature of IOD
5
on the wave climate mainly depends on the modification of wind field induced by the phase of IOD events. If this wind pattern is absent even during strong IOD event, then the signature of IOD on the wave climate is also absent. This alteration of wind pattern mainly depends on the IOD induced SST variability in eastern and western equatorial IO. Some other unknown factors may also cause slight modification in the wind,
requir-10
ing more analysis to understand this variability. From this study it is clear that IOD has an impact on the wave climate off west coast of India especially off the central west coast of India due to the decrease of north-westerly short period waves.
Acknowledgement. Authors acknowledge the CSIR, New Delhi for funding the wave
measure-ment at Honnavar and ESSO-INCOIS, Ministry of Earth Sciences, Governmeasure-ment of India for
15
funding the wave measurement at Ratnagiri. The director CSIR-NIO, Goa provided encourage-ment to carry out the study. The deep water buoy data used for validation of numerical model was collected by National Institute of Ocean Technology, Chennai and provided by Indian Na-tional Centre for Ocean Information Services (INCOIS) Ministry of Earth Sciences, Hyderabad. T. M. Balakrishnan Nair, Arun Nherakkol and Jai Singh provided support during data collection.
20
This work forms part of the PhD thesis of the first author.
References
Aboobacker, V. M., Rashmi, R., Vethamony, P., and Menon, H. B.: On the dominance of pre-existing swells over wind seas along the west coast of India, Cont. Shelf Res., 31, 1701– 1712, 2011.
25
Atmo-OSD
12, 2473–2496, 2015Indian Ocean Dipole modulated wave climate of eastern
Arabian Sea
T. R. Anoop et al.
Title Page
Abstract Introduction
Conclusions References
Tables Figures
◭ ◮
◭ ◮
Back Close
Full Screen / Esc
Printer-friendly Version Interactive Discussion
Discussion
P
a
per
|
Discussion
P
a
per
|
Discussion
P
a
per
|
Discussion
P
a
per
|
Anoop, T. R., Kumar, V. S., and Glejin, J.: A study on reflection pattern of swells from the shoreline of peninsular India, Nat. Hazards., 74, 1863–1879, doi:10.1007/s11069-014-1282-5, 2014.
Anoop, T. R., Kumar, V. S., Shanas, P. R., and Glejin, J.: Surface wave climatology and its variability in the North Indian Ocean based on ERA-Interim reanalysis, J. Atmos. Ocean.
5
Tech., 32, 1372–1385, doi:10.1175/JTECH-D-14-00212.1, 2015.
Aparna, S. G., McCreary, J. P., Shankar, D., and Vinayachandran, P. N.: Signatures of Indian Ocean Dipole and El Niño–Southern Oscillation events in sea level variations in the Bay of Bengal, J. Geophys. Res.-Oceans., 117, C10012, doi:10.1029/2012JC008055, 2012. Baquero-Bernal, A., Latif, M., and Legutke, S.: On dipole like variability of sea surface
temper-10
ature in the tropical Indian Ocean, J. Climate, 15, 1358–1368, 2002.
Booij, N., Ris, R. C., and Holthuijsen, L. H.: A third-generation wave model for coastal regions: 1. Model description and validation, J. Geophys. Res.-Oceans., 104, 7649–7666, 1999. Bunney, C.: A high resolution SWAN model assessment: North Norfolk to Humber. Met Office
Forecasting Research Technical Report Met Office, Devon, UK, 557 pp., 2011.
15
Cohen, J. and Cohen, P.: Applied Mutiple Regression/Correlation Analysis for the Behavioral Sciences, Lawrence Erlbam Associates, London, UK, 545 pp., 1983.
Dee, D. P., Uppala, S. M., Simmons, A. J., Berrisford, P., Poli, P., Kobayashi, S., and Vitart, F.: The ERA-Interim reanalysis: configuration and performance of the data assimilation sys-tem, Q. J. Roy. Meteor. Soc., 137, 553–597, 2011.
20
Glejin, J., Sanil Kumar, V., Balakrishnan Nair, T. M., and Singh, J.: Influence of winds on tem-porally varying short and long period gravity waves in the near shore regions of the eastern Arabian Sea, Ocean Sci., 9, 343–353, doi:10.5194/os-9-343-2013, 2013a.
Glejin, J., Kumar, V. S., Nair, T. B., Singh, J., and Mehra, P.: Observational evidence of summer shamal swells along the west coast of India, J. Atmos. Ocean. Tech., 30, 379–388, 2013b.
25
Glejin, J., Kumar, V. S., and Nair, T. M. B.: Monsoon and cyclone induced wave climate over the near shore waters offPuduchery, south western Bay of Bengal, Ocean Eng., 72, 277–286, 2013c.
Hasselmann, K., Barnett, T. P., Bouws, E., Carlson, H., Cartwright, D. E., Enke, K., Ew-ing, J. A., Gienapp, H., Hasselmann, D. E., Kruseman, P., Meerburg, A., Muüller, P.,
Ol-30
OSD
12, 2473–2496, 2015Indian Ocean Dipole modulated wave climate of eastern
Arabian Sea
T. R. Anoop et al.
Title Page
Abstract Introduction
Conclusions References
Tables Figures
◭ ◮
◭ ◮
Back Close
Full Screen / Esc
Printer-friendly Version Interactive Discussion
Discussion
P
a
per
|
Discussion
P
a
per
|
Discussion
P
a
per
|
Discussion
P
a
per
Hastenrath, S. and Polzin, D.: Dynamics of the surface wind field over the equatorial Indian Ocean, Q. J. Roy. Meteor. Soc., 130, 503–517, 2004.
Komen, G., Hasselmann, S., and Hasselmann, K.: On the existence of a fully developed wind-sea spectrum, J. Phys. Oceanogr., 14, 1271–1285, 1984.
Kumar, B. P., Vialard, J., Lengaigne, M., Murty, V. S. N., and McPhaden, M. J.: TropFlux: air–
5
sea fluxes for the global tropical oceans-description and evaluation, Clim. Dynam., 38, 1521– 1543, 2012.
Kumar, B. P., Vialard, J., Lengaigne, M., Murty, V. S. N., McPhaden, M. J., Cronin, M. F., Pin-sard, F., and Reddy, K. G.: TropFlux wind stresses over the tropical oceans: evaluation and comparison with other products, Clim. Dynam., 40, 2049–2071, 2013.
10
Kumar, V. S. and Anjali Nair, M.: Inter-annual variations in wave spectral characteristics at a location offthe central west coast of India, Ann. Geophys., 33, 159–167, doi:10.5194/angeo-33-159-2015, 2015.
Kumar, V. S. and Naseef, T. M.: Performance of ERA-Interim wave data in the nearshore waters around India, J. Atmos. Ocean. Tech., 32, 1257–1269, 2015.
15
Kumar, V. S., Shanas, P. R., and Dubhashi, K. K.: Shallow water wave spectral characteristics along the eastern Arabian Sea, Nat. Hazards., 70, 377–394, 2014.
Murtugudde, R., McCreary, J. P., and Busalacchi, A. J.: Oceanic processes associated with anomalous events in the Indian Ocean with relevance to 1997–1998, J. Geophys. Res.-Oceans., 105, 3295–3306, 2000.
20
Neetu, S., Shetye, S. R., and Chandramohan, P.: Impact of sea breeze on wind-seas offGoa, west coast of India, J. Earth Syst. Sci., 115, 229–234, 2006.
Premkumar, K., Ravichandran, M., Kalsi, S. R., Sengupta, D., and Gadgil, S.: First results from a new observational system over the Indian Seas, Curr. Sci. India, 78, 323–330, 2000. Rao, A. S., Behera, S. K., Masumoto, Y., and Yamagata, T.: Interannual subsurface variability
25
in the tropical Indian Ocean with a special emphasis on the Indian Ocean Dipole, Deep Sea Res., 49, 1549–1572, 2002.
Reverdin, G.: Convergence in the equatorial surface jets of the Indian Ocean, J. Geophys. Res.-Oceans., 90, C6, 11741–11750, 1985.
Ris, R. C., Holthuijsen, L. H., and Booij, N.: A third-generation wave model for coastal regions
30
2. Verification, J. Geophys. Res.-Oceans, 104, 7667–7681, 1999.
OSD
12, 2473–2496, 2015Indian Ocean Dipole modulated wave climate of eastern
Arabian Sea
T. R. Anoop et al.
Title Page
Abstract Introduction
Conclusions References
Tables Figures
◭ ◮
◭ ◮
Back Close
Full Screen / Esc
Printer-friendly Version Interactive Discussion
Discussion
P
a
per
|
Discussion
P
a
per
|
Discussion
P
a
per
|
Discussion
P
a
per
|
Saji, N. H., Goswami, B. N., Vinayachandran, P. N., and Yamagata, T.: A dipole mode in the tropical Indian Ocean, Nature, 401, 360–363, 1999.
Shanas, P. R. and Sanil Kumar, V.: Temporal variations in the wind and wave climate at a location in the eastern Arabian Sea based on ERA-Interim reanalysis data, Nat. Hazards Earth Syst. Sci., 14, 1371–1381, doi:10.5194/nhess-14-1371-2014, 2014.
5
Shinoda, T. and Han, W.: Influence of the Indian Ocean dipole on atmospheric subseasonal variability, J. Climate, 18, 3891–3909, 2005.
Slingo, J. M. and Annamalai, H.: The El Niño of the century and the response of the Indian summer monsoon, Mon. Weather Rev., 128, 1778–1797, 2000.
Sreenivas, P., Gnanaseelan, C., and Prasad, K. V. S. R.: Influence of El Niño and Indian Ocean
10
Dipole on sea level variability in the Bay of Bengal, Global Planet. Change, 80, 215–225, 2012.
Tolman, H. L.: A third-generation model for wind waves on slowly varying, unsteady and inho-mogeneous depths and currents, J. Phys. Oceanogr., 21, 782–797, 1991.
Tolman, H. L.: User manual and system documentation of WAVEWATCH III TM version 3.14.
15
Tech. Note., 276, National Oceanic and Atmospheric Administration, National Weather Ser-vice, Maryland, USA NOAA/NWS/NCEP/MMAB, 194 pp., 2009.
Tolman, H. L. and Chalikov, D.: Source terms in a third-generation wind wave model, J. Phys. Oceanogr., 26, 2497–2518, 1996.
Uppala, S. M., Kållberg, P. W., Simmons, A. J., Andrae, U., Bechtold, V., Fiorino, M., and
20
Woollen, J.: The ERA-40 re-analysis, Q. J. Roy. Meteor. Soc., 131, 2961–3012, 2005. Vinayachandran, P. N., Francis, P. A., and Rao, S. A.: Indian Ocean dipole: processes and
impacts, current trends in science: platinum jubilee special, Indian Academy of Sciences, Bangalore, 569–589, 2009.
Webster, P. J., Moore, A. M., Loschnigg, J. P., and Leben, R. R.: The great Indian Ocean
25
warming of 1997–1998: evidence of coupled oceanic-atmospheric instabilities, Nature, 401, 356–360, 1999.
OSD
12, 2473–2496, 2015Indian Ocean Dipole modulated wave climate of eastern
Arabian Sea
T. R. Anoop et al.
Title Page
Abstract Introduction
Conclusions References
Tables Figures
◭ ◮
◭ ◮
Back Close
Full Screen / Esc
Printer-friendly Version Interactive Discussion
Discussion
P
a
per
|
Discussion
P
a
per
|
Discussion
P
a
per
|
Discussion
P
a
per
Table 1.Correlation and partial correlation of SWH and MWP with DMI and NINO3 time series.
Correlation with DMI Partial correlation with DMI (ENSO removed)
Correlation with ENSO Partial correlation with ENSO (DMI removed)
SWH MWP SWH MWP SWH MWP SWH MWP
L1 (22◦N; 67◦E)
−0.16 0.37 −0.19 0.23 −0.02 0.30 0.11 0.10
L2 (19◦N; 70.5◦E)
−0.27 0.48 −0.20 0.29 −0.19 0.45 0.03 0.20
L3 (16.5◦N; 71.5◦E)
−0.38 0.68 −0.31 0.51 −0.22 0.53 0.03 0.17
L4 (13◦N; 73◦E)
−0.56 0.69 −0.40 0.52 −0.46 0.59 −0.15 0.25
L5 (10.5◦N; 74.5◦E)
−0.59 0.57 −0.34 0.33 −0.59 0.60 −0.33 0.35
L6 (7.5◦N; 76◦E)
OSD
12, 2473–2496, 2015Indian Ocean Dipole modulated wave climate of eastern
Arabian Sea
T. R. Anoop et al.
Title Page
Abstract Introduction
Conclusions References
Tables Figures
◭ ◮
◭ ◮
Back Close
Full Screen / Esc
Printer-friendly Version Interactive Discussion
Discussion
P
a
per
|
Discussion
P
a
per
|
Discussion
P
a
per
|
Discussion
P
a
per
|
OSD
12, 2473–2496, 2015Indian Ocean Dipole modulated wave climate of eastern
Arabian Sea
T. R. Anoop et al.
Title Page
Abstract Introduction
Conclusions References
Tables Figures
◭ ◮
◭ ◮
Back Close
Full Screen / Esc
Printer-friendly Version Interactive Discussion
Discussion
P
a
per
|
Discussion
P
a
per
|
Discussion
P
a
per
|
Discussion
P
a
per
OSD
12, 2473–2496, 2015Indian Ocean Dipole modulated wave climate of eastern
Arabian Sea
T. R. Anoop et al.
Title Page Abstract Introduction Conclusions References Tables Figures ◭ ◮ ◭ ◮ Back Close
Full Screen / Esc
Printer-friendly Version Interactive Discussion Discussion P a per | Discussion P a per | Discussion P a per | Discussion P a per | -0.2 0 0.2 0.4 -0.8 0 0.8 1.6 -2 -1 0 1
SWH (m) DMI MWP (s)
-0.2 0 0.2 0.4 -0.8 0 0.8 1.6 -2 -1 0 1 -0.4 -0.2 0 0.2 0.4 -0.8 0 0.8 1.6 -2 -1 0 1 -0.2 0 0.2 0.4 -0.8 0 0.8 1.6 -2 -1 0 1 -0.2 0 0.2 0.4 -0.8 0 0.8 1.6 -2 -1 0 1 -0.4 -0.2 0 0.2 0.4 -0.8 0 0.8 1.6 -2 -1 0 1 (L1) (L2) (L3) (L4) (L5) (L6) Year -1 0 1
west equatorial IO east equatorial IO
80 82 84 86 88 90 92 94 96 98 00 02 04 06 08 10 12 14
a) b) SS T anomaly Anomaly (MWP) D MI Anomaly (SWH)
OSD
12, 2473–2496, 2015Indian Ocean Dipole modulated wave climate of eastern
Arabian Sea
T. R. Anoop et al.
Title Page
Abstract Introduction
Conclusions References
Tables Figures
◭ ◮
◭ ◮
Back Close
Full Screen / Esc
Printer-friendly Version Interactive Discussion
Discussion
P
a
per
|
Discussion
P
a
per
|
Discussion
P
a
per
|
Discussion
P
a
per
Figure 4.Averaged wind pattern of October from 2008 to 2014 and the wave measurement locations are marked as red dots(a). Averaged measured wave frequency-directional spectra from 2008 to 2014 offRatnagiri(b)and offHonnavar(c)Modeled directional spectrum off Rat-nagiri(d)and offHonnavar from 2010 to 2014(e). Color bar is for spectral energy (m2Deg Hz−1
OSD
12, 2473–2496, 2015Indian Ocean Dipole modulated wave climate of eastern
Arabian Sea
T. R. Anoop et al.
Title Page
Abstract Introduction
Conclusions References
Tables Figures
◭ ◮
◭ ◮
Back Close
Full Screen / Esc
Printer-friendly Version Interactive Discussion
Discussion
P
a
per
|
Discussion
P
a
per
|
Discussion
P
a
per
|
Discussion
P
a
per
|
OSD
12, 2473–2496, 2015Indian Ocean Dipole modulated wave climate of eastern
Arabian Sea
T. R. Anoop et al.
Title Page
Abstract Introduction
Conclusions References
Tables Figures
◭ ◮
◭ ◮
Back Close
Full Screen / Esc
Printer-friendly Version Interactive Discussion
Discussion
P
a
per
|
Discussion
P
a
per
|
Discussion
P
a
per
|
Discussion
P
a
per
|
OSD
12, 2473–2496, 2015Indian Ocean Dipole modulated wave climate of eastern
Arabian Sea
T. R. Anoop et al.
Title Page
Abstract Introduction
Conclusions References
Tables Figures
◭ ◮
◭ ◮
Back Close
Full Screen / Esc
Printer-friendly Version Interactive Discussion
Discussion
P
a
per
|
Discussion
P
a
per
|
Discussion
P
a
per
|
Discussion
P
a
per