ISSN 0102-695X DOI: 10.1590/S0102-695X2012005000134 Received 30 Jun 2012 Accepted 8 Sep 2012 Available online 22 Nov 2012
content and antioxidant activity of Endopleura
uchi bark extracts obtained by dynamic
maceration
Luciana A. Tacon,
*Luis A. P. Freitas
Faculdade de Ciências Farmacêuticas de Ribeirão Preto, Universidade de São Paulo, Brazil.
Abstract: Brazil has one of the world’s largest biodiversity in l ora and a plant that has attracted attention is the Endopleura uchi (Huber) Cuatrec., Humiriaceae, which is native of the Brazilian Amazon. Among the many popular uses, this species is utilized in
the treatment of woman´s genito urinary tract affections and also as anti-inl ammatory.
It is believed that their actions derive from the major constituent, bergenin. The objective of this work was to study the Endopleura uchi barks extraction using the dynamic maceration method and the effects of the extraction time, drug to solvent
ratio and temperature. A Box-Behnken design was applied to study the inl uence of
these factors and the respective response surfaces. The extract characterization was made by determination of its antioxidant activity by DPPH; total polyphenol content and bergenin content. In general, the extracts showed good antioxidant activity, with
the IC50 ranging from 4.02 to 5.87 μg/mL. The polyphenol content ranged from 31.89
to 47.82%. High levels of chemical markers are observed in all extracts, with average bergenin content of 35.58%. The result showed that the multivariate study of extraction is key step in the development and standardization of extracts Endopleura uchi.
Keywords: design of experiments DPPH hydroalcoholic polyphenol
Introduction
Brazil has a very extense biodiversity in l ora
which is very little known or studied for medicinal purposes (Agra et al., 2007; Coelho-Ferreira, 2009; de Carvalho et al., 2008). One Brazilian plant that has recently raised strong interest is the Endopleura uchi
(Huber) Cuatrec., Humiriaceae. This species originates from the Brazilian Amazon, is dispersed all over the Amazon River basin, and is popularly known as “uxi”, “uxi-amarelo”, “uchi-pucu”, “uxi-liso” e “uchi” (Carvalho et al., 2007; Cuatrecasas, 1961; Politi et al., 2011).
In Amazonian folk medicine, the bark of the uxi is used to treat hypercholesterolemia, diabetes, arthritis,
and as anti-inl ammatory. Furthermore, the Endopleura uchi bark tea has been popularly used to treat uterine
i broids and disorders of woman´s genito urinary tract
(Nunomura et al., 2009).
It is believed that the main active constituent of this plant is bergenin (1), a C-glycoside of 4-O-methyl gallic acid, found in the fruits and barks of Endopleura uchi. (Gu et al., 2009; Magalhães et al., 2007; Nunomura
et al., 2009) The scientii c literature shows several
biological activities attributed to this glycoside:
anti-inl ammatory (Nunomura et al., 2009); antihepatotoxic
(Kim et al., 2000), antifungal (Prithiviraj et al., 1997), anti-HIV (Piacente et al., 1996).
O O
H3CO
HO HO
O
OH CH2OH
H OH
H
1
One of the key steps in phytopharmaceutical technology studies is the extraction method that will be used for the extraction of a particular constituent or group from the plant raw material (Helou,1989).
One of the most used extraction methods is the maceration (Moura et al., 2011), due to its simplicity and suitability to different scales: from laboratory bench top to industry (Silva & Aragão, 2009; Tour & Talele, 2011). One of its variants, the dynamic maceration, has the advantage of steadily stirring, resulting in increased contact of the plant material with the solvent and thus shorter process times (De Paivai et al., 2004).
The aim of this work was to apply a design of experiment, DOE, to study the extraction of bergenin from
Endopleura uchi barks using the dynamic maceration method and also to characterize the extracts, evaluating their polyphenol and bergenin content and antioxidant activity.
Materials and Methods
Plant
The plant material was the bark of Endopleura uchi (Huber) Cuatrec., Humiriaceae. The plant material
was purchased from Flores e Ervas Ltda (Piracicaba,
São Paulo, Brasil) with batch number 029071/SFS015. A sample of the Endopleura uchi bark was deposited at the
“Herboteca Carlos Stelled” at the Pharmacognosy Lab
from the Universidade Federal do Paraná, under registry number No. 331-A. The pharmacognostic characterization of the plant material resulted in a maximum foreign elements of 2.0%; moisture content of 7.0% and total ash of 5.1%. The barks were subsequently subjected to
a milling process, using a knife mill SL31 (Solab Ltda,
Piracicaba, Brasil).
Dynamic maceration
The dynamic maceration runs were carried out
in 250 mL sealed Erlenmeyer lasks and a 15-sample
multipoint magnetic stirrer with digital speed control. The stirrer speed was calibrated with an optical tachometer
TO404 (OpthoTako Ltd) and was kept constant at 600 rpm to all experiments. The extraction lasks were kept
in a thermostatic air bath with digital temperature control
AB-15 (Labmaq do Brasil Ltda, Ribeirão Preto, Brazil). The solvent chosen was ethanol 70 °GL and before the
extraction experiments, the drug swelling index in this solvent, SWI, was determined and used to calculate the amount of solvent used in each experiment.
The factors chosen for the dynamic maceration study were the extraction time t (h), the temperature T (°C) and the plant material to the solvent ratio, P/S (%).
After the extraction process, the extracts were iltered using qualitative ilter paper.
Design of experiments
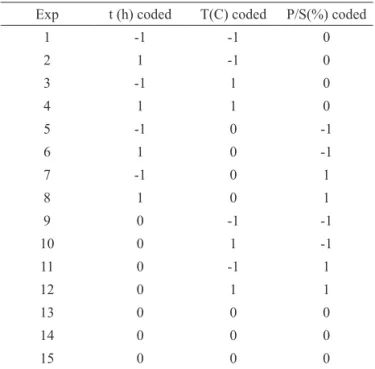
For better understanding of the dynamic maceration process, a Box-Behnken type factorial design was applied. This model of fractional factorial design has three variables and three levels but only 15 experimental runs (Box et al., 1978). The three factors were the extraction time t (h); the temperature T (°C) and the plant/solvent ratio P/S (%). The Box-Behnken design is shown in Table 1, where the chosen levels are presented
in a coded form, using the following nomenclature: -1 (low level), 0 (intermediate level) and 1 (high level). The actual values for the three levels of the factors studied are presented in Table 2.
Table 1. Factorial design-Dynamic maceration.
Exp t (h) coded T(C) coded P/S(%) coded
1 -1 -1 0
2 1 -1 0
3 -1 1 0
4 1 1 0
5 -1 0 -1
6 1 0 -1
7 -1 0 1
8 1 0 1
9 0 -1 -1
10 0 1 -1
11 0 -1 1
12 0 1 1
13 0 0 0
14 0 0 0
15 0 0 0
Table 2. Factors studied and their levels.
Factors Levels
-1 0 1
t (h) 6 12 18
T (°C) 25 35 45
P/S (%) 10 30 50
Antioxidant activity
The evaluation of antioxidant activity was performed using the radical 2,2-difenilpicrilhidrazil (DPPH) method (Martins et al., 2012). The curves of absorbance measurements as function of extract
concentration were prepared in triplicate with ive concentrations for each of the ifteen extracts obtained
in the Box-Behnken design. Besides the curves for uchi
extracts, absorbencies were also measured for blank and positive control (C+) of the DPPH reaction. The samples
(E) were prepared by dissolving 50 μL of extracts in 1.0 mL of acetate buffer (pH 5.5), 1.0 mL of ethanol, and 500 μL of DPPH (200 μM). The blank was a solution of 1.0 mL acetate buffer (pH 5.5), 1.5 mL of ethanol. The positive control, C+, was prepared with 1.0 mL acetate buffer (pH 5.5), 1.0 mL of ethanol, 50 μL of ethanol and 500 μL of DPPH (200 μM).
After 15 min in the dark, absorbance was measured at a wavelength of 520 nm in a spectrophotometer
measurements were used to calculate % inhibition, with the aid of equation 1 (Martins et al., 2012).
% Inhibition = 100-
(
*
100
)
+
AbsC
AbsE
[1]
Where: AbsE = absorbance for extract and
AbsC+ = absorbance for positive control.
The results are expressed as inhibitory
concentration, IC50 (μg/mL), needed to decrease by 50%
the initial concentration of DPPH. The IC50 of gallic acid standard was also analyzed to serve as a reference in antioxidant activity.
Phenols analysis
The quantiication of phenol was performed using
the Folin Ciocalteu reagent (Marquele et al., 2006; Politi et al., 2011). This reagent is a mixture of two acids, with molybdenum and tungsten in oxidation state 6+. These two compounds change their oxidative state when they are in the presence of reducing agents, such as phenols, leading to formation of blue color. Consequently, the concentration can be measured by spectrophotometry. The more reducing agents, more intense is the blue color. The analytical curve was prepared with gallic acid, used as reference substance for analysis of phenols. Absorbance was measured at 760 nm (Marquele et al., 2006).
Bergenin analysis
The bergenin quantiication was performed by high performance liquid chromatography (HPLC) in a Shimadzu LC-AT 10 chromatograph with a UV-Vis
detector SPD-10A and manual injection. The method used validated by Tacon (2012) and adapted from Nunomura et al. (2009). The chromatography was run in isocratic mode with methanol: water (20:80) as the mobile phase,
column C-18 Shim-PACK CLS-(ODS 280x4.0 mm and
particle size 5 µm) and the detector was set to wavelength
of 272 nm. The low rate of the mobile phase was 0.8 mL/min. The analytical curve was constructed using bergenin 95.4% (ChromaDex Ltd, USA), with bergenin concentrations ranging from 12.5 to 400 µg/mL, and a linear correlation coeficient of 0.9993. The bergenin
yield was calculated based on the ratio of bergenin mass
found in HPLC analysis and the weight of plant used in
each of the dynamic maceration process.
Statistical analysis
The software Statistica® 9.0 (Statsoft Inc, Tulsa, USA) was used for response surface analysis of factors effects on extracts characteristics. The effects were
considered statistically signiicant only when p≤0.05.
ANOVA on the experimental data was performed using
the visual general linear model (VGLM) module from
Statistica®. The response functions applied were the multiple linear equations given by:
Y=A0+A1X1+A2X2+A3X3 +A4X1X2+A5X1X3 +A6X2X3 Eq. 2
Where, Y=dependent variables; Xn=factors studied and An=polynomial coeficients
Results and Discussion
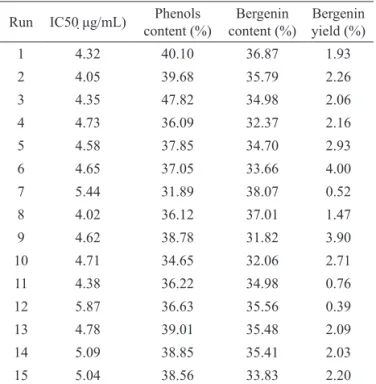
The milling process resulted in plant material with mean particle size (d50) equal to 343±14 µm. This milling step was made to reduce the particle size and increase the surface area, thus improving the extraction process (Fonseca et al., 2006; Manpong et al., 2011; Martin et al., 2011). Thus, all extraction experiments were carried out with milled bark with this size distribution. Table 3 shows the results for extract antioxidant activity, phenol and bergenin content and bergenin yield.
Table 3. Extracts characteristics. Run IC50 μg/mL) Phenols
content (%)
Bergenin content (%)
Bergenin yield (%)
1 4.32 40.10 36.87 1.93
2 4.05 39.68 35.79 2.26
3 4.35 47.82 34.98 2.06
4 4.73 36.09 32.37 2.16
5 4.58 37.85 34.70 2.93
6 4.65 37.05 33.66 4.00
7 5.44 31.89 38.07 0.52
8 4.02 36.12 37.01 1.47
9 4.62 38.78 31.82 3.90
10 4.71 34.65 32.06 2.71
11 4.38 36.22 34.98 0.76
12 5.87 36.63 35.56 0.39
13 4.78 39.01 35.48 2.09
14 5.09 38.85 35.41 2.03
15 5.04 38.56 33.83 2.20
Gallic acid standard: IC50 3.21 μg/mL.
In Table 3 it is observed that all the extracts showed excellent antioxidant activity, with the IC50
ranging from 4.02 to 5.87 μg/mL. The values were close to the IC50 of gallic acid (3.21 μg/mL), which is considered a reference for antioxidant activity (Lima et al., 2006;
Sousa et al., 2007). These IC50 values are comparable or superior to plant extracts with recognized antioxidant
activity (Araujo et al., 2010; Lima et al., 2006; Marquele
Phenols are among the most important classes of antioxidants. The data in Table 3 demonstrate that all extracts presented high phenol contents, which ranged from 31.89 to 47.82% (Marquele et al., 2006; Politi et al., 2011). This result corroborates with the high antioxidant activity of the extracts obtained from Endopleura uchi
(Huber) Cuatrec., Humiriaceae (Politi et al., 2011), since the phenolic compounds are able to sequester or neutralize free radicals due to their chemical structure and reducing properties. They are also able to chelate transition metals, acting both in the stage of initiation and the propagation of the oxidative process (Garrido et al., 2012; Sousa et al., 2007).
In this paper the bergenin (1) content refers to
the concentration of this marker in each of the ifteen
extracts, which was calculated from the standard curve
of bergenin (HPLC). High levels of this marker are
observed in all extracts, being the average 35.58%. The chromatograms of the one of extracts (run nr 1, Table 3)
and of the bergenin 95.4% (ChromaDex Ltd, USA) may
be observed in Figures 1a and b, respectively.
Figure 1. Chromatographic proiles of: a) extract of Uchi (Box-Behnken design-run nr1, Table 3); b) bergenin 95.4%
(ChromaDex Ltd, USA).
The data on bergenin content from Table 3 can be used to calculate the weight of bergenin extracted in relation to the original weight of plant, or the yield of bergenin. The results indicate up to 4% of bergenin in the uchi bark, which is comparable to value reported in literature, 3.19% (Nunomura et al., 2009).
Statistical analysis
The Tables 4 to 7 show the results for statistical analysis, ANOVA, of the extract characteristics. Effects
were considered statistically signiicant when p≤0.05.
Table 4 shows the results of the statistical analysis
for IC50. It can be noted that the statistically signiicant
parameters were the temperature and the quadratic term
of time. These two effects can be clearly seen in Figure 2. Intermediary times were responsible for higher IC50, or lower antioxidant activity. The lowest temperature levels showed higher antioxidant activity. It is well known that higher temperatures may promote better extraction, but they may also increase the degradation of heat sensitive compounds, thereby increasing the IC50. The P/S ratio
did not affect the antioxidant activity at a signiicant level,
demonstrating that within the range of P/S ratio analyzed, IC50 is always constant.
Table 4. Summary of ANOVA analysis by response surface on IC50.
Effects SS MS F p
t 0.19158 0.19158 2.0005 0.216390
t2 0.64013 0.64013 6.6842 0.049111
T 0.64355 0.64355 6.7199 0.048702
T2 0.13629 0.13629 1.4231 0.286404
P/S 0.16445 0.16445 1.7172 0.247018
P/S2 0.05044 0.05044 0.5267 0.500550
t x T 0.10498 0.10498 1.0962 0.343060
Tt x P/S 0.55652 0.55652 5.8111 0.060817
T x P/S 0.49210 0.49210 5.1385 0.072727 Where: SS-sum of squares; MS-mean square; F-f number and
p-probability.
Figure 2. Surface plot of the IC50 as function of time and temperature.
Table 5 shows that none of the factors have
inluenced signiicantly the phenol content. Within the
Table 5. Summary of ANOVA analysis by response surface on phenol content.
Effects SS MS F p
t 9.500 9.500 1.1015 0.341996
t2 1.505 1.505 0.1744 0.693519
T 0.022 0.022 0.0025 0.961936
T2 8.084 8.084 0.9373 0.377433
P/S 6.971 6.971 0.8083 0.409837
P/S2 50.893 50.893 5.9006 0.059445
t x T 32.002 32.002 3.7104 0.112028
Tt x P/S 6.330 6.330 0.7340 0.430738
T x P/S 5.179 5.179 0.6004 0.473453
Where: SS- sum of squares; MS-mean square; F-f number and
p-probability.
Table 6. Summary of ANOVA analysis by response surface on bergenin content.
Effects SS MS F p
t 4.186 4.186 3.107 0.138263
t2 5.127 5.127 3.805 0.108564
T 2.515 2.515 1.867 0.230070
T2 4.330 4.330 3.214 0.133010
P/S 22.383 22.383 16.613 0.009578
P/S2 0.181 0.181 0.135 0.728683
t x T 0.579 0.579 0.430 0.540932
Tt x P/S 0.000 0.000 0.000 0.994249
T x P/S 0.028 0.028 0.021 0.891085
Where: SS-sum of squares; MS-mean square; F-f number and
p-probability.
Table 7. Summary of ANOVA analysis by response surface on bergenin yield.
Effects SS MS F P
t 0.75149 0.75149 5.56230 0.064875
t2 0.07714 0.07714 0.57093 0.483945
T 0.29102 0.29102 2.15403 0.202120
T2 0.07805 0.07805 0.57770 0.481498
P/S 13.50562 13.50562 99.96405 0.000171
P/S2 0.00138 0.00138 0.01023 0.923354
t x T 0.01354 0.01354 0.10023 0.764342
Tt x P/S 0.00360 0.00360 0.02668 0.876655
T x P/S 0.16889 0.16889 1.25009 0.314357 Where: SS-sum of squares; MS-mean square; F-f number and
p-probability.
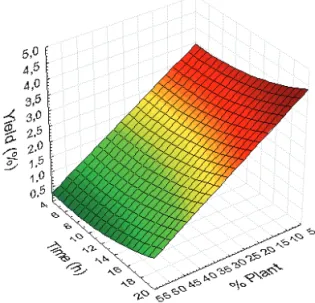
In Tables 6 and 7, it can be observed that P/S
inluences the bergenin content and yield both at 1% signiicance level, however in opposite forms. Bergenin
content is directly proportional to P/S, but bergenin yield
is inversely proportional. A possible explanation for this effect is that bergenin content and yield provide different information on the extractive process. As said before,
bergenin contents are concentration of bergenin in luid
extracts. Bergenin yields are calculated comparing the mass of bergenin extracted to the weight of plant used in the experiment. Since bergenin contents show similar values to all P/S ratios, and bergenin yields decrease with P/S, is means that within the range of P/S studied the solvent was close to saturate with bergenin. Thus, based on bergenin yield, high P/S ratios are not recommended. These effects can be observed in Figures 3 and 4.
Figure 3. Response surface plot of bergenin content as function of time and P/S%.
Furthermore, the fact that best antioxidant activities were observed for the very same extracts with higher contents of bergenin and phenols, may indicate the relationship between these compounds and the Endopleura uchi
activities reported in folk medicine (Garrido et al., 2012; Nunomura et al., 2009; Politi et al., 2011).
Besides, the use of the statistical tool DOE, has enabled a better analysis of results and further exploration of the same, like analyzing possible interactions and indicating the appropriate levels for the process. (Peralta-Zamora et al., 2005; Couto et al., 2011).
Conclusion
The dynamic maceration parameters chosen for
the extractive processes exerted a strong inluence on the
characteristics of the extracts, and could be altered to allow best extraction. The optimized uchi extract showed high bergenin and phenol content and antioxidant activity. The use of the statistical tool DOE can be very useful in designing future experiments in phytopharmaceutical technology.
Thus, the study of extraction process is essential in the development and standardization of Endopleura uchi (Huber) Cuatrec., Humiriaceae, extracts.
References
Agra MF, Baracho GS, Nurit K, Basilio IJLD, Coelho VPM 2007. Medicinal and poisonous diversity of the lora of
"Cariri Paraibano", Brazil. J Ethnopharmacol 111: 383-395.
Araujo RR, Teixeira CCC, Freitas LAP 2010. The preparation
of ternary solid dispersions of an herbal drug via spray drying of liquid feed. Dry Technol 28: 412-421. Box M, Hunter WG, Hunter JS 1978. Statistics for experiments.
New York: John Wiley and Sons.
Carvalho JEU, Muller CH, Benchimol RL 2007. Uxizeiro: Botânica, Cultivo e Utilização. 1ª Ed. edn. Belém, PA: Embrapa Amazônia Oriental.
Coelho-Ferreira M 2009. Medicinal knowledge and plant utilization in an Amazonian coastal community of Maruda, Para State (Brazil). J Ethnopharmacol 126: 159-175.
Couto RO, Araújo RR, Tacon LA, Conceição EC, Bara MTF, Paula JR, Freitas LAP 2011. Development of a
Phytopharmaceutical intermediate product via spray drying. Dry Technol 29: 709-718.
Cuatrecasas J 1961. A taxonomic revision of the Humiriaceae.
Contributions from the United States National Herbarium Vol. 35, Part 2, Smithsonian Institute, Washington, 214 p.
De Carvalho MG, da Costa JMC, de Souza VAB, Maia GA 2008. Evaluation of some physical and nutritional parameters of almonds of chicha, sapucaia and
castanha-do-gurgucia. Rev Cienc Agron 39: 517-523.
De Paivai SR, Lima LA, Figueiredo MR, Kaplan MAC
2004. Plumbagin quantification in roots of Plumbago scandens L. obtained by different extraction
techniques. An Acad Bras Cienc 76: 499-504.
Fonseca JM, Rushing JW, Thomas RL, Riley MB, Rajapakse NC 2006. Inluence of particle size on extraction yield and quantiication of parthenolide in feverfew (Tanacetum parthenium). Acta Hortic 720: 189-197.
Garrido G, Romiti N, Tramonti G, Fuente F, Chieli E 2012. Polyphenols of Mangifera indica modulate arsenite-induced cytotoxicity in a human proximal tubule cell line. Rev Bras Farmacogn 22: 325-334.
Gu JK, Yu WS, Wang YW, Zhang YH, Lan J, Liu ZY, Fawcett
JP, Zhang D 2009. Quantitation of bergenin in human plasma by liquid chromatography/tandem mass spectrometry. J Chromatogr B 877: 33-36.
Helou JH 1989. Preparações farmacêuticas obtidas por extração. Rev Bras Farmacogn 2-4: 106-169.
Kim HS, Lim HK, Chung MW, Kim YC 2000. Antihepatotoxic
activity of bergenin, the major constituent of Mallotus japonicus, on carbon tetrachloride-intoxicated hepatocytes. J Ethnopharmacol 69: 79-83.
Lima AR, Barbosa VC, Santos Filho PR, Gouvêa CMCP 2006. Avaliação in vitro da atividade antioxidante do extrato hidroalcoólico de folhas de bardana. Rev Bras Farmacogn 16: 531-536.
Magalhães LAM, Lima MP, Marinho HA, Ferreira AG 2007. Identiicação de bergenina e carotenóides no fruto de
uchi (Endopleura uchi, Humiriaceae). Acta Amaz 37: 447-450.
Manpong P, Douglas S, Douglas PL, Pongamphai S, Teppaitoon
W 2011. Preliminary Investigation of Gallic Acid Extraction from Jatropha curcas Linn. Leaves Using
Supercritical Carbon Dioxide with Methanol Co-Solvent. J Food Process Eng 34: 1408-1418.
Marquele FD, Stracieri KM, Fonseca MJV, Freitas LAP 2006.
Spray-dried propolis extract. I: Physicochemical and antioxidant properties. Pharmazie 61: 325-330.
Martin L, Gonzalez-Coloma A, Diaz CE, Mainar AM, Urieta
JS 2011. Supercritical CO2 extraction of Persea indica: Effect of extraction parameters, modelling and bioactivity of its extracts. J Supercrit Fluid 57: 120-128.
Martins RM, Pereira SV, Siqueira S, Salomão WF, Freitas LAP
2012. Curcuminoid content and antioxidant activity in spray dried microparticles containing turmeric extract
Food Res Int doi: 10.1016/j.foodres.2011.06.030.
Moura TFAL, Rafi FN, Santos ALR 2011. Evaluation of a
preservative system in a gel containing hydroalcoholic extract of Schinus terebinthifolius. Rev Bras Farmacogn 21: 532-536.
Nunomura RCS, Oliveira VG, Da Silva SL, Nunomura SM
Soc 20: 1060-1064.
Peralta-Zamora P, Morais JL, Nagata N 2005. Por que otimização
multivariada? Eng Sanit Ambient 10: 106-110.
Piacente S, Pizza C, deTommasi N, Mahmood N 1996. Constituents of Ardisia japonica and their in vitro anti-HIV activity. J Nat Prod 59: 565-569.
Politi FAS, de Mello JCP, Migliato KF, Nepomuceno ALA, Moreira RRD, Pietro RCLR 2011. Antimicrobial,
Cytotoxic and Antioxidant Activities and Determination of the Total Tannin Content of Bark Extracts Endopleura uchi. Int J Mol Sci 12: 2757-2768.
Prithiviraj B, Singh UP, Manickam M, Srivastava JS, Ray AB 1997. Antifungal activity of bergenin, a constituent of
Flueggea microcarpa. Plant Pathol 46: 224-228.
Silva IDD, Aragão CFS 2009. Avaliação de parâmetros de extração da Cinchona Vahl por métodos farmacopéicos
e não farmacopéicos. Rev Bras Farmacogn 19: 776-780.
Sousa CMM, Silva HR, Vieira-Jr. GM, Ayres MCC, da Costa
CLS, Araújo DS, Cavalcante LCD, Barros EDS, Araújo
PBM, Brandão MS, Chaves MH 2007. Fenóis totais e atividade antioxidante de cinco plantas medicinais.
Quim Nova 30: 351-355.
Souza JPB, Tacon LA, Correia CC, Bastos JK, Freitas LAP
2007. Spray-dried propolis extract, II: Prenylated components of green propolis. Pharmazie 62: 488-492.
Tacon LA 2012. Estudo da extração e secagem por spray dryer das cascas de Endopleura uchi (Huber) Cuatrec.
Humiriaceae. Ribeirão Preto, 106p. Dissertação de Mestrado, Programa de Pós-graduação em Ciências Farmacêuticas, Universidade de São Paulo.
Tour N, Talele GS 2011. Gastric antiulcer and antiinlammatory
activities of Calotropis procera stem bark. Rev Bras Farmacogn 21: 1118-1126.
*Correspondence
Luciana A. Tacon
Faculdade de Ciências Farmacêuticas de Ribeirão Preto,
Universidade de São Paulo
Via do Café sn, Campus USP, 14040-903 Ribeirão Preto-SP, Brazil