Evaluation of food intake
markers in the Brazilian
surveillance system for chronic
diseases – VIGITEL
(2007-2009)
Avaliação dos marcadores de
consumo alimentar do VIGITEL
(2007-2009)
Amanda de Moura SouzaI
Ilana Nogueira BezerraII
Diana Barbosa CunhaI
Rosely SichieriI
I Department of Epidemiology – Instituto de Medicina Social – Universidade do
Estado do Rio de Janeiro (UERJ) – Rio de Janeiro (RJ), Brazil
II Post-Graduation program in Clinical and Experimental Physiopathology –
Faculdade de Medicina of Universidade do Estado do Rio de Janeiro (UERJ) – Rio de Janeiro (RJ), Brazil
Study carried out at the Department of Epidemiology – Instituto de Medicina Social of Universidade do Estado do Rio de Janeiro (UERJ) – Rio de Janeiro (RJ), Brazil
Financial Support: National Council for Scientific and Technological Development (CNPq); Research Support Foundation of the State of Rio de Janeiro (FAPERJ) and Coordination for Improvement of Higher Education Personnel (CAPES).
Correspondence to: Amanda de Moura Souza – Department of Epidemiology – Instituto de Medicina Social at Universidade do Estado do Rio de Janeiro – Rua São Francisco Xavier, 524, 7º floor, bloco E – CEP: 20550-900 – Rio de Janeiro (RJ), Brazil – E-mail: [email protected]. Conflict of interest: nothing to declare.
Abstract
Objective: To evaluate markers of food intake of the telephone-based risk factor surveillance system for chronic diseases (VIGITEL) and the trend of these markers.
Methods: A total of 135,249 subjects from 27 Brazilian cities interviewed in the 2007 – 2009 surveys were evaluated. Eating habits were evaluated based on the frequency of intake of fruit, vegetables, beans, whole and skim milk, regular and diet/light soft drinks and visible fat in meat and poultry. hese items were used to create a diet quali-ty score and to identify dietary patterns in a cluster analysis. Results: Time trends indicated statistically signiicant increase in thefrequency of intake of beans, whole milk and regular soft drinks and decline in vegetables and skim milk. here was an increase in the frequency of individu-als who reported consuming beans daily, from 11 to 13%. Beans are considered as a protective factor and the prevalence of usual intake is still low. Over the past three years, less than 15% of the studied popula-tion reported eating the Brazilian recom-mended number of 3 servings of fruits and 3 servings of vegetables per day. As to the vegetable intake, a decrease from 5 to 3% was reported. he consumption of regular soft drinks had the highest increase, ranging from 60 to 67%. he assessed items showed a weak correlation and did not represent a sole healthy eating construct. Conclusion:
he diet quality of the Brazilians has gotten worst and eating markers that are associat-ed with high risk of chronic diseases should be better qualiied.
Resumo
Objetivo: Avaliar as questões marcadoras de consumo alimentar do Sistema Vigilân-cia de Fatores de Risco e Proteção para Doenças Crônicas por Inquérito Telefônico e sua evolução temporal. Métodos: Foram avaliados 135.249 indivíduos de 27 cidades brasileiras, entrevistados nos anos de 2007 – 2009. Os marcadores de consumo alimen-tar foram descritos a partir da frequência de consumo de frutas, hortaliças, feijão, leite integral e desnatado, refrigerante normal e
diet/light, e consumo de gordura aparente das carnes e a pele do frango. Avaliou-se a evolução temporal desses marcadores e, adicionalmente, testou-se a elaboração de um escore de alimentação saudável e a identiicação de padrões alimentares por meio da análise de cluster. Resultados:
Observou-se aumento estatisticamente signiicativo nas frequências de consumo de feijão, leite integral e refrigerante normal e diminuição no consumo de leite desnata-do. Mesmo com aumento de 11 para 13% de indivíduos que referiram consumir feijão diariamente, esses percentuais são baixos; assim como o consumo recomendado de 3 porções de frutas e 3 porções de hortali-ças por dia, que foi referido por menos de 15% da população em todos os anos, com queda de 5 para 3% para as hortaliças. O refrigerante não diet foi o item com maior aumento no consumo, passando de 60 para 67%. Os itens avaliados apresentaram fraca correlação e não coniguram um constructo único de alimentação saudável. Conclu-são: A qualidade da dieta dos brasileiros tem piorado e é necessária melhor qualii-cação dos marcadores alimentares consi-derados de risco para doenças crônicas não-transmissíveis.
Palavras-chave: hábitos alimentares,
comportamento alimentar, coleta de dados; Brasil.
Introduction
Chronic Non-Communicable Diseases (CNCD) contribute with a lot of obits in the country, and many risk factors are associated with such diseases1,2. Among
these factors, inadequate eating habits, physical inactivity, smoking and obesity are important to determine CNCD2.
he insuicient intake of fruit and veg-etables and the high intake of sugar and saturated fat are habits related to the risk factors of CNCD. hese habits are included in the Dietary Guidelines for the Brazilian Population3 established by the Ministry of
Health in 2006, and in the Telephone-based Surveillance of Risk and Protective Factors for Chronic Diseases (VIGITEL)4.
In the first VIGITEL survey, in 2006, 7% of the participants reported the adequate intake of fruit and vegetables according to the Brazilian Guidelines; less than 50% of the interviewees reported the regular con-sumption of these foods5. In this study,
we analyzed the consumption of foods from 2007 to 2009, from the seven intake-related questions (beans, fruits, vege-tables, whole milk, skim milk, regular soft drinks, diet or light soft drinks and con-sumption of saturated fat), we evaluated the ability to identify food intake patterns. Therefore, we applied some techniques that are commonly used to assess eating dietary patterns, summarized by Hu6 in
two general formats. The first one consists of indexes created from guidelines, like the Index of Food Quality (IFQ)7,8; and the
second is comprised of statistical proce-dures to analyze the covariation structure of different variables (usually foods or food groups) in order to show a restricted number of eating patterns in the assessed group6,9. These strategies of analysis have
As to the second approach, cluster analysis (in groups)10,11 and factorial analysis,
or principal components analysis12-14, have
been more frequently reported in literature. he main diference among them is that the cluster analysis gathers individuals, while the factorial analysis gathers variables. he former is adequate for three situations: to explore eating patterns when it is suspected that the sample is not homogeneous; when there are no statistical properties nec-essary for the factorial analysis; or when the intention is to keep all the proposed food items in the instrument. hus, the method aims at assigning individuals to diferent subgroups (the clusters). Food intake of individuals in the same cluster is expected to be reasonably homogeneous, showing more diferences among clusters15-17.
his article aims to assess food intake markers of the VIGITEL system and its tem-poral evolution.
Methods
Study population and design
his study used data from VIGITEL, con-ducted in 2007, 2008 and 2009. his survey is a probability sampling of adults (≥18 years) who own a telephone line in 26 Brazilian state capitals and the Federal District. he sampling process was based on the draw of 5,000 households per city, followed by the selection of one inhabitant per household. At least 2,000 interviews were conducted in each city. More details on sampling proce-dures may be found in Moura et al.18.
Individuals aged between 20 and 65 years were included in this study, and the women who were pregnant at the time of the survey were excluded. Due to some changes in the questions related to eating habits, the year 2006 was not included in the analyses.
From 2007 to 2009, 162,971 individuals were interviewed for VIGITEL. After the exclusion of 26,430 individuals who were not in the analyzed age group and 1,292 pregnant women, 135,249 adults were assessed.
Description of the variables
he assessed sociodemographic vari-ables were: age group, schooling and gender. Data regarding reported weight and height were used to calculate the Body Mass Index (BMI) – body mass (kg) divided by height in squared meters (m2). Nutritional status was
assessed according to the guidelines by the World Health Organizations19, that is, excess
weight: BMI≥25 kg/m2 and obesity: BMI≥30
kg/m2.
Concerning food intake, the survey included a question about the consumption of beans: “On how many days of the week do you usually eat beans?”; the responses were: never/almost never, once or twice a week, three or four times a week, ive or six times a week, or every day of the week.
consumption of vegetables was estimated by the daily intake of salad, raw salad and cooked vegetables.
he consumption of soft drinks (or artiicial juice drinks, such as Tampico) was analyzed from the weekly intake frequency (six possible responses, varying from never to every day of the week); type (regular, diet/light, or both) and number of consumed glasses/cans (pos-sible responses ranging from 1 to 6 or more). For those who could not estimate the amount of consumed soft drinks, the average estab-lished number was one glass.
he intake of saturated fat was assessed with two questions related to meat con-sumption: “when you eat red meat, do you usually: remove the visible fat, eat the meat and the fat, or do not eat meat with a lot of fat”, and “when you eat chicken, do you usually: remove the skin, eat the skin or do not eat pieces of chicken with skin”. he answers were dichotomized into: con-sumption of visible fat in the meat or not, and the consumption of the chicken skin or not, respectively.
Two questions regarding milk sumption also showed the usual con-sumption of saturated fat: weekly frequency of milk consumption (ranging from never to every day of the week) and type of milk (whole, skim or both). From these variables, the daily consumption of whole milk was estimated, including those who consumed both types of milk, as well as the daily con-sumption of skim milk.
Assessment of healthy eating scores
A healthy eating score with the following variables was established: beans, fruits, raw salad, cooked vegetables, milk and soft drinks, in four levels of weekly frequency, as described in Chart 1. he score was calcu-lated from the sum of the punctuation of the items, ranging from 0 to 24 points.
he internal consistency of the score was assessed by the correlation of the items and with the Cronbach’s α coeicient, which was 0.24. Food intake patterns were also assessed by the cluster analysis, with the following variables: intake of fruits, veg-etables, whole and skim milk, regular and diet/light soft drinks, consumption of meat and chicken fat. For the consumption of fruits and vegetables, daily frequency was dichotomized into less than three times a day and three or more times a day, according to the Dietary Guidelines for the Brazilian Population3. he consumption of soft drinks
was assessed as to daily frequency (glasses/ day).
Statistical analysis
Descriptive data analysis was con-ducted by the calculation of the distribution of variables frequency and their respective 95% conidence intervals; concerning continuous variables, the calculation con-sisted of the mean and the standard error, according to year of monitoring.
Chart 1. Components and scoring of the healthy eating index
Quadro 1. Descrição da pontuação utilizada para cálculo do escore de alimentação saudável
0 1 2 3 4
Beans Never/almost never 1–2x /week 3–4x/week 5–6x/week Every day
Fruits Never/almost never 1–2x/week 3–4x/week Every day or 5–6x/
week and 1–2x/day
Every day or 5–6x/week e ≥3x/day
Raw salad Never/almost never 1–2x/week 3–4x/week Every day or 5–6x/
week and 1x/day
Every day or 5–6x/week e 2x/day
Cooked vegetables Never/almost never 1–2x/week 3–4x/week Every day or 5–6x/
week and 1x/day
Every day or 5–6x/week e 2x/day
Milk Never/almost never 1–2x/week 3–4x/week 5–6x/week Every day
Soft drinks Every day 5–6x/week 3–4x/week 1–2x/week Never/almos never or
Simple linear regression models were used to assess temporal variation of the continuous variables in the years of moni-toring. he chi-square test was used to assess the temporal variation of the dis-tribution of frequencies per year of moni-toring. Weighted analyses were conducted using the Statistical Analysis System (SAS), version 9.1.
For the cluster analysis, the 16.0 version of the SPSS k-means procedure was used, which consists of a non-hierarchical cluster technique that classiies individuals in a pre-deined number of clusters by the Euclidean distance, in a way to minimize the distances between observations inside a cluster in relation to the distances between clusters. his requires the previous dei-nition of a number of clusters to be used in the analysis16,20.
he analysis was performed sepa-rately for each year of monitoring, with two hypothetical clusters: a healthy cluster and an unhealthy cluster. In this analysis, F-statistics values identify the food items that contribute the most with the solution of clusters. Variables with high F values present a larger separation between clusters.
Ethical aspects
VIGITEL was approved by the National Committee of Ethics in Research with Human Beings, of the Ministry of Health. Because it was a telephone survey, the verbal consent was obtained instead of the informed consent form.
Results
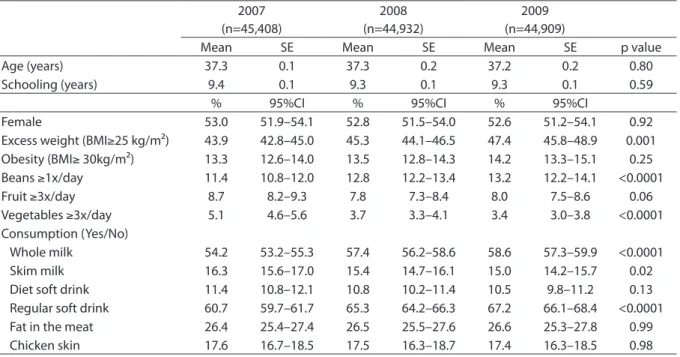
According to the year of monitoring, there was no diference related to sociode-mographic characteristics (age, gender and schooling). he prevalence of excess weight showed statistically signiicant increase over the years (Table 1).
here was statistically signiicant increase in the frequencies of bean, whole milk and regular soft drink intake; mean-while, the consumption of vegetables and
skim milk decreased throughout the years (Table 1). he recommended consumption of three servings of fruit and three servings of vegetables per day was reported by less than 15% of the population in all analyzed years, with a decrease from 5 to 3% for vegetables.
he average healthy eating index score did not change throughout the years (12.2 in 2006, 12.4 in 2007 and 12.4 in 2008). Correlation values between score items ranged from -0.05 to 0.17.
Due to the low internal consistency of the score (Cronbach’s α=0.24), it was not considered a good marker of healthy eating. If the beans were removed, they would be the only item that could increase Cronbach’s
α coeicient to 0.29 (data not shown). he cluster analysis identiied the same patterns in the three evaluated years: cluster I, characterized by the intake of vegetables, fruits, diet/light soft drinks and skim milk, and cluster II, comprised of whole milk, regular soft drinks, visible fat of the meat and chicken skin; however, some items such as fruits and milk did not properly dis-criminate both patterns. According to the F values obtained by the ANOVA table, the variable which presented the largest sepa-ration among clusters were the regular soft drinks. In 2007, 90.7% of the individuals were part of cluster I; in 2008, this per-centage decreased to 86.4% and, in 2009, it was 87.5% (Table 2).
Discussion
he results in this study show that a low percentage of individuals analyzed in VIGITEL met the Dietary Guidelines for the Brazilian Population regarding the intake of fruit, vegetables and beans. We observed four types of evolution: negative (for veg-etables, skim milk and diet soft drinks), positive (for beans, whole milk and regular soft drinks), unstable (for fruit) and with no changes regarding the action of removing the fat from the meat or chicken skin.
Table 1. Socio-demographic characteristics, nutritional status and frequency of consumption of beans, vegetables and other food intake markers, according to survey year
Tabela 1. Características sócio-demográficas, estado nutricional e frequência de consumo de feijão, frutas e hortaliças e outros marcadores da alimentação, no segundo ano de monitoramento
Frequency (%); 95% confidence interval (95%CI); SE – mean and standard error
Frequências (%); intervalo de 95% de confiança (IC95%); SE – médias e erro-padrão 2007
(n=45,408)
2008 (n=44,932)
2009 (n=44,909)
Mean SE Mean SE Mean SE p value
Age (years) 37.3 0.1 37.3 0.2 37.2 0.2 0.80
Schooling (years) 9.4 0.1 9.3 0.1 9.3 0.1 0.59
% 95%CI % 95%CI % 95%CI
Female 53.0 51.9–54.1 52.8 51.5–54.0 52.6 51.2–54.1 0.92
Excess weight (BMI≥25 kg/m²) 43.9 42.8–45.0 45.3 44.1–46.5 47.4 45.8–48.9 0.001
Obesity (BMI≥ 30kg/m²) 13.3 12.6–14.0 13.5 12.8–14.3 14.2 13.3–15.1 0.25
Beans ≥1x/day 11.4 10.8–12.0 12.8 12.2–13.4 13.2 12.2–14.1 <0.0001
Fruit ≥3x/day 8.7 8.2–9.3 7.8 7.3–8.4 8.0 7.5–8.6 0.06
Vegetables ≥3x/day 5.1 4.6–5.6 3.7 3.3–4.1 3.4 3.0–3.8 <0.0001
Consumption (Yes/No)
Whole milk 54.2 53.2–55.3 57.4 56.2–58.6 58.6 57.3–59.9 <0.0001
Skim milk 16.3 15.6–17.0 15.4 14.7–16.1 15.0 14.2–15.7 0.02
Diet soft drink 11.4 10.8–12.1 10.8 10.2–11.4 10.5 9.8–11.2 0.13
Regular soft drink 60.7 59.7–61.7 65.3 64.2–66.3 67.2 66.1–68.4 <0.0001
Fat in the meat 26.4 25.4–27.4 26.5 25.5–27.6 26.6 25.3–27.8 0.99
Chicken skin 17.6 16.7–18.5 17.5 16.3–18.7 17.4 16.3–18.5 0.98
Table 2. Food items grouping identified by cluster analysis, F statistic, and percentage (%) of individuals in each cluster
Tabela 2. Agrupamento de itens alimentares identificados por análise de cluster, estatística F, número (n) e percentual (%) de indivíduos aderidos a cada cluster
Foods 2007 2008 2009
Cluster I Cluster II F Cluster I Cluster II F Cluster I Cluster II F
Vegetables (≥3x day) 0.04 0.03 27 0.04 0.02 25 0.03 0.02 16
Fruit (≥3x day) 0.10 0.09 11 0.09 0.05 104 0.10 0.05 95
Diet/light soft drink (glasses/day) 0.17 0.00 322 0.15 0.00 462 0.14 0.00 411
Skim milk (glasses/day) 0.20 0.08 330 0.20 0.07 543 0.19 0.07 483
Whole milk (glasses/day) 0.43 0.48 52 0.45 0.51 71 0.45 0.50 49
Regular soft drink (glasses/day) 0.47 3.80 85,986 0.38 2.90 85,117 0.40 3.03 87,525
Visible fat in the meat (yes/no) 0.21 0.42 919 0.19 0.42 1475 0.20 0.39 995
Chicken skin (yes/no) 0.14 0.25 399 0.13 0.26 616 0.11 0.24 426
n (%) of individuals in each cluster 37,961 (90.5)
3,975 (9.5)
36,114 (86.4)
5,676 (13.6)
36,631 (87.5)
5,252 (12.5)
demonstrated by the Household Budget Survey (Pesquisa de Orçamentos Familiares – POF) carried out by the Brazilian Institute of Geography and Statistics (IBGE) from 1970 to 2003. he presence of fruit, salads and vegetables in the diet remained rela-tively constant (from 3 to 4%) and below the recommendation of consuming 9 to 12%
of the total calories from this food group. he low intake of fruit and vegetables has also been observed in the United States21,
and some analyses show that even though healthy eating costs more than industri-alized products, it is possible to choose healthy items at a lower cost22. hus, it is
choices. De Bem Lignani et al.23 also
iden-tiied that the higher purchasing power of the population addressed by Brazilian income transfer programs (Bolsa Família) increased the intake of unhealthy foods.
Concerning the consumption of beans, POF identiied a 30% reduction in the household availability of this item in the same period. However, although our data show that the percentage of individuals who consume the adequate amount of beans increased throughout the years, this per-centage remained low.
Milk consumption is recommended as a good source of ribolavin and the main source of calcium in the diet. Nowadays, recommendations addressed to the adult population related to milk consumption are restricted to low fat sources in order to reduce the intake of saturated fat3. Our
data meet the recommendations, once they showed opposite trends for the con-sumption of whole milk and skim milk in the period, with increasing values for the former and decreasing values for the latter. Another marker of saturated fat intake is the consumption of visible fat of meat and chicken. Even though these markers did not present statistically signiicant changes between surveys, about 70% of the partici-pants reported removing the fat of the meat and the chicken skin.
he intake of regular soft drinks, which is a marker of unhealthy eating habits, increased through the years, just as reported in data from POF. In 30 years, the household availability of soft drinks increased 400%24.
he food items analyzed did not allow to establish a global indicator of healthy eating. Methods to assess food intake, such as the construction of indexes and scores, have been proposed to analyze the general quality of the diet and, although most of these methods are able to predict health-related outcomes, the associations have low magnitude25. Besides, the choice of
the variables, cut of values, and the exact method to calculate a score are the main diiculties to develop such instrument25.
In this study, a healthy eating score was established including the following vari-ables: beans, fruits, raw salad, cooked veg-etables, milk and soft drinks. he internal consistency of this score was low, with Cronbach’s α coeicient of 0.24, like that obtained in the healthy eating score evalu-ation used in the United States, the Healthy Eating Index (HEI) – 20057; in this case,
Cronbach’s α coeicient was 0.43, which is higher than the value found in this study, but it is still a moderate consistency value among the items.
Cluster analysis was also unsatis-factory. This method was chosen due to the possibility to produce mutually exclusive clusters and to identify a healthy pattern. This procedure is also justified by the heterogeneity of the sample and by the initial intention of keeping all the food items that were proposed, as well as having the advantage to classify indi-viduals in only one pattern15. Despite the
fact that this method led to the identifi-cation of a cluster comprised of foods con-sidered healthy or frequently consumed by individuals who are more concerned about their health, and of another cluster comprised by items that are considered unhealthy, there were high percentages (around 90%) of adherence to cluster I, which is closer to healthy eating habits, in all investigated years. This clearly does not represent the eating habits of the Brazilian population24. Besides, the mean
consumption of the food items did not significantly vary between the identified clusters. This may be explained by the low percentage of individuals who consume in accordance with the Ministry of Health guidelines related to fruits and vege-tables25. However, the employed
from the assessed items. Thus, those items represent different consumption dimen-sions considered adequate by the guide-lines discussed for HEI 2005-US4,7.
It is worth to emphasize that the three analyzed years may not be suicient to detect great changes regarding the con-sumption of the assessed items. Besides, the changes observed in this short period may relect alterations in price, distribution or access to the products.
Among the analyzed items, the regular soft drinks represented the largest sepa-ration between clusters, which demon-strates that this item is the one that dis-criminates food intake the most. hus, this item is essential to investigate food intake of populations.
Monteiro et al.26 demonstrated good
reproducibility and adequate validation for most of the questions in the eating analysis of VIGITEL; thus, the non recovery of a sole
healthy eating construct is not a result of information bias.
Factors that could explain the diiculty of questions present in VIGITEL to deine healthy eating habits included: 1) the absence of questions regarding the intake of unhealthy foods in Brazil, like crackers – which increased 400% in 30 years24,
according to data from POF –, pastry and fast food; 2) the low percentage of individuals who presented inadequate consumption of healthy items, such as fruits and vegetables; 3) the complexity and the multidimension-ality of this construct.
he inclusion of new variables in the eating analysis of VIGITEL and the iden-tiication of items that do not characterize health consumption may contribute with the construction of eating patterns that discriminate more and identify individuals with eating habits considered risky for chronic non-communicable diseases.
References
1. Brasil. Sistema de informações sobre mortalidade. Brasília: Ministério da Saúde, 2010. [cited 2010 Dez 06]. Available from: http://tabnet.datasus.gov.br/cgi/tabcgi.exe?sim/cnv/ obt10uf.def
2. World Health Organization. Reducing risks, promoting healthy life. Geneva: WHO; 2002.
3. Ministério da Saúde. Secretaria de Atenção à Saude. Coordenação-Geral da Política de Alimentação e Nutrição. Guia alimentar para a população brasileira: promovendo a alimentação saudável. Brasília: Ministério da Saúde; 2006.
4. Estados Unidos. Department of Agriculture, Agricultural Research Service. Center for Nutrition Policy and Promotion. Report of the Dietary Guidelines Advisory Committee on the Dietary Guidelines for American, 2010. USDA; 2010. [cited 2011 Jun 15]. Available from: http:// www.cnpp.usda.gov/Publications/DietaryGuidelines/2010/ DGAC/Report/2010DGACReport-camera-ready-Jan11-11. pdf.
5. Jaime PC, Figueiredo IC, Moura EC, Malta DC. Factors associated with fruit and vegetable consumption in Brazil, 2006. Rev Saúde Pública2009; 43 Suppl 2:57-64.
6. Hu FB. Dietary pattern analysis: a new direction in nutritional epidemiology. Curr Opin Lipidol. 2002;13(1):3-9.
7. Guenther P, Reedy J, Krebs-Smith S, Reeve B, Basiotis P. Development and Evaluation of the Healthy Eating Index – 2005: Techinical Report.: Center for Nutrition Policy and
Promotion. United States. Department of Agriculture – 2007. [cited 2010 Dez 06]. Available from: http://www.cnpp.usda. gov/Publications/HEI/HEI-2005/HEI-2005TechnicalReport. pdf8.
8. Fisberg RM, Slater B, Barros RR, Lima FD, Cesar CLG, Carandina L, et al. Índice de Qualidade da Dieta: avaliação da adaptação e aplicabilidade. Rev. de Nutr. 2004;17(3):301-8.
9. Panagiotakos D. α-priori versus α-posterior methods in
dietary pattern analysis: a review in nutrition epidemiology. Nutr Bull. 2008;33(4):311-15.
10. James DC. Cluster analysis deines distinct dietary patterns for African-American men and women. J Am Diet Assoc. 2009;109(2):255-62.
11. Newby PK, Muller D, Hallfrisch J, Qiao N, Andres R, Tucker KL. Dietary patterns and changes in body mass index and waist circumference in adults. Am J Clin Nutr. 2003;77(6):1417-25.
12. Cunha DB, de Almeida RM, Sichieri R, Pereira RA. Association of dietary patterns with BMI and waist circumference in a low-income neighbourhood in Brazil. Br J Nutr. 2010;104(6):908-13.
14. Sichieri R, Castro JF, Moura AS. Fatores associados ao padrão de consumo alimentar da população brasileira urbana. Cad Saúde Pública. 2003;19 Suppl 1:S47-53.
15. Hearty AP, Gibney MJ. Comparison of cluster and principal component analysis techniques to derive dietary patterns in Irish adults. Br J Nutr2009;101(4):598-608.
16. Jinlin F, Binyou W, Terry C. A new approach to the study of diet and risk of type 2 diabetes. J Postgrad Med. 2007;53(2):139-43.
17. Olinto MTA. Padrões alimentares: análise de componentes principais. In: Kac G SR, Gigante DP (editor). Epidemiologia Nutricional. Rio de Janeiro: Fiocruz; 2007. p. 213-25
18. Moura EC, Neto OLM, Malta DC, Moura L, Silva NN, Bernal R, et al. Vigilância de fatores de risco para doenças crônicas por inquérito telefônico nas capitais dos 26 estados brasileiros e no Distrito Federal (2006). Rev Bras Epidemiol. 2008;11 Suppl 1:20-37.
19. World Health Organization. Obesity: preventing and managing the global epidemic. Geneva: WHO; 1997.
20. Schulze MB, Hu FB. Dietary patterns and risk of
hypertension, type 2 diabetes mellitus, and coronary heart disease. Curr Atheroscler Rep. 2002;4(6):462-7.
21. Li R, Serdula M, Bland S, Mokdad A, Bowman B, Nelson D. Trends in fruit and vegetable consumption among adults in 16 US states: Behavioral Risk Factor Surveillance System, 1990 – 1996. Am J Public Health. 2000; 90(5):777-81.
22. Bernstein AM, Bloom DE, Rosner BA, Franz M, Willett WC. Relation of food cost to healthfulness of diet among US women. Am J Clin Nutr. 2010;92(5):1197-203.
23. de Bem Lignani J, Sichieri R, Burlandy L, Salles-Costa R. Changes in food consumption among the Programa Bolsa Família participant families in Brazil. Public Health Nutr. 2011;14(5):785-92.
24. Levy-Costa RB, Sichieri R, Pontes Ndos S, Monteiro CA. Disponibilidade domiciliary de alimentos no Brasil: distribuição e evolução (1974 – 2003). Rev Saúde Pública. 2005;39(4):530-40.
25. Waijers PM, Feskens EJ, Ocké MC. A critical review of predeined diet quality scores. Br J Nutr. 2007;97(2): 219-31.
26. Monteiro CA, Moura EC, Jaime PC, Claro RM. Validade de indicadores do consumo de alimentos e bebidas obtidos por inquérito telefônico. Rev Saúde Pública. 2008;42(4):582-9.