Denise P GiganteI Gicele C MintenI Bernardo L HortaI Fernando C BarrosII Cesar G VictoraI
I Programa de Pós-Graduação em Epidemiologia. Universidade Federal de Pelotas. Pelotas, RS, Brasil
II Programa de Pós-Graduação em Saúde e Comportamento. Universidade Católica de Pelotas. Pelotas, RS, Brasil
Correspondence: Denise Petrucci Gigante Programa de Pós-Graduação em Epidemiologia – UFPEL Rua Mal Deodoro, 1160 96020-220 Pelotas, RS, Brasil E-mail: [email protected] Received: 10/10/2007
Revised: 9/10/2008 Approved: 9/19/2008
Nutritional evaluation
follow-up of the 1982 birth cohort,
Pelotas, Southern Brazil
ABSTRACT
OBJECTIVE: To estimate the prevalence of over/underweight and its association with demographic and socioeconomic factors.
METHODS: Longitudinal cohort study of youths born in 1982 in Pelotas, Southern Brazil. In 2004-5 we interviewed 4,198 of the 5,914 cohort subjects, obtaining weight and stature measurements that were used to calculate body
mass index (BMI). Underweight was defi ned as BMI lower than 18,5 kg/m2;
overweight as BMI between 25 and 30kg/m2; and obesity as BMI IMC
≥ 30kg/m2. The effects of socioeconomic (family income and schooling)
and demographic (skin color) variables, birthweight, and breastfeeding on underweight, overweight, and obesity were analyzed separately for men and women using Poisson regression.
RESULTS: Prevalence of underweight, obesity, and overweight were 6.0%, 8.2%, and 28.9%, respectively. In adjusted analysis, only birthweight remained associated with underweight among men and women. Poor men showed higher risk of underweight, but were protected from obesity and overweight. By contrast, risk of obesity and overweight was higher among poor women.
CONCLUSIONS: The present results underscore the importance of socioeconomic determinants on nutritional status, with special emphasis on the distinct effects these factors have among men and women in different nutritional conditions.
DESCRIPTORS: Adult. Nutrition Assessment. Obesity, epidemiology. Defi ciency Diseases, epidemiology. Socioeconomic Factors. Cohort Studies. Brazil.
INTRODUCTION
Beginning in the 1960’s, the World Health Organization (WHO) has proposed nutritional evaluation systems for the early detection of nutritional problems highly prevalent in different settings as a basis for developing preventive and control measures.5
In 1995, WHO proposed the use of the body mass index (BMI) as a defi nition of various degrees of underweight, overweight, and obesity.21
Global estimates for 2005 indicated that 1.6 billion adults were classifi ed as overweight, and 400 million as obese. Although these problems were initially de-scribed only among adults, they currently affect also children and adolescents, with an estimated 20 million overweight children aged up to fi ve years worldwide.a
Almost one-half of the global burden of disease is due to problems related to nutritional status, be it over or underweight, as determined both by BMI and diet.b
The aim of the present article was to estimate the preva-lence of malnutrition – either by over or underweight – and determine its associated factors in a cohort of subjects followed since their birth in 1982.
METHODS
The present analysis refers to the birth cohort study initiated in Pelotas, Southern Brazil, in Southern Brazil, in 1982. Detailed methodological information on this study has been published previously (Victora et al17,18
2003 e 2006; Barros et al2).
In 2004-5, 4,297 of the 5,914 youths born in 1982 were visited for nutritional evaluation. We excluded from this analysis 90 women in the third to ninth months of pregnancy, representing 4.3% of the women in the sample. Therefore, our results pertain to 4,198 youths whose anthropometric information allowed for nutri-tional evaluation. Weight was measured using portable electronic scales (Seca uniscale®, Alemanha) with 100g precision. Aluminum anthropometers were used to ob-tain height measures. Weight and height measures were obtained following the recommendations of Lohmann et al,8 and all interviewers were trained in obtaining
these measures. Underweight, overweight, and obesity were defi ned based on BMI (weight divided by height in meters squared), according to criteria established by WHO.21 Subjects with BMI<18.5 kg/m2 were
clas-sifi ed as underweight; those with BMI between 25
and 30kg/m2, as overweight, and those with BMI≥30
kg/m2, as obese.
Independent variables included demographic factors (sex and skin color); socioeconomic factors (family income in 1982, change in income from 1982 to 2004-5, and schooling); birthweight, and duration of breastfeeding. The variable change in income was constructed based on the distribution in terciles of income distribution in 1982 and 2004-5; subjects were classifi ed into the following categories: always poor (those in the lowest family income tercile in both 1982 and 2004-5); poor → non poor (lowest tercile in 1982 to middle or upper tercile in 2004-5); non poor → poor (middle or upper tercile in
a Word Health Organization. Obesity and overweight [internet]. Sept. 2006. (Fact sheet, 311) [cited 2007 Jul 13]. Available from: http: www. who.int/mediacentre/factsheets/fs311/en/index.html
b Word Health Organization. Challenges [internet]. [cited 2007 May 20]. Available from: http: www.who.int/nutrition/challenges/en/index. html
1982 to lower tercile in 2004-5); and never poor (middle or upper tercile in both 1982 and 2004-5).
We used Poisson regression to investigate the effect of these variables on the occurrence of underweight, over-weight, and obesity. Prevalence ratios and their respec-tive confi dence intervals were presented as estimates of risk. Risks were compared using the Wald test for heterogeneity or linear trend when applicable. Analysis was stratifi ed by sex and adjusted according to a hier-archic analysis model including skin color and family income in 1982 (or, in an alternative analysis, change in income in the period) in the fi rst level; birthweight in the second level; and breastfeeding and youth’s schooling in the third level. Results were adjusted for any variables in the preceding level associated with the outcomes with p<0.20.
Verbal informed consent was obtained from guardians in study phases between 1982 and 1986, following common practice at the time, when an ethics committee was not available at the Federal University of Pelotas. In more recent stages, the study received the approval of the university’s Research Ethics Committee, affi
li-ated to the Conselho Nacional de Ética em Pesquisa
(National Research Ethics Committee – CONEP), and written informed consent was obtained.
RESULTS
Mean BMI was 23.6±4.4 kg/m2 for the entire sample,
and differed signifi cantly between men (23.8±4.1 kg/ m2) and women (23.4±4.7 kg/m2). Prevalence of
un-derweight, obesity, and overweight were, respectively, 6.0%, 8.2%, and 28.9% in the entire sample, and also varied according to sex.
linear effect of lower family income in 1982 on greater prevalence of underweight among men.
Tables 3 and 4 present crude prevalences of obesity and overweight, respectively, for each independent variable. Associations differed according to sex. For skin color, prevalences of obesity and overweight were greater among black or mixed women, but showed no
differ-ence among men. Prevaldiffer-ence of obesity and overweight was greater among men of high socioeconomic level and poor women. Greater prevalence of overweight and obesity were also seen among subjects with higher birthweight (with the exception of obesity among women). Obesity and overweight were more prevalent among men who were breastfed for 6 to 8.9 months
Table 1. Prevalence of underweight (BMI<18.5 kg/m2) according to demographic and socioeconomic variables, birthweight,
and breastfeeding. Pelotas, Southern Brazil, 1982 to 2004-5.
Variable Total Men Women
n % n % n %
Skin color p = 0.09* p = 0.72* p = 0.16*
White 3170 6.4 1653 5.0 1517 7.9
Black or Mixed 882 5.7 469 4.7 413 6.8
Family income -1982 (MW) p = 0.33** p = 0.09** p = 0.92**
≤1 826 6.1 438 4.6 388 7.7
1.1 – 3 2079 6.6 1092 5.9 987 7.4
3.1 – 6 788 5.6 415 3.9 373 7.5
6.1 – 10 244 5.3 128 3.9 116 6.9
>10 240 5.0 123 1.6 117 8.5
Change in income (1982 → 2004-5) p = 0.45** p = 0.05* p = 0.61**
Always poor 682 6.6 334 4.5 348 8.6
Non poor → poor 697 7.0 340 2.8 357 7.3
Poor →non poor 649 4.8 360 7.4 289 6.7
Never poor 2170 6.1 1172 4.9 998 7.5
Birthweight (grams) p <0.001** p <0.001** p <0.001**
<2500 295 10.8 135 8.1 160 13.1
2500 - 2999 994 8.1 450 6.9 544 9.2
3000 - 3499 1588 6.4 846 4.8 742 8.1
3500 - 3999 1081 3.5 610 3.6 471 3.4
≥4000 239 2.1 165 1.2 74 4.1
Breastfeeding (months) p = 0.04** p = 0.42** p = 0.03**
<1.0 885 7.3 482 5.2 403 9.9
1.0 - 2.9 1049 5.9 542 4.6 507 7.3
3.0 - 5.9 934 6.5 484 5.6 450 7.6
6.0 - 8.9 380 6.8 201 6.0 179 7.8
9.0 - 11.9 157 5.1 83 2.4 74 8.1
≥12.0 661 4.4 335 3.9 326 4.9
Youth’s schooling (years) p = 0.51** p = 0.30** p = 0.53**
0 - 4 337 7.7 206 6.3 131 9.9
5 - 8 1172 6.0 716 4.7 456 7.9
9 - 11 2028 5.9 1010 5.0 1018 6.9
≥12 661 6.2 274 3.6 387 8.0
Total 4198 6.0 2206 4.9 1992*** 7.5
MW: Minimum wages
* Chi-square test for heterogeneity ** Chi-square test for linear trend
(p=0.05) and women who were breastfed for 9 to 11.9
months (p=0.03), respectively. These prevalences
were also higher among women with lesser schooling,
whereas overweight was more frequent among men
with greater schooling.
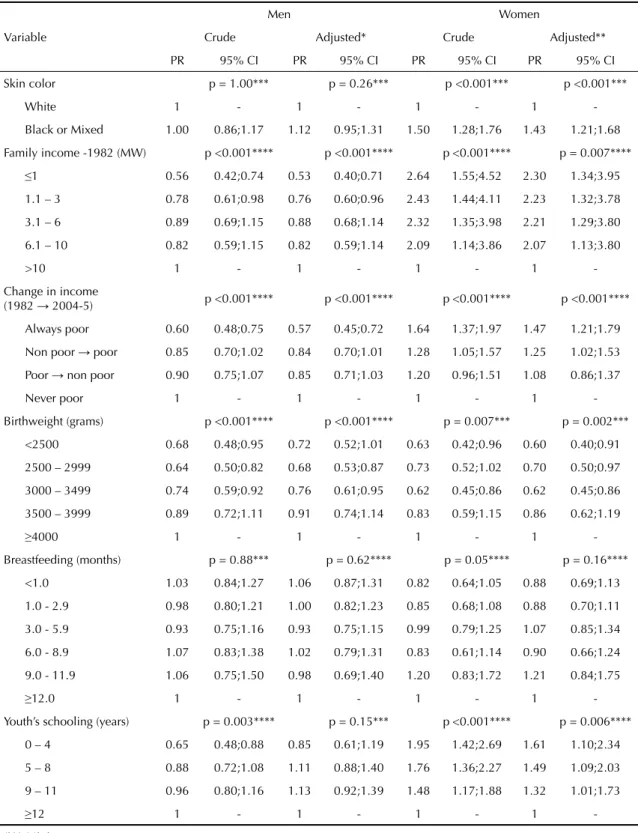
Adjusted results for obesity and overweight were similar. Table 5 presents only the results of crude and adjusted analysis of the effects of independent variables on overweight. In the hierarchic analysis, associations with skin color, family income, change in income, and birthweight were maintained. The association between
Table 2. Crude and adjusted analysis of the effect of independent variables on occurrence of underweight. Pelotas, Southern Brazil, 1982 to 2004-5.
Variable
Men Women
Crude Adjusted* Crude Adjusted**
PR 95% CI PR 95% CI PR 95% CI PR 95% CI
Skin color p = 0.77*** p = 0.46*** p = 0.45*** p = 0.39***
White 1 - 1 - 1 - 1
-Black or Mixed 0.93 0.59;1.48 0.86 0.54;1.38 0.86 0.58;1.27 0.85 0.57;1.26
Family income -1982 (MW) p = 0.06**** p = 0.04**** p = 0.92**** p = 0.89****
≤1 2.80 0.67;11.85 3.01 0.71;12.82 0.90 0.46;1.80 0.95 0.49;1.94
1.1 - 3 3.60 0.89;14.55 3.75 0.93;15.16 0.87 0.46;1.63 0.91 0.48;1.71
3.1 - 6 2.37 0.55;10.17 2.39 0.56;10.26 0.88 0.44;1.75 0.90 0.45;1.80
6.1 - 10 2.40 0.47;12.16 2.40 0.47;12.14 0.81 0.33;1.97 0.82 0.33;2.00
>10 1 - 1 - 1 - 1
-Change in income
(1982→ 2004-5) p = 0.05*** p = 0.06*** p = 0.73**** p = 0.48****
Always poor 0.92 0.53;1.61 0.95 0.54;1.69 1.15 0.76;1.72 1.26 0.83;1.92
Non poor → poor 1.51 0.96;2.38 1.52 0.97;2.40 0.89 0.57;1.39 0.92 0.59;1.43
Poor→ non poor 0.57 0.29;1.11 0.59 0.30;1.15 0.97 0.61;1.54 1.04 0.65;1.67
Never poor 1 - 1 0.53;1.89 1 - 1
-Birthweight (grams) p <0.001**** p <0.001**** p <0.001**** p <0.001****
<2500 6.72 1.52;29.82 6.28 1.44;27.49 3.24 1.00;10.52 3.24 1.00;10.52
2500 - 2999 5.68 1.38;23.49 5.47 1.33;22.39 2.27 0.73;7.09 2.27 0.73;7.09
3000 - 3499 4.00 0.98;16.37 3.88 0.95;15.82 1.99 0.64;6.21 1.99 0.64;6.21
3500 - 3999 2.98 0.71;12.53 2.92 0.70;12.26 0.84 0.25;2.81 0.84 0.25;2.81
≥4000 1 - 1 - 1 - 1
-Breastfeeding (months) p = 0.41**** p = 0.67**** p = 0.03**** p = 0.07****
<1.0 1.34 0.69;2.57 1.21 0.63;2.35 2.02 1.15;3.54 1.86 1.07;3.25
1.0 - 2.9 1.19 0.62;2.29 1.12 0.58;2.15 1.49 0.84;2.63 1.44 0.81;2.54
3.0 - 5.9 1.44 0.75;2.75 1.41 0.74;2.70 1.54 0.86;2.74 1.53 0.86;2.72
6.0 - 8.9 1.54 0.72;3.31 1.57 0.73;3.38 1.59 0.80;3.19 1.53 0.76;3.07
9.0 - 11.9 0.62 0.14;2.70 0.68 0.16;2.96 1.65 0.67;4.08 1.80 0.73;4.44
≥12.0 1 - 1 - 1 - 1
-Youth’s schooling (years) p = 0.30**** p = 0.93**** p = 0.55**** p = 0.77****
0 – 4 1.76 0.77;3.87 1.25 0.49;3.22 1.24 0.67;2.30 0.97 0.51;1.84
5 – 8 1.30 0.65;2.60 1.00 0.45;2.24 0.99 0.62;1.56 0.81 0.51;1.30
9 – 11 1.36 0.70;2.64 1.15 0.54;2.45 0.86 0.57;1.29 0.78 0.52;1.17
≥12 1 - 1 - 1 - 1
-MW: Minimum wages
* Variables in the fi rst level (skin color, family income in 1982) adjusted for each other. Change in income adjusted for skin color. Breastfeeding and youth’s schooling adjusted for birthweight.
** Variables in the fi rst level (skin color, family income in 1982) adjusted for each other. Change in income adjusted for skin color. Breastfeeding adjusted for birthweight and youth’s schooling adjusted for breastfeeding and birthweight.
breastfeeding and overweight observed among women disappeared after control for the effect of the distal vari-able socioeconomic conditions at birth or of the inter-mediate variable birthweight. The association between schooling and overweight among men vanished after adjustment for a hierarchically superior socioeconomic variable, such as family income, and for birthweight. This same association was inverse among women, and remained signifi cant after adjustment.
In the case of obesity, adjusted analyses showed similar associations, with the exception of birthweight, which was positively associated with obesity only among men (data not shown).
In adjusted analysis, risk of obesity or overweight fell by half among poorer men. Poorer women showed two to ten-fold greater risk of overweight or obesity when compared to those coming from families who earned over ten minimum wages.
Table 3. Prevalence of obesity (BMI≥30 kg/m2) according to demographic and socioeconomic variables, birthweight, and
breastfeeding. Pelotas, Southern Brazil, 1982 to 2004-5.
Variable Total Men Women
n % n % n %
Skin color p = 0.18* p = 0.17* p = 0.001*
White 3170 7.7 1653 7.6 1517 7.8
Black or Mixed 882 9.1 469 5.8 413 12.8
Family income -1982 (MW) p = 0.19** p = 0.03** p = 0.001**
≤1 826 7.9 438 5.9 388 10.1
1.1 - 3 2079 8.8 1092 7.1 987 10.7
3.1 - 6 788 8.4 415 9.4 373 7.2
6.1 - 10 244 5.3 128 7.0 116 3.4
>10 240 6.3 123 11.4 117 0.9
Change in income (1982 → 2004-5) p = 0.04** p = 0.02** p <0.001**
Always poor 682 10.3 334 4.8 348 15.5
Non poor → poor 697 8.6 340 7.9 357 9.2
Poor → non poor 649 7.1 360 5.6 289 9.0
Never poor 2170 7.7 1172 8.8 998 6.4
Birthweight (grams) p = 0.006** p = 0.002** p = 0.31**
<2500 295 3.4 135 0.7 160 5.6
2500 - 2999 994 8.0 450 6.4 544 9.4
3000 - 3499 1588 8.5 846 8.0 742 9.0
3500 - 3999 1081 8.2 610 8.0 471 8.5
≥4000 239 12.1 165 11.5 74 13.5
Breastfeeding (months) p = 0.11** p = 0.05* p = 0.10**
<1.0 885 8.4 482 8.7 403 7.9
1.0 - 2.9 1049 6.7 542 6.5 507 6.9
3.0 - 5.9 934 8.1 484 5.8 450 10.7
6.0 - 8.9 380 9.5 201 12.4 179 6.1
9.0 - 11.9 157 10.2 83 7.2 74 13.5
≥12.0 661 9.4 335 8.4 326 10.4
Youth’s schooling (years) p = 0.003** p = 0.32* p <0.001**
0 - 4 337 10.4 206 7.3 131 15.3
5 - 8 1172 9.7 716 8.2 456 12.1
9 - 11 2028 7.4 1010 6.5 1018 8.3
≥12 661 6.7 274 9.5 387 4.7
Total 4198 8.2 2206 7.5 1992*** 8.9
MW: Minimum wages
* Chi-square test for heterogeneity ** Chi-square test for linear trend
DISCUSSION
Our results show that over one-third of young adults from the 1982 birth cohort are malnourished, defi ned as BMI below (6% of the cohort) or above (29%) levels considered normal.
Among women, prevalence of underweight (7.5%) was
similar to that seen in the state of Rio Grande do Sul (6.7%), but lower than the national prevalence (12.0%) reported for women aged 20-24 years in the
2002-2003 Pesquisa Nacional de Orçamentos Familiares
(National Household Budget Survey – POF).a Obesity
was more frequent among cohort subjects than among women from Rio Grande do Sul (7.4%) or from Brazil as a whole (4.7%).a
a Instituto Brasileiro de Geografi a e Estatística. Pesquisa de orçamentos familiares: análise de disponibilidade domiciliar de alimentos do estado nutricional no Brasil. Rio de Janeiro; 2004
Table 4. Prevalence of overweight (≥25 kg/m2) according to demographic and socioeconomic variables, birthweight, and
breastfeeding. Pelotas, Southern Brazil, 1982 to 2004-5.
Variable Total Men Women
n % n % n %
Skin color p = 0.002* p = 0.97* p <0.001*
White 3170 27.1 1653 30.5 1517 23.4
Black or Mixed 882 32.7 469 30.5 413 35.1
Family income -1982 (MW) p = 0.14* p <0.001** p = 0.001**
≤1 826 25.5 438 22.1 388 29.4
1.1 - 3 2079 29.1 1092 31.0 987 27.1
3.1 - 6 788 30.8 415 35.4 373 25.7
6.1 - 10 244 28.3 128 32.8 116 23.3
>10 240 25.8 123 39.8 117 11.1
Change in income (1982 → 2004-5) p = 0.95** p <0.001** p <0.001**
Always poor 682 28.3 334 20.4 348 35.9
Non poor → poor 697 28.4 340 30.6 357 26.3
Poor → non poor 649 28.7 360 28.8 289 28.0
Never poor 2170 28.4 1172 34.0 998 21.8
Birthweight (grams) p <0.001** p <0.001** p = 0.03**
<2500 295 24.7 135 26.7 160 23.1
2500 - 2999 994 26.0 450 25.1 544 26.7
3000 - 3499 1588 26.1 846 29.1 742 22.6
3500 - 3999 1081 33.0 610 35.2 471 30.1
≥4000 239 38.5 165 39.4 74 36.5
Breastfeeding (months) p = 0.22** p = 0.99** p = 0.03**
<1.0 885 27.8 482 31.7 403 23.1
1.0 - 2.9 1049 27.3 542 30.3 507 24.1
3.0 - 5.9 934 28.4 484 28.7 450 28.0
6.0 - 8.9 380 28.4 201 32.8 179 23.5
9.0 - 11.9 157 33.1 83 32.5 74 33.8
≥12.0 661 29.5 335 30.7 326 28.2
Youth’s schooling (years) p = 0.04* p = 0.004** p <0.001**
0 - 4 337 26.7 206 21.8 131 34.4
5 - 8 1172 30.1 716 29.6 456 30.9
9 - 11 2028 29.1 1010 32.3 1018 26.0
≥12 661 24.2 274 33.6 387 17.6
Total 4198 28.9 2206 30.6 1992*** 26.1
MW: Minimum wages
* Chi-square test for heterogeneity ** Chi-square test for linear trend
Table 5. Crude and adjusted analysis of the effect of independent variables on occurrence of overweight. Pelotas, Southern Brazil, 1982 to 2004-5.
Variable
Men Women
Crude Adjusted* Crude Adjusted**
PR 95% CI PR 95% CI PR 95% CI PR 95% CI
Skin color p = 1.00*** p = 0.26*** p <0.001*** p <0.001***
White 1 - 1 - 1 - 1
-Black or Mixed 1.00 0.86;1.17 1.12 0.95;1.31 1.50 1.28;1.76 1.43 1.21;1.68
Family income -1982 (MW) p <0.001**** p <0.001**** p <0.001**** p = 0.007****
≤1 0.56 0.42;0.74 0.53 0.40;0.71 2.64 1.55;4.52 2.30 1.34;3.95
1.1 – 3 0.78 0.61;0.98 0.76 0.60;0.96 2.43 1.44;4.11 2.23 1.32;3.78
3.1 – 6 0.89 0.69;1.15 0.88 0.68;1.14 2.32 1.35;3.98 2.21 1.29;3.80
6.1 – 10 0.82 0.59;1.15 0.82 0.59;1.14 2.09 1.14;3.86 2.07 1.13;3.80
>10 1 - 1 - 1 - 1
-Change in income
(1982 → 2004-5) p <0.001**** p <0.001**** p <0.001**** p <0.001****
Always poor 0.60 0.48;0.75 0.57 0.45;0.72 1.64 1.37;1.97 1.47 1.21;1.79
Non poor → poor 0.85 0.70;1.02 0.84 0.70;1.01 1.28 1.05;1.57 1.25 1.02;1.53
Poor → non poor 0.90 0.75;1.07 0.85 0.71;1.03 1.20 0.96;1.51 1.08 0.86;1.37
Never poor 1 - 1 - 1 - 1
-Birthweight (grams) p <0.001**** p <0.001**** p = 0.007*** p = 0.002***
<2500 0.68 0.48;0.95 0.72 0.52;1.01 0.63 0.42;0.96 0.60 0.40;0.91
2500 – 2999 0.64 0.50;0.82 0.68 0.53;0.87 0.73 0.52;1.02 0.70 0.50;0.97
3000 – 3499 0.74 0.59;0.92 0.76 0.61;0.95 0.62 0.45;0.86 0.62 0.45;0.86
3500 – 3999 0.89 0.72;1.11 0.91 0.74;1.14 0.83 0.59;1.15 0.86 0.62;1.19
≥4000 1 - 1 - 1 - 1
-Breastfeeding (months) p = 0.88*** p = 0.62**** p = 0.05**** p = 0.16****
<1.0 1.03 0.84;1.27 1.06 0.87;1.31 0.82 0.64;1.05 0.88 0.69;1.13
1.0 - 2.9 0.98 0.80;1.21 1.00 0.82;1.23 0.85 0.68;1.08 0.88 0.70;1.11
3.0 - 5.9 0.93 0.75;1.16 0.93 0.75;1.15 0.99 0.79;1.25 1.07 0.85;1.34
6.0 - 8.9 1.07 0.83;1.38 1.02 0.79;1.31 0.83 0.61;1.14 0.90 0.66;1.24
9.0 - 11.9 1.06 0.75;1.50 0.98 0.69;1.40 1.20 0.83;1.72 1.21 0.84;1.75
≥12.0 1 - 1 - 1 - 1
-Youth’s schooling (years) p = 0.003**** p = 0.15*** p <0.001**** p = 0.006****
0 – 4 0.65 0.48;0.88 0.85 0.61;1.19 1.95 1.42;2.69 1.61 1.10;2.34
5 – 8 0.88 0.72;1.08 1.11 0.88;1.40 1.76 1.36;2.27 1.49 1.09;2.03
9 – 11 0.96 0.80;1.16 1.13 0.92;1.39 1.48 1.17;1.88 1.32 1.01;1.73
≥12 1 - 1 - 1 - 1
-MW: Minimum wages
* Variables in the fi rst level (skin color, family income in 1982) adjusted for each other. Change in income adjusted for skin color. Birthweight adjusted for family income. Breastfeeding adjusted for family income and birthweight. Youth’s schooling adjusted for income and birthweight.
** Variables in the fi rst level (skin color, family income in 1982) adjusted for each other. Change in income adjusted for skin color. Birthweight adjusted for skin color and family income. Breastfeeding adjusted for skin color, income, and birthweight. Youth’s schooling adjusted for skin color, income, birthweight, and breastfeeding.
Among men aged 20-24 years, prevalence of under-weight reported by the POF was 4.4% for Brazil and 3.4% for the state of Rio Grande do Sul, compared to 4.9% in the cohort. Prevalence of obesity was higher in the cohort (7.5%) than in the state (5.2%) or the country (3.1%).a
The results of the POFa for the Brazilian population
show an inverse relation between family income and weight among women. Prevalence of underweight was always higher among women with per capita family income below one-quarter of a minimum wage (8.5%). Among men, prevalence was below 5% across all so-cioeconomic groups.a However, in the present study, we
found no association between income and underweight in women, but an inverse trend for this relationship was seen among men.
The association between birthweight and underweight among cohort subjects confi rmed the results of studies showing a positive correlation between birthweight and adult BMI.11,13,15 As to duration of breastfeeding, we are
unable to present comparative data, since the literature reviewed is defi cient in this particular aspect.
Regarding factors associated to obesity and overweight, the higher risk found among black and mixed women confi rms results reported in the United States.4,9
Stud-ies carried out in Brazilian citStud-ies show contradictory results. A cross-sectional, population-based study of adults from Pelotas6 failed to detect an association
between obesity and skin color. In Rio de Janeiro, gain of weight across a ten-year period was found to be greater among black and mixed women than among white women, even after adjustment for socioeconomic conditions throughout life.3
In less developed countries, overweight or obesity were historically more frequent among those of higher socioeconomic level.14 However, Monteiro et al10 (2004)
showed that, in middle-income countries, overweight is becoming increasingly frequent among the poor, and that this inversion occurs earlier for women than for men.
In Brazil, in 1989, overweight and obesity were more
prevalent among rich men and women.b Results from
the POFa show a direct relationship between income
and obesity among men, but not among women; how-ever, greater prevalences among women are found in the intermediate income groups. Increased prevalence of overweight has been observed among men from all of the country’s Regions and of all income levels
between 1989 and 2003.a Among women, prevalence
has increased in the country’s Northeast Region and among families with lower monthly income, whereas in the remaining regions and in higher-income classes
prevalence of overweight has either remained stable or declined (IBGE 2004).a
Birthweight was positively associated with overweight among men and women from our cohort, and with prevalence of obesity among men, confi rming previous
fi ndings.1,16 The same association was also reported for
our cohort when subjects were 15 and 18 years old.11,15
A hypothesis has been proposed according to which weight at birth would contribute mostly to the acquisi-tion of lean mass rather than fat mass.15,16,20 However,
we do not have suffi cient data on the evolution of body composition among members of our cohort to allow us to identify the time of onset of this nutritional disorder. We thus chose to use Poisson regression in order to estimate risks associated with the studied outcomes in terms of prevalence ratios.
The inverse association between schooling and over-weight or obesity among women corroborates previous
fi ndings.6,10 For men, however, data in the literature are
controversial. Positive associations have been observed in seven of the studies included in a review of surveys from developing countries,10 but another seven studies
did not detect such association, as was the case for our cohort. In the hierarchic analysis model used in the pres-ent study, the effect of a distal socioeconomic variable such as family income at birth would be related to the level of schooling of the youth. However, one must also consider the effect of current income, given that risk of overweight was greater among those whose income decreased between 1982 and 2004-5.
A meta-analysis study has shown that subjects who were breastfed showed lower frequency of overweight and obesity, irrespective of duration of breastfeeding.7
In the present study, no association was detected,
con-fi rming previous analyses of this same cohort carried out when subjects were acolescents.17
The high prevalence of overweight and obesity among young adults shows a pressing need for adequate pre-vention and control measures in order to prevent the emergence of morbidities related to nutritional status. Intervention priority should be given to subgroups among which nutritional problems are more frequent, namely men of all income levels and poor women. Although obe-sity and overweight were more frequent among men from higher-income families, no association was found with respect to schooling. This aspect should be considered when planning intervention at the educational level.
As to underweight, the need for interventions aimed at preventing this condition among the poor is questionable, especially given the possibility of consequent increases in overweight and obesity, especially among women.
a Instituto Brasileiro de Geografi a e Estatística. Pesquisa de orçamentos familiares: análise de disponibilidade domiciliar de alimentos do estado nutricional no Brasil. Rio de Janeiro; 2004
1. Baird J, Fisher D, Lucas P, Kleijnen J, Roberts H, Law C. Being big or growing fast: systematic review of size and growth in infancy and later
obesity. BMJ. 2005;331(7522):929. DOI: 10.1136/
bmj.38586.411273.E0
2. Barros FC, Victora CG, Horta BL, Gigante DP. Metodologia do estudo da coorte de nascimentos
de 1982 a 2004-5, Pelotas, RS. Rev Saude Publica.
2008;42(Supl 2):7-15.
3. Chor D, Faerstein E, Kaplan GA, Lynch JW, Lopes CS. Association of weight change with ethnicity and life course socioeconomic position among Brazilian civil
servants. Int J Epidemiol. 2004;33(1):100-6. DOI:
10.1093/ije/dyg277
4. Cossrow N, Falkner B. Race/ethnic issues in obesity and
obesity-related comorbidities. J Clin Endocrinol Metab.
2004;89(6):2590-4. DOI: 10.1210/jc.2004-0339
5. Gibson R. Principles of nutritional assessment. 2 ed. New York: Oxford University Press; 2005.
6. Gigante DP, Barros FC, Post CL, Olinto MT. Prevalência de obesidade em adultos e seus fatores
de risco. Rev Saude Publica. 1997;31(3):236-46. DOI:
10.1590/S0034-89101997000300004
7. Horta BL, Bahl R, Martines JC, Victora CG. Evidence on the long-term effects of breastfeeding- Systematic reviews and meta-analyses. Geneva: WHO; 2007
8. Lohman TG, Roche AF, Martorell R. Anthropometric standardization reference manual. Champaign: Human Kinetics; 1988.
9. McTigue KM, Garrett JM, Popkin BM. The natural history of the development of obesity in a cohort of
young U.S. adults between 1981 and 1998. Ann Intern
Med. 2002;136(12):857-64.
10. Monteiro CA, Moura EC, Conde WL, Popkin BM. Socioeconomic status and obesity in adult populations
of developing countries: a review. Bull World Health
Organ. 2004;82(12):940-6.
11. Monteiro PO, Victora CG, Barros FC, Monteiro LM. Birth size, early childhood growth, and adolescent
obesity in a Brazilian birth cohort. Int J Obes Relat
Metab Disord. 2003;27(10):1274-82. DOI: 10.1038/ sj.ijo.0802409
12. Peña M, Bacallao J, eds. La obesidad en la pobreza: un nuevo reto para la salud pública. Washington, DC: Organización Panamericana de la Salud 2000. (Publicación científi ca, 576).
13. Sayer AA, Syddall HE, Dennison EM, Gilbody HJ, Duggleby SL, Cooper C, et al. Birth weight, weight at 1 y of age, and body composition in older men: fi ndings
from the Hertfordshire Cohort Study. Am J Clin Nutr.
2004;80(1):199-203.
14. Sobal J, Stunkard AJ. Socioeconomic status
and obesity: a review of the literature. Psychol
Bull. 1989;105(2):260-75. DOI:
10.1037/0033-2909.105.2.260
15. Victora CG, Sibbritt D, Horta BL, Lima RC, Cole T, Wells J. Weight gain in childhood and body
composition at 18 years of age in Brazilian males. Acta
Paediatr. 2007;96(2):296-300. DOI: 10.1111/j.1651-2227.2007.00110.x
16. Victora CG, Adair L, Fall C, Hallal PC, Martorell R, Richter L, et al. Maternal and child undernutrition: consequences for adult health and human capital.
Lancet. 2008;371(9609):340-57.
17. Victora CG, Barros F, Lima RC, Horta BL, Wells J. Anthropometry and body composition of 18 year old men according to duration of breast feeding: birth
cohort study from Brazil. BMJ. 2003;327(7420):901.
DOI: 10.1136/bmj.327.7420.901
18. Victora CG, Barros FC. Cohort profi le: the 1982 Pelotas (Brazil) birth cohort study. Int J Epidemiol. 2006;35(2):237-42. DOI: 10.1093/ije/dyi290
19. Victora CG, Barros FC, Lima RC, Behague DP, Gonçalves H, Horta BL, et al. Estudo de coorte de nascimentos em Pelotas, Rio Grande do Sul, Brasil,
1982-2001. Cad Saude Publica. 2003;19(5):1241-56.
DOI: 10.1590/S0102-311X2003000500003
20. Wells JC, Hallal PC, Wright A, Singhal A, Victora CG. Fetal, infant and childhood growth: relationships with
body composition in Brazilian boys aged 9 years. Int
J Obes (Lond). 2005;29(10):1192-8. DOI: 10.1038/ sj.ijo.0803054
21. World Health Organization. Physical status: the use and interpretation of anthropometry. Geneva; 1995.
REFERENCES
This article is based on data from the study “Pelotas birth cohort, 1982” conducted by Postgraduate Program in Epidemiology at Universidade Federal de Pelotas.
The 1982 birth cohort study is currently supported by the Wellcome Trust initiative entitled Major Awards for Latin America on Health Consequences of Population Change. Previous phases of the study were supported by the International Development Research Center, The World Health Organization, Overseas Development Administration, European Union, National Support Program for Centers of Excellence (PRONEX), the Brazilian National Research Council (CNPq) and Brazilian Ministry of Health.
This article underwent the same peer review process as for other manuscripts submitted to this journal. Both authors and reviewers are guaranteed anonymity. Editors and reviewers declare that there are no confl icts of interest that could affect their judgment with respect to this article.