Impact of predictors upon the reduction of lipid
parameters in family medicine practice
Impacto de preditores da redução dos parâmetros de lipídios na prática da
medicina de família
Yusuf Cetin Doganer
I, Kurt Angstman
II, James Rohrer
III,
Stephen Merry
IVDepartment of Family Medicine, Mayo Clinic, Rochester, MN, USA
ABSTRACT
CONTEXT AND OBJECTIVE: To evaluate predictors of changes in lipid parameters consisting of LDL-C (low-density lipoprotein cholesterol), TC (total cholesterol) and non-HDL-C (non-high density lipoprotein cholesterol) among primary care patients.
DESIGN AND SETTING: Retrospective study conducted on family medicine patients.
METHODS: Demographic features and other clinically relevant information were abstracted from medical records. The primary outcome was the diference in LDL-C level from initial testing to the index test. Sec-ondary outcomes were the changes in TC and non-HDL-C levels between two measurements.
RESULTS: Three hundred and eleven participants were included in the inal secondary analysis. Multiple linear regression revealed that male patients (β = 4.97, P = 0.040), diabetes (β = 9.75, P = 0.003) and higher LDL-C levels at baseline (β = 0.35, P < 0.001) were positively associated with LDL variance, whereas longer time period (β = -0.15, P = 0.045) and familial hypercholesterolemia history (β = -7.56, P = 0.033) were negatively associated. Male patients (β = 8.45, P = 0.002), DM (β = 9.26, P = 0.011), higher TC levels at base-line (β = 0.35, P < 0.001) and taking statins (β = 7.31, P = 0.023) were positively associated with TC variance, whilst longer time period (β = -0.183, P = 0.031) and familial hypercholesterolemia (β = -10.70, P = 0.008) were negatively associated.
CONCLUSION: In the present study, patients who were male, on statin treatment, diagnosed with diabetes and had higher baseline lipid values were more likely associated with better lipid outcomes at future testing.
RESUMO
CONTEXTO E OBJETIVO: Avaliar preditores de alterações nos parâmetros lipídicos que consistem em LDL-C (colesterol de lipoproteína de baixa densidade), TC (colesterol total) e não HDL-C (não colesterol de lipoproteína de alta densidade) entre os pacientes de cuidados primários.
TIPO DE ESTUDO E LOCAL: Estudo retrospectivo realizado em pacientes de medicina familiar.
MÉTODOS: Aspectos demográicos e outras informações clinicamente relevantes foram extraídos dos prontuários médicos. O desfecho primário foi a diferença de nível de LDL-C entre os exames iniciais e o exame índice. Os desfechos secundários foram as mudanças dos níveis de TC e não HDL-C entre as duas medidas.
RESULTADOS: Trezentos e onze participantes foram incluídos na análise secundária inal. Regressão lin-ear múltipla revelou que os pacientes do sexo masculino (β = 4,97, P = 0,040), diabetes (DM) (β = 9,75, P = 0,003) e níveis de LDL mais elevados no início do estudo (β = 0,35, P < 0,001) foram associados positi-vamente com variância LDL, enquanto longo período de tempo (β = -0,15, P = 0,045) e história hipercoles-terolemia familiar (β = -7,56, P = 0,033) foram associados negativamente. Pacientes do sexo masculino (β = 8,45, P = 0,002), com DM (β = 9,26, P = 0,011), níveis elevados de CT na linha de base (β = 0,35, P < 0,001) e tomar estatinas (β = 7,31, P = 0,023) associaram-se positivamente com a variância TC, en-quanto longo período de tempo (β = -0,183, P = 0,031), hipercolesterolemia familiar (β = -10,70, P = 0,008) foram associados negativamente.
CONCLUSÕES: No presente estudo, os pacientes que eram do sexo masculino, em tratamento com es-tatinas, com diagnóstico de DM e que tinham valores lipídicos basais mais elevados foram mais provavel-mente associados a melhores resultados de lipídios em testes futuros.
I MD. Research Fellow, Department of Family
Medicine, Mayo Clinic, Rochester, MN, USA
IIMD. Associate Professor, Department of Family
Medicine, Mayo Clinic, Rochester, MN, USA.
IIIPhD. Professor, Department of Family Medicine,
Mayo Clinic, Rochester, MN, USA.
IVMD, MPH. Assistant Professor, Department of
Family Medicine, Mayo Clinic, Rochester, MN, USA.
KEY WORDS:
Dyslipidemias. Cholesterol, LDL.
Hydroxymethylglutaryl-CoA reductase inhibitors.
Lipids. Family practice.
PALAVRAS-CHAVE:
Dislipidemias. LDL-Colesterol.
Inibidores de hidroximetilglutaril-CoA redutases. Lipídeos.
INTRODUCTION
Cardiovascular diseases (CVDs) are the largest cause of mortality and give rise to a substantial burden of health disparities in both developing and developed countries.1 Prevention and management
of CVDs continue to be a major public health issue worldwide, with well-known risk factors.2 Patient outcomes may be improved if
fac-tors such as dyslipidemia, smoking or a sedentary lifestyle are con-trolled through comprehensive healthcare management. hese approaches have been shown to have a positive impact through decreasing the mortality and morbidity rates linked with CVDs.3
Speciically, lipid-lowering therapies decelerate progression of ath-erosclerosis while decreasing recurrent cardiac events, as do a com-bination of intensive lifestyle and pharmacological interventions.4
he CVD prevention guidelines developed by the National Cholesterol Education Program expert panel (ATP III),5 which were
updated in 2004,6 and the European Society of Cardiology (ESC)
guidelines are primary resources for recommendations for lipid man-agement in clinical practice.7 More recently, the American College
of Cardiology/American Heart Association (ACC/AHA) task force published new recommendations, almost abandoning speciic LDL targets.8 he recommendations of the ACC/AHA guidelines were
extended to include all atherosclerotic CVDs (ASCVD), such as CHD and stroke, by calculating a risk assessment tool, speciically named the Pooled Cohort equations.9,10 One consequence of this new US
guideline is a lower risk assessment score for starting statin therapy, particularly for patients with no current cardiovascular symptoms.
Using the recommendations of the ACC/AHA guidelines as a basis for this study, LDL reduction was identiied as a continuous outcome measurement instead of using dichotomous target out-comes for achievement. To our knowledge, few studies have inves-tigated the association between patients’ characteristics and vari-ance of lipid parameters from baseline to the next measurement, as continuous variables in a randomized sample.
OBJECTIVE
We hypothesized that demographics (age, gender and smoking status) and possible clinical predictors such as body mass index (BMI) categories, familial hypercholesterolemia history, familial premature coronary heart disease (CHD), statin usage, comorbidities, interval periods between measurements, baseline low-density lipoprotein cholesterol (LDL-C), total cholesterol (TC) and non-high density lipoprotein cholesterol (non-HDL-C values), among primary care patients, would be associated with improvement of LDL-C, TC and non-HDL-C.
METHODS
Study sample and data
he present study was a secondary data analysis conducted on ran-domly selected adult primary care patients at a single multicenter
outpatient practice in Rochester, Minnesota, USA. he lipid param-eters of a random sample of patients for whom testing was ordered between March and September 2012 were electronically extracted (n = 400). he electronic medical records (EMRs) were retrospec-tively reviewed for baseline lipid results and dates, and the patients (n = 89; 22.3%) without prior lipid testing more than six years ear-lier were excluded from the study. he variables extracted included demographic characteristics (age, gender and smoking status) and clinical characteristics (BMI categories, familial hypercholesterol-emia history, familial premature CHD, statin usage, comorbidities, interval periods between measurements, baseline LDL-C, TC and non-HDL-C values). Of the initial 400 patients, 311 (77.8%) were included in the inal study cohort. he present study was reviewed and approved by our institutional review board.
Outcome measurements
he primary outcome was the diference in the LDL level from baseline to the follow-up measurement. Secondary outcomes were changes in total cholesterol and non-HDL-C levels from base-line to the follow-up measurement. Follow-up serum lipid levels were subtracted from baseline lipid levels to detect a diference in lipid parameters. he time until the follow-up was based on the electronic medical records (EMRs) and was variable from patient to patient. Independent variables that were controlled for in the multiple linear regression model included age, gender, body mass index (BMI), smoking status, baseline lipid parameters (LDL-C, HDL-C, total cholesterol), statin usage and comorbid CVDs.
Predictor variables
he personal characteristics and clinical features studied included age, gender (male versus female), BMI strata (< 30 kg/m2 versus
≥ 30 kg/m2), smoking status (current smoker versus former and
non-smoker), time period passed between the two screenings (in months), use of a statin treatment (yes/no) and presence of any of the following diseases: hypertension, diabetes and CHD (include carotid artery disease, peripheral artery disease and past history of abdominal aortic aneurysm). Hypertension was described as: 1) use of hypertension medication; or 2) systolic blood pressure > 140 mmHg or diastolic blood pressure > 90 mmHg.11 Diabetes
was deined as: 1) use of diabetes medication; or 2) fasting blood glucose greater than 126 mg/dl.12 Patients were accepted as either
having or not having a diagnosis of CHD, according to their EMR documentation. Data on predictor variables were gathered just ater the last lipid measurements, from the EMRs of patients admitted to family medical centers.
Statistical analysis
Paired sample tests were performed to ascertain the relation-ship between baseline and follow-up diferences in lipid parame-ters. he Kolmogorov-Smirnov test and visual inspection of Q-Q plots were used to determine whether the data presented nor-mal distribution. Univariate associations were analyzed using the Spearman correlation. he Wilcoxon test was used to make comparisons on data that were not normally distributed. he Spearman correlation was used where indicated. Multiple linear regression analysis was used to examine the efects of predictors on lipid parameter change. P-values less than 0.05 were consid-ered signiicant.
RESULTS
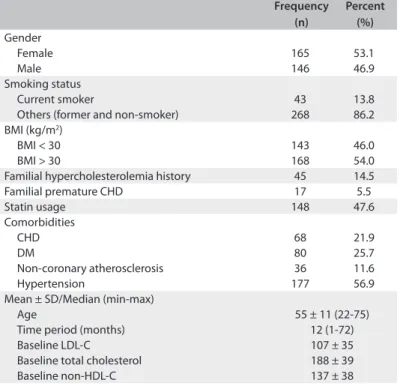
In our cohort of 311 adult primary care patients, the mean age was 55.3 ± 11.8 years (range: 22-75), and 53.1% were female. Almost half of the patients (54%) were obese, with a BMI of ≥ 30 kg/m2, and only 13.8% of the patients were smoking
cur-rently. he most frequent morbities were CHD (21.9%), diabetes (25.7%), hypertension (56.9) and non-coronary atherosclerosis (11.6%). he median length of time between the two measure-ments was 12 (1-72) months. he median length of follow-up was 12 months (range: 1-72), while the mean length of time between the two measurements was 17.64 ± 16.88 months. Almost half of the individuals (47.6%) were under treatment with a lipid-lower-ing agent. Other characteristics of the patients and mean choles-terol values at baseline are presented in Table 1.
he mean lipid parameter values for LDL-C, TC and non-HDL-C at baseline were 107.8 ± 35.1 mg/dl, 188.2 ± 39.5 mg/dl and 137.2 ± 38.7 mg/dl, respectively. In addition, the mean values for LDL-C, TC and non-HDL-C at follow-up monitoring were 103.8 ± 33.2 mg/dl, 186.0 ± 37.8 mg/dl and 134.0 ± 36.6 mg/dl, respectively (P = 0.017, P = 0.246 and P = 0.097) (Figure 1). he change in LDL-C was highly correlated with TC and non-HDL-C alteration, regarding the metabolic ailiation to each other (r = 0.886, P < 0.001; r = 0.855, P < 0.001) (Table 2).
Multiple linear regression analysis on lipid parameter differences between baseline and follow-up measurements revealed a significant portion of the variance (LDL: adjusted R square = 0.250; analysis of variance, ANOVA, P < 0.001; TC: adjusted R square = 0.252; ANOVA P < 0.001; non-HDL-C: 0.237; ANOVA P < 0.001). Male patients (β = 4.97, P = 0.040), diabetes (β = 9.75, P = 0.003) and higher LDL levels at base-line (β = 0.35, P < 0.001) were positively associated with LDL variance, whereas longer time period (β = -0.15, P = 0.045) and familial hypercholesterolemia (β = -7.56, P = 0.033) were negatively associated. In other words, the changes seen at fol-low-up were the following: male patients, 4.9 points; patients with diagnosed diabetes, 9.7 points; and patients with higher baseline LDL-C values, 0.3 points. These patients achieved greatest improvement in LDL-C difference. Other demo-graphic and clinical features were not significantly associated with LDL-C reduction (Table 3). Male patients (β = 8.45, P = 0.002), DM (β = 9.26, P = 0.011), higher TC levels at baseline (β = 0.35, P < 0.001) and taking statins (β = 7.31, P = 0.023) were positively associated with TC variance, whilst longer time period (β = -0.183, P = 0.031) and familial hypercholes-terolemia (β = -10.70, P = 0.008) were negatively associated (Table 4). The predictors associated with non-HDL-C changes are shown in Table 5.
BMI = body mass index; CHD = coronary heart disease; DM = diabetes mellitus; LDL-C = low-density lipoprotein cholesterol; non-HDL-C = non-high density lipoprotein cholesterol.
Frequency (n)
Percent (%)
Gender
Female 165 53.1
Male 146 46.9
Smoking status
Current smoker 43 13.8 Others (former and non-smoker) 268 86.2 BMI (kg/m2)
BMI < 30 143 46.0 BMI > 30 168 54.0 Familial hypercholesterolemia history 45 14.5 Familial premature CHD 17 5.5 Statin usage 148 47.6 Comorbidities
CHD 68 21.9
DM 80 25.7
Non-coronary atherosclerosis 36 11.6 Hypertension 177 56.9 Mean ± SD/Median (min-max)
Age 55 ± 11 (22-75) Time period (months) 12 (1-72) Baseline LDL-C 107 ± 35 Baseline total cholesterol 188 ± 39 Baseline non-HDL-C 137 ± 38
Table 1. Descriptive statistics (n = 311)
LDL
mg/dl
Follow-up Baseline 20
0 40 60 80 100 120 140 160 180 200
186.03 188.16
134 137.22 103.78 P = 0.017
107.77
TC
non-HDL P = 0.097
P = 0.0246
Figure 1. Reduction of overall lipid parameters from baseline to follow-up measurement (n = 311)*.
LDL-C change (mg/dl) TC change (mg/dl) non-HDL-C change (mg/dl)
r P r P r P
Gender 0.097 0.087 0.106 0.061 0.078 0.169 Age -0.098 0.084 -0.075 0.188 -0.087 0.128 Time duration (months) -0.171 0.002 -0.236 < 0.001 -0.220 < 0.001
Smoking status 0.077 0.177 0.071 0.215 0.062 0.276 BMI groups -0.029 0.610 0.028 0.626 -0.005 0.931 CHD -0.047 0.408 -0.034 0.555 -0.038 0.509 Diabetes 0.052 0.358 0.090 0.115 0.075 0.189 Non-coronary atherosclerosis 0.069 0.222 0.019 0.739 0.005 0.924 Hypertension -0.021 0.712 -0.004 0.943 -0.028 0.621 Familial hypercholesterolemia history -0.050 0.377 -0.064 0.259 -0.065 0.251 Statin usage -0.012 0.829 0.045 0.425 0.054 0.343 Baseline LDL-C (TC/non-HDL-C) 0.346 < 0.001 0.358 < 0.001 0.337 < 0.001
Table 2. Spearman correlation (r) between changes of lipid parameters and descriptive characteristics (n = 311)
BMI = body mass index; CHD = coronary heart disease; DM = diabetes mellitus; LDL-C = low-density lipoprotein cholesterol; TC = total cholesterol; non-HDL-C = non-high density lipoprotein cholesterol.
Table 3. Multivariate linear regression analysis on predictors associated with the LDL-C change (n = 311)*
*R square = 0.279; adjusted R square = 0.250; ANOVA P value < 0.001. BMI = body mass index; CHD = coronary heart disease; DM = diabetes mellitus; LDL-C = low-density lipoprotein cholesterol.
Unstandardized
coeicients P 95% CI
B SE Lower Upper
Gender
(female versus male) 4.977 2.411 0.040 0.233 9.721 Age -0.120 0.113 0.291 -0.343 0.103 Time duration (months) -0.150 0.075 0.045 -0.297 -0.003 Smoking status 4.119 3.498 0.240 -2.765 11.002 CHD 0.569 3.274 0.862 -5.873 7.012 DM 9.758 3.220 0.003 3.422 16.093 Non-coronary
atherosclerosis 5.947 4.092 0.147 -2.105 13.999 Hypertension -0.514 2.826 0.856 -6.075 5.047 Familial
hypercholesterolemia history
-7.560 3.532 0.033 -14.511 -0.610 Baseline LDL-C 0.355 0.037 0.000 0.281 0.428 Taking statins 4.837 2.851 0.091 -0.773 10.448 BMI class (≥ 30 versus < 30) -2.927 2.529 0.248 -7.903 2.049
Unstandardized
coeicients P 95% CI
B SE Lower Upper
Gender (female versus male) 8.459 2.742 0.002 3.063 13.854 Age -0.150 0.128 0.243 -0.401 0.102 Time duration (months) -0.183 0.085 0.031 -0.350 -0.016 Smoking status 4.031 3.956 0.309 -3.755 11.817 CHD 0.656 3.710 0.860 -6.646 7.958 DM 9.261 3.620 0.011 2.138 16.385 Non-coronary atherosclerosis 3.903 4.627 0.400 -5.204 13.009 Hypertension -0.794 3.197 0.804 -7.086 5.497 Familial
hypercholesterolemia history
-10.700 3.999 0.008 -18.569 -2.831 Baseline total cholesterol 0.353 0.037 0.000 0.280 0.426 Taking statins 7.315 3.212 0.023 0.994 13.635 BMI class (≥ 30 versus < 30) -1.103 2.859 0.700 -6.730 4.525
*R square = 0.281; adjusted R square = 0.252; ANOVA P value < 0.001. BMI = body mass index; CHD = coronary heart disease; DM = diabetes mellitus.
Table 4. Multivariate linear regression analysis on predictors associated with the total cholesterol change (n = 311)*
Unstandardized
coeicients P 95% CI
B SE Lower Upper
Gender (female versus
male) 3.767 2.702 0.164 -1.550 9.083 Age -0.134 0.127 0.292 -0.383 0.116 Time period (months) -0.162 0.084 0.054 -0.326 0.003 Smoking status 3.770 3.917 0.337 -3.939 11.479 CHD 0.089 3.666 0.981 -7.126 7.303 DM 8.392 3.572 0.019 1.361 15.422 Non-coronary
atherosclerosis 5.093 4.582 0.267 -3.925 14.111 Hypertension -1.927 3.161 0.543 -8.148 4.294 Familial
hypercholesterol-emia history -8.460 3.948 0.033 -16.228 -0.691 Baseline non-HDL-C 7.805 3.180 0.000 0.266 0.411 Taking statins 7.805 3.180 0.015 1.547 14.062 BMI class (≥ 30 versus < 30) -4.519 2.843 0.113 -10.114 1.075
Table 5. Multivariate linear regression analysis on predictors associated with the non-HDL-C change (n = 311)*
*R square = 0.267; adjusted R square = 0.237; ANOVA P value < 0.001. BMI = body mass index; CHD = coronary heart disease; DM = diabetes mellitus; non-HDL-C (non-high density lipoprotein cholesterol).
DISCUSSION
the Cholesterol Treatment Trialists’ (CTT)14 meta-analysis
estab-lished that 1 mmol/l of LDL-C reduction was signiicantly asso-ciated with a 20% improvement in clinical cardiovascular events. hus, the patient characteristics that predict improvement in cholesterol biomarkers could be important determinants. Since we were only able to ind a limited number of similar studies with which to compare the indings of our present study, we had to make comparisons with previous studies focusing on whether lipid targets had been achieved.
Previous studies mostly focused on particular target con-trol levels of lipid parameters set by diferent lipid guidelines for patients. hese target levels may have been achieved through treatments with diferent types and dosages of statins.15 Contrary
to these randomized, controlled clinical trials, the ACC/AHA recently declared that there would be no recommendations for speciic LDL-C or non-HDL-C targets for primary and secondary prevention of atherosclerotic cardiovascular disease (ASCVD).8
Taking this point of view in our study, we used the method of cal-culating the reduction in lipid parameters as a continuous out-come, while previous similar studies used a binomial outcome of whether lipid parameter goals were achieved.
In an Asian study, goal attainment was determined to be directly associated with age and inversely related to baseline LDL-C.16 Before the new US guideline was issued, Kazerooni et
al. stated that most of the observational studies conducted on LDL goal attainment disregarded classifying patients accord-ing to baseline LDL-C, in order to reduce heterogeneity in their baseline study samples. hey suggested that LDL-C reduction from baseline levels should be used as an alternative method for evaluating improvement, instead of using LDL-C goals.17
Patients with higher LDL-C at baseline may have a relative advantage in achieving a larger change in LDL-C values, in rela-tion to patients with lower initial LDL-C. In addirela-tion, physi-cians should consider selecting the initial drug and dose inten-sity of treatment based on the patients’ baseline LDL-C levels, as well as on ASCVD risk assessments.
Dyslipidemia is very closely linked with insulin resis-tance, thus causing glycemic disorders. Based on this pathophysiological pathway, effective management of dys-lipidemia plays a key role in preventing CVD, which is a crucial comorbidity in patients with DM.18 The current
guidelines broaden the spectrum of statin usage, which is mainly indicated in patients with DM aged 40 to 75 years of age, as moderate-intensity statin usage to provide a decrease of 30% to 49% in LDL-C.8 Contradictory findings
were determined in subgroup analyses on randomized con-trol trials (RCTs) regarding cardiovascular risk reduction through statin therapy for diabetic patients, compared with all patients.18 In the LIPID study,19 the relative risk
reduc-tion was 24% in all patients and 19% in patients with DM,
whereas 51% of all patients and 58% of diabetic patients had relative risk reduction in the GREACE study.20 In the
present study, patients with DM displayed better improve-ment over time than patients without DM. This could potentially be due to enhanced therapeutic goals among diabetic patients, enhanced monitoring of diabetic patients and enhanced care treatment with care management, or a combination of factors.
The multicenter, multinational PROVE IT-TIMI 22 trial reported that both women and men profited from intensive statin therapy after acute coronary syndrome (ACS). The analysis on that study concluded that gender difference could not be a plausible reason in determining whether to imple-ment intensive statin therapy.21 However, Victor et al. stated
in their retrospective study that women with documented CHD were less likely to attain LDL-C and non-HDL-C goals.22
Confirming this finding, Rapeport et al. indicated that female patients were less likely to attain LDL-C goals than men, based on both the NCEP ATP III guidelines and the fourth Joint European Task Force (JETF) guidelines.23 We also found
gender differences regarding LDL-C and TC variance. We detected that men made more progress than women regard-ing differences in LDL-C and TC. One possible explanation for our finding may be that women may have been less aggres-sively treated with lipid-lowering therapy, compared with men. Secondly, gender difference in lipid metabolism might lead to this type of variance.
Patients who were under statin treatment achieved greater improvement in TC and non-HDL-C. Statins not only lower LDL-C, but are also efective for TC and non-HDL-C, despite discrepancies regarding which marker is best for predicting pos-sible CV events.24,25 Although statin usage was not signiicantly
associated with LDL-C variance in our sample population, TC and non-HDL-C improvement was noted. In addition, patients with high value as the start are likely to have decreased values at the retest, while patients with low values at baseline are likely to have increased values at the retest. his is due to some random variation in test scores. Extreme values may be due to chance rather than the actual disease.
Familial hypercholesterolemia (FH) is a common, but underdiagnosed and undertreated genetic cause of cardiovas-cular events, and it is linked with permanent elevated plasma LDL-C levels.26 However, once a heterozygote form of FH is
diagnosed, it can be treated with statins or combined lipid-lowering therapies.27 According to our study findings, patients
Limitation of the study
he present study has several limitations. We accept that our loss of information from 23% of the sample regarding the main out-come (lipid tests) was very high, and that this formed the sig-niicant weakness of the study. We assessed 311 patients because this was the number of participants available who fulilled the requirements for secondary analysis using EMRs.
he indings from this study possibly cannot be general-ized to other patient groups given that the sample was randomly selected from one multi-site primary care practice group. We could not thoroughly observe the statin treatments regarding treatment options, durations, dosages or adherence. We were not able to ascertain when treatment for hyperlipidemia was started, and only noted when patients had follow-up data. In addition, we could not assess whether any therapeutic life-changing interven-tions occurred between two measurement dates in the electronic medical records.
CONCLUSION
In the present study, patients who were male, were on statin treat-ment, presented type 2 DM and presented higher baseline lipid values were more likely to have better lipid outcomes at future testing. Longer durations between screenings and having a famil-ial hypercholesterolemia history were less likely to be associated with achieving better lipid outcomes. here was no association between LDL-C change and statin usage in this retrospectively studied group, since some of the patients were being re-measured ater stopping their statin treatment, some ater starting statins, and some while on a maintenance dose of statins between the two lipid measurement points. Statin usage alone could not explain the diferences in lipid parameters, and predictors afecting these vari-ances require further studies with larger samples.
REFERENCES
1. Go AS, Mozafarian D, Roger VL, et al. Heart disease and stroke
statistics--2013 update: a report from the American Heart Association.
Circulation. 2013;127(1):e6-e245.
2. Yusuf S, Hawken S, Ounpuu S, et al. Efect of potentially modiiable
risk factors associated with myocardial infarction in 52 countries (the
INTERHEART study): case-control study. Lancet. 2004;364(9438):937-52.
3. Graham I, Atar D, Borch-Johnsen K, et al. European guidelines on
cardiovascular disease prevention in clinical practice: full text. Fourth
Joint Task Force of the European Society of Cardiology and other
societies on cardiovascular disease prevention in clinical practice
(constituted by representatives of nine societies and by invited
experts). Eur J Cardiovasc Prev Rehabil. 2007;14 Suppl 2:S1-113.
4. Nissen SE, Nicholls SJ, Sipahi I, et al. Efect of very high-intensity statin
therapy on regression of coronary atherosclerosis: the ASTEROID trial.
JAMA. 2006;295(13):1556-65.
5. Expert Panel on Detection, Evaluation and Treatment of High Blood
Cholesterol in Adults. Executive Summary of The Third Report of The
National Cholesterol Education Program (NCEP) Expert Panel on
Detection, Evaluation, And Treatment of High Blood Cholesterol In
Adults (Adult Treatment Panel III). JAMA. 2001;285(19):2486-97.
6. Grundy SM, Cleeman JI, Merz CN, et al. Implications of recent clinical
trials for the National Cholesterol Education Program Adult Treatment
Panel III guidelines. Circulation. 2004;110(2):227-39.
7. European Association for Cardiovascular Prevention & Rehabilitation,
Reiner Z, Catapano AL, et al. ESC/EAS Guidelines for the management of
dyslipidaemias: the Task Force for the management of dyslipidaemias
of the European Society of Cardiology (ESC) and the European
Atherosclerosis Society (EAS). Eur Heart J. 2011;32(14):1769-818.
8. Stone NJ, Robinson JG, Lichtenstein AH, et al. 2013 ACC/AHA
guideline on the treatment of blood cholesterol to reduce
atherosclerotic cardiovascular risk in adults: a report of the American
College of Cardiology/American Heart Association Task Force on
Practice Guidelines. Circulation. 2014;129(25 Suppl 2):S1-45.
9. Gof DC Jr, Lloyd-Jones DM, Bennett G, et al. 2013 ACC/AHA guideline
on the assessment of cardiovascular risk: a report of the American
College of Cardiology/American Heart Association Task Force on
Practice Guidelines. Circulation. 2014;129(25 Suppl 2):S49-73.
10. Kavousi M, Leening MJ, Nanchen D, et al. Comparison of
application of the ACC/AHA guidelines, Adult Treatment Panel
III guidelines, and European Society of Cardiology guidelines for
cardiovascular disease prevention in a European cohort. JAMA.
2014;311(14):1416-23.
11. James PA, Oparil S, Carter BL, et al. 2014 evidence-based guideline for
the management of high blood pressure in adults: report from the
panel members appointed to the Eighth Joint National Committee
(JNC 8). JAMA. 2014;311(5):507-20.
12. American Diabetes Association. Standards of medical care in
diabetes--2014. Diabetes Care. 2014;37 Suppl 1:S14-80.
13. Heart Protection Study Collaborative Group. MRC/BHF Heart
Protection Study of cholesterol lowering with simvastatin in 20,536
high-risk individuals: a randomised placebo-controlled trial. Lancet.
2002;360(9326):7-22.
14. Cholesterol Treatment Trialists’ (CTT) Collaboration, Baigent C,
Blackwell L, et al. Eicacy and safety of more intensive lowering of
LDL cholesterol: a meta-analysis of data from 170,000 participants in
26 randomised trials. Lancet. 2010;376(9753):1670-81.
15. Yamazaki T, Kurabayashi M; ASTRO-1 Study Group. A Randomized
Controlled Study to Compare the Effects of Rosuvastatin 5 mg
and Atorvastatin 10 mg on the Plasma Lipid Profile in Japanese
Patients with Hypercholesterolemia (ASTRO-2). Ann Vasc Dis.
2009;2(3):159-73.
16. Park JE, Chiang CE, Munawar M, et al. Lipid-lowering treatment in
hypercholesterolaemic patients: the CEPHEUS Pan-Asian survey. Eur
17. Kazerooni R, Watanabe JH, Bounthavong M. Association between
statin adherence and cholesterol level reduction from baseline in a
veteran population. Pharmacotherapy. 2013;33(10):1044-52.
18. Betteridge DJ. Lipid control in patients with diabetes mellitus. Nat
Rev Cardiol. 2011;8(5):278-90.
19. Keech A, Colquhoun D, Best J, et al. Secondary prevention of
cardiovascular events with long-term pravastatin in patients with
diabetes or impaired fasting glucose: results from the LIPID trial.
Diabetes Care. 2003;26(10):2713-21.
20. Athyros VG, Papageorgiou AA, Mercouris BR, et al. Treatment with
atorvastatin to the National Cholesterol Educational Program goal
versus ‘usual’ care in secondary coronary heart disease prevention.
The GREek Atorvastatin and Coronary-heart-disease Evaluation
(GREACE) study. Curr Med Res Opin. 2002;18(4):220-8.
21. Truong QA, Murphy SA, McCabe CH, et al. Beneit of intensive statin
therapy in women: results from PROVE IT-TIMI 22. Circ Cardiovasc
Qual Outcomes. 2011;4(3):328-36.
22. Victor BM, Teal V, Ahedor L, Karalis DG. Gender diferences in
achieving optimal lipid goals in patients with coronary artery disease.
Am J Cardiol. 2014;113(10):1611-5.
23. Rapeport N, Schamroth CL, Blom DJ. Gender and ethnic diferences
in the control of hyperlipidaemia and other vascular risk factors:
insights from the CEntralised Pan-South African survey on tHE
Under-treatment of hypercholeSterolaemia (CEPHEUS SA) study. Cardiovasc
J Afr. 2013;24(6):238-42.
24. Thanassoulis G, Williams K, Ye K, et al. Relations of change in plasma
levels of LDL-C, non-HDL-C and apoB with risk reduction from statin
therapy: a meta-analysis of randomized trials. J Am Heart Assoc.
2014;3(2):e000759.
25. Puri R, Nissen SE, Shao M, et al. Impact of baseline lipoprotein and
C-reactive protein levels on coronary atheroma regression following
high-intensity statin therapy. Am J Cardiol. 2014;114(10):1465-72.
26. Nordestgaard BG, Chapman MJ, Humphries SE, et al. Familial
hypercholesterolaemia is underdiagnosed and undertreated in the
general population: guidance for clinicians to prevent coronary
heart disease: consensus statement of the European Atherosclerosis
Society. Eur Heart J. 2013;34(45):3478-90a.
27. Versmissen J, Oosterveer DM, Yazdanpanah M, et al. Eicacy of statins
in familial hypercholesterolaemia: a long term cohort study. BMJ.
2008;337:a2423.
Acknowledgement: Julie Maxson, BA, and Nicole Callahan, CNP, provided support in relation to the study sample design and data-gathering
Sources of funding: None
Conlict of interest: None
Date of irst submission: November 21, 2014
Last updated: January 5, 2015
Accepted: January 15, 2015
Address for correspondence:
Yusuf C. Doganer
Department of Family Medicine, Mayo Clinic,
200 First St. Southwest, Rochester, MN, USA 55905
Cell. +1 507 319 0340