1 8 9
Arq Bras Oftalmol. 2013;76(3):189-91
Relato de Caso |
Case RepoRtINTRODUCTION
Choroidal osteoma is a rare benign tumor of the choroid. It was first described by Gass in 4 young females who had slightly elevated yellowish juxta-papillary lesions with well defined borders(1). It is
unilateral in 80% of the patients and mostly seen in the second and third decades. Fifty percent of patients with choroidal osteoma were reported to have decreased visual acuity to 20/200 or worse. Tumor growth, decalcification and choroidal neovascularization may lead to visual loss(2).
Choroidal osteomas show high reflectivity in B-scan ultrasonography because of the presence of calcium and demonstrate acous tic shadowing. Moreover, a hyper dense plaque is visible in the choroi -dal plane with computerized tomography (CT).
Optical coherence tomography (OCT) is widely used in the diag -nosis and follow-up of many retinal disorders. Technological deve-lopments in OCT have put into the use of spectral domain OCT (SD OCT). The image acquisition speed of SD OCT is 43 to 100 times faster than time-domain OCT and provides a clearer image of the retinal structures with a 5 nm resolution(3). Enhanced Depth Imaging OCT ABSTRACT
The authors present enhanced depth imaging optical coherence tomography (EDI OCT ) and fundus autofluorescence (FAF) characteristics of a patient with bilateral choroidal osteoma and try to make a correlation between two imaging techniques. Two eyes of a patient with choroidal osteoma underwent complete ophthalmic examination. Enhanced depth imaging optical coherence tomography revealed a cage-like pattern, which corresponded to the calcified region of the tumor. Fundus autofluorescence imaging of the same area showed slight hyperautofluorescen -ce. Three different reflectivity patterns in the decalcified area were defined. In the areas of subretinal fluid, outer segment elongations similar to central serous cho rioretinopathy were observed. Hyperautofluorescent spots were evident in fundus autofluorescence in the same area. Calcified and decalcified portions of choroidal osteoma as well as the atrophy of choriocapillaris demonstrated different patterns with enhanced depth imaging and fundus autofluorescence imaging. Both techniques were found to be beneficial in the diagnosis and follow-up of choroidal osteoma.
Keywords: Choroid neoplasms/diagnosis; Osteoma; Tomographpy, optical co -he rence; Fluorescein angiography; Image enhancement; Humans; Female; Adult; Case report
RESUMO
Os autores apresentam tomografia de coerência óptica com profundidade de ima-gem aprimorada (EDI OCT ) e autofluorescência de fundo (FAF) características de um paciente com osteoma de coroide bilateral e tentam correlacionar as duas técnicas de imagem. Dois olhos de um paciente com osteoma de coroide foram submetidos a exame oftalmológico completo. Tomografia de coerência óptica com profundidade de imagem aprimorada revelou padrão em gaiola, correspondente à região de calcificação do tumor. Imagens de autofluorescência de fundo da mesma área mostraram ligeira autofluorescência positiva. Três padrões de refletividade diferentes foram definidos na área descalcificada. Nas áreas com fluido sub-retiniano, foram observados prolonga-mentos dos segprolonga-mentos externos semelhantes aos da coroidorretinopatia serosa central. Manchas autofluorescentes positivas foram evidentes em autofluorescência de fundo na mesma área. Porções calcificadas e descalcificadas do osteoma de coroide, bem como a atrofia da camada coriocapilar, demonstraram diferentes padrões de tomo-grafia de coerência óptica com profundidade de imagem aprimorada e de imagens de autofluorescência de fundo. Ambas as técnicas se mostraram úteis no diagnóstico e acompanhamento de osteoma de coroide.
Descritores: Neoplasias da coroide/diagnóstico; Osteoma; Tomografia de coerência óptica; Angiofluoresceinografia; Aumento da imagem; Humanos; Feminino; Adulto; Relato de caso
(EDI OCT) is relatively a new enhancement enabling the visualization of the choroid and is now available in commercial SD OCT’s.
Fundus autofluorescence (FAF) imaging is also used for the diag-nosis of many retinal disorders. The main source of autofluorescence is the lipofuscin pigment which is the waste product of protein, fatty acids and retinoids that accumulates in lysosomes after the pha gocytosis of the damaged outer photoreceptor layer and shows func -tion of retinal pigment epithelium (RPE)(4).
We aim to represent the SD OCT and FAF findings of a patient with bilateral choroidal osteoma in this study.
CASE REPORT
A 28-year-old woman presented with visual loss in the right eye (RE), which was ongoing for 10 days. Her visual acuities were 20/400 in RE and 20/25 in the left. Intraocular pressures were 12 mmHg and 14 mmHg respectively. Anterior segment findings were unremarka-ble. Fundus examination revealed an orange central fovea (calcified area) surrounded temporally and nasally by a yellow-white region
Enhanced depth imaging optical coherence tomography and fundus autofluorescence
findings in bilateral choroidal osteoma: a case report
Tomograia de coerência óptica com profundidade de imagem aprimorada e resultados autoluorescência
de fundo em osteoma de coroide bilateral: relato de caso
MuhaMMet KaziM erol1, Deniz turgut Coban1, basaK bostanCi Ceran1, MehMet bulut1
Submitted for publication: April 8, 2013 Accepted for publication: May 29, 2013
Study carried out at Antalya Training and Research Hospital, Department of Ophthalmology. 1 Antalya Training and Research Hospital, Department of Ophthalmology, Antalya, Turkey.
Funding: No specific financial support was available for this study.
Disclosure of potential conflicts of interest: M.K.Erol, None; D.T.Corban, None; B.B.Ceran, None; M.Bulut, None.
Enhanced depth imaging optical coherence tomography and fundus autofluorescence findings in bilateral choroidal osteoma: a case report
1 9 0 Arq Bras Oftalmol. 2013;76(3):189-91
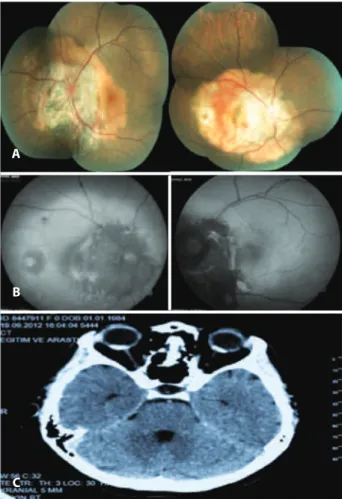
(decalcified area). Her LE fundoscopic exam showed the atrophic cho riocapillaris nasal to the disc, a decalcified area between the disc and the fovea, and a calcified area temporally (Figure 1A).
Cirrus HD OCT (Carl Zeiss, Dublin, CA) was used in EDI OCT mode to demonstrate the decalcified and calcified por tions of the retina. Fundus photos and FAF imaging was performed with Visucam NM-FA fundus camera (Carl Zeiss Meditec, Germany) in 45 degree mode with 510-580 nm light wavelength and 670-735 nm emission wavelength. Fundus auto fluorescence and OCT findings were overlapped with a photoshop program in order to see where exactly the findings in OCT correspond in FAF imaging.
We observed a cage-like reflective pattern with the EDI OCT, which corresponds to the calcified region of the choroidal osteoma (Figure 2A). In some regions, a hyper-reflective band was visible bet-ween the calcified tumor tissue and unaffected choroid (Figure 3). The retinal tissue covering the calcified areas seemed intact (Figure 2, 3). FAF imaging of the calcified areas showed slight hyperauto-fluorescence indicating the integrity of RPE (Figure 1B).
We described three different reflectivity patterns in the decal-cified area. First one was a thick hump-like hyper-reflective band, which had posterior acoustic shadowing and had a non-intact RPE overlying it (Choroidal neovascular membrane - CNVM) (Figure 2B). The outer retinal structures (RPE, IS-OS line and external limiting membrane) of the second pattern were disintegrated, the tumor plane was irregular and the vascular structures of the tumor were visible. In addition, the second pattern showed less acoustic sha-dowing compared to the first one. The third pattern was an irregular
hyper-reflective pattern partially beneath or over the RPE and Bruch membrane. In FAF imaging, decalcified areas were mostly hypoauto-fluorescent although showed hyperautofluorescence in some parts (Figure 1C).
Choroidal thickness was increased in the RE, which had choroidal neovascularization. In addition, intra and subretinal serous fluid was observed. Outer segment elongations similar to the ones in central serous chorioretinopathy (CSCR) were evident. Hyperautofluorescen-ce spots were evident in FAF imaging which correspond to the areas of serous fluid (Figure 1B).
DISCUSSION
In a previous histopathologic study, choroidal osteoma was de-monstrated to be a tumor between the choriocapillaris and choroid, where the spongious dense bone trabeculae surround bone marrow with loose connective tissue and vessels(5). In this case, using the EDI
OCT, we described a lattice-like reflective pattern that corresponds to the spongy bone in the choroid. Eduardo et al. have described a similar pattern in their study previously(6). The hyper-reflective line
be-tween the tumor and choroid in this study may be explained by the interface in-between or the choroidal melanocytes pushed towards the sclera by the tumor as described by Williams et al(5).
There have been earlier studies defining the calcified areas of choroidal osteoma as isoautofluorescent(6). In our case we have
ob-served slightly increased autofluorescence in calcified areas of both eyes. We believe that the excitation wavelength (510-580 nm) that we used in our study may excite the calcium and collagen tissue and cause autofluorescence.
Time domain OCT and tomodensitometry (TD) (TD OCT) may re veal retinal disorders in cross sectional analysis but is able to show only a trace amount of choroidal details. TD OCTs of 22 choroidal osteoma patients showed the relation between photoreceptor atrophy with tumor decalcification(7). SD OCT has many advantages
A
B
C
Figure 1. Fundus of RE and LE tumor vessels known as spiders are indicated with arrows. (A) Autoluorescence imaging of RE and LE: Hypoautoluorescence in the decalciied areas, slightly increased hyperautoluorescence in calciied regions in some parts. (B) CT of the orbit (C).
A
B
Erol MK, et al.
1 9 1
Arq Bras Oftalmol. 2013;76(3):189-91
Figure 3. Horizontal section beneath fovea, hyper-relective line between the tumor tissue and choroid (up arrow). Retinal structures are well preserved in the calciied area. White arrow on the left represents a vessel passing over the tumor surface.
over TD OCT in means of high scanning rate and resolution. We have observed a similar correlation between photoreceptor atrophy with tumor decalcification. Atrophy of the RPE, serous retinal detachment and defects in outer segment of photoreceptor layer were observed in the decalcified area. The yellow-white region in the tumor was de-fined as decalcification. The yellow-white color is probably due to the degeneration of the orange RPE with tumor decalcification(1). Based
on that, we may state that tumor decalcification is directly related to RPE atrophy. In addition, defects in Bruch membrane and RPE may contribute to CNVM formation and subsequently, serous retinal de-tachment. We defined CNVM as the hyper-reflective band between calcified and decalcified tumor, shadowing the structures beneath it. Optical coherence tomography shows total disintegration of RPE in the area of serous detachment and elongation of outer segments. The decalcified areas were hypofluorescent due to the disintegration RPE configuration and function. We believe that the hyperfluores-cence of focal points may be related to the remaining decalcified osteoma tissue, scleral collagen or metaplasia of the RPE. In addition, we also believe the granular hyperfluorescent area in the serous
de-tachment area is related to outer segment elongations as described by Matsumoto et al. in cases with CSCR(8). In this case we were first to
demonstrate the retinal vessels described by Gass et al. on the tumor surface beneath the retina with the EDI OCT(1).
As a conclusion, we believe that the case we are presenting is unique because of its bilaterality, and for featuring all the lesions that may be demonstrated in an osteoma such as the calcified, decalcified areas and atrophy of choriocapillaris. EDI OCT and FAF imaging were found to be beneficial in the diagnosis and follow up of choroidal osteomas. In addition, EDI OCT seems to be useful in showing the structure of osteomas in vivo. EDI OCT and FAF studies of a larger number of choroidal osteomas would provide further information about the etiopathogenesis of this disorder.
REFERENCES
1. Gass JD, Guerry RK, Jack RL, Harris G. Choroidal osteoma. Arch Ophthalmol. 1978; 96(3):428-35.
2. Shields CL, Sun H, Demirci H, Shields JA. Factors predictive of tumor growth, tumor decalcification, choroidal neovascularization, and visual outcome in 74 eyes with choroidal osteoma. Arch Ophthalmol. 2005;123(12):1658-66.
3. Wojtkowski M, Srinivasan V, Fujimoto JG, Ko T, Schuman JS, Kowalczyk A, et al. Three-di mensional retinal imaging with high-speed ultrahigh-resolution optical coherence tomography. Ophthalmology. 2005;112(10):1734-46.
4. Delori FC, Dorey CK, Staurenghi G, Arend O, Goger DG Weiter JJ. In vivo fluorescence of the ocular fundus exhibits retinal pigment epithelium lipofuscin characteristics. Invest Ophthalmol Vis Sci [Internet]. 1995[cited 2011 Apr 2];36(3):718-29. Available from: http://www.iovs.org/content/36/3/718.long
5. Williams AT, Font RL, Van Dyk HJ, Riekhof FT. Osseous choristoma of the choroid simu-lating a choroidal melanoma. Association with a positive 32P test. Arch Ophthalmol. 1978;96(10):1874 -7.
6. Navajas EV, Costa RA, Calucci D, Hammoudi DS, Simpson ER, Altomare F. Multimodal fundus imaging in choroidal osteoma. Am J Ophthalmol. 2012;153(5):890-5.e3. 7. Shields CL, Perez B, Materin MA, Mehta S, Shields JA. Optical co herence tomography
of choroidal osteoma in 22 cases: evidence for photoreceptor atrophy over the decalcified portion of the tumor. Oph thalmology. 2007;114(12):e53-8.