INTRODUCTION
Obstructive Sleep Apnea Syndrome (OSAS), which is the comple-te or partial obstruction of the upper airways recurrently during sleep, is fairly common, at rates of 3%-7% in the population(1,2). Resultant hy percapnia and re-oxygenation cause humoral and vascular chan-ges by modifying several blood parameters such as lowering of pH, increasing of nitric oxide (NO), and vasodilatation caused by hypoxia. Consequently, changes occur in the balance between vasodilatation and vasoconstriction in blood vessels. Additionally, hypercapnia cau-ses an increase in tonus by causing systemic autonomic dysfunction. Eventually, apnea and hypopnea contribute to the development ABSTRACT
Purpose: Evaluation of the nerve fiber thicknesses of the macula, choroid, and retina using the apnea-hypopnea index in individuals with obstructive sleep apnea syndrome (OSAS) without systemic components.
Methods: Prospective, controlled study. The central macular, choroidal, and retinal nerve iber layer (RNFL) thicknesses were evaluated using enhanced depth imaging-spectral domain optical coherence tomography in individuals with OSAS. In people with severe OSAS who had received treatment, posterior ocular structures were examined over 3 months (4th and 12th weeks), and changes were
evaluated. Only the right eyes of the participants were evaluated in the study.
Results: A total of 72 people were involved in the study, with 18 in the control group and 19 with mild, 16 with moderate, and 19 with severe OSAS. No signiicant difference was found among the groups in terms of demographic measures. No significant differences were found among the groups in terms of the measures of central macular, central subfoveal choroidal (CSCT), temporal choroidal, nasal choroidal, and RNFL thicknesses. In severe OSAS cases in which treatment was administered, although subjective clinical recovery was observed, statistically sig-nificant thinning was detected during the 3-month follow-up period in the CSCT, general RNFL, as well as in the inferior and superior nasal quadrants, and temporal superior quadrant (p=0.005, p=0.009, p=0.039, p=0.003, and p=0.02, respectively).
Conclusion: In the group with severe OSAS, thinning in some posterior ocular tissues was observed. Although patients with severe OSAS may experience clini-cal recovery, we recommend that they would be followed up in terms of ocular ischemic injury.
Keywords: Sleep apnea syndromes; Macula; Choroid; Tomography, optical co-herence; Nerve fibers; Retina
RESUMO
Objetivo: Avaliação de espessuras das fibras nervosas da mácula, coroide e da retina de acordo com os índices de apnéia e hipopnéia (AHI) em indivíduos com síndrome da apneia obstrutiva do sono (OSAS), sem componentes sistêmicos.
Métodos: Estudo prospectivo, controlado. As espessuras centrais maculares, da co roide e da camada de fibras nervosas da retina foram avaliadas tomografia de coerência óptica de domínio espectral de profundidade aprimorada em indivíduos com síndrome da apneia obstrutiva do sono. Em pessoas com OSAS grave a quem foi aplicado o tratamento, estruturas oculares posteriores foram examinados por três meses (4a e 12a semanas) e as alterações foram avaliadas. Apenas os olhos direitos dos participantes foram envolvidos no estudo.
Resultados: 72 pessoas foram envolvidas no estudo, 18 no grupo controle e, 19 com OSAS leve, 16 com OSAS moderada e 19 com OSAS grave. Não houve diferença signi-ficativa entre os grupos em relação às medidas demográficas. Não houve diferenças significativas estavam presentes entre os grupos em termos de medidas de espessura macular central (CMT ), espessura subfoveal central da coroide (CSCT ), espessura da coroide temporal (TCT ), espessura da coroide nasal (NCT ) e, a camada de fibras nervosas da retina (RNFL). Em casos de OSAS graves onde o tratamento foi aplicado, apesar de ter sido observada recuperação clínica subjetiva, detectou-se afinamento estatisticamente significativo durante os três meses de acompanhamento, em CSCT, RNFL geral, quadrantes nasais inferior e superior, e quadrante temporal superior (p=0,005, p=0,009, p=0,039, p=0,003, p=0,02).
Conclusão: No grupo com OSAS grave, foi observado afinamento em algumas áreas posteriores dos tecidos oculares. Embora os pacientes com OSAS grave possam apresentar recuperação clínica, recomendamos que eles sejam seguidos em termos de lesão isquêmica ocular.
Descritores: Síndromes da apneia do sono; Macula;Coroide; Tomografia de coerência óptica; Fibras nervosas; Retina
of complications such as atherosclerosis, endothelial dysfunction, vascular remodeling, and hypertension; and this condition might trans form apnea and hypoapnea into a harmful stimulants for the cardiovascular system(3-5). Continuous positive airway pressure (CPAP) is used for the treatment of OSAS(6).
The choroidal tissue has extensive vasculature and can easily adapt to resultant systemic changes. In contrast to other posterior ocular tissues, choroidal vessels are subjected to systemic autonomic regu-lation(7). Therefore, the choroid is afected by the resultant autonomic dysfunction. In addition, normally, endothelin levels are more predo-minant than NO in choroidal blood low, and, there exits systemic
Evaluation of posterior ocular changes using enhanced depth imaging-optical
coherence tomography in patients with obstructive sleep apnea syndrome
Avaliação das alterações oculares posteriores utilizando tomograia de coerência óptica de profundidade
aprimorada em pacientes com síndrome de apneia obstrutiva do sono
İsa Yuvacı1, EmınE Pangal1, nurEttın BaYram1, sEvgı arık YüksEl2, BEdırhan alaBaY1, alPErEn ağadaYı1, EndEr sırakaYa1, ahmEt gülhan1
Submitted for publication: November 18, 2015 Accepted for publication: March 6, 2016
1 Eye Clinic, Kayseri Training and Research Hospital Kayseri, Kayseri, Turkey. 2 Neurology Clinic, Kayseri Training and Research Hospital, Kayseri, Turkey.
Funding: No specific financial support was available for this study.
Disclosure of potential conflicts of interest: None of the authors have any potential conflict of interest to disclose.
Corresponding author: İsa Yuvacı. Kayseri Training and Research Hospital Eye Clinic. Hastane
Str, 38010 - Kocasinan, Kayseri - Turkey - E-mail: [email protected]
increase in NO level in OSAS(8,9). For these reasons, choroidal evalua-tion can not only show the inluence of the disease on ocular tissues but can also be a useful indicator for early determination of systemic vascular injury. Main explanations for existing retinal thickness might be changes in vascular permeability that can occur due to alteration in hemodynamic parameters, such as hypoxia and hypercapnia; in-crease in growth factors and the extension of the process as a result of apnea and hypopne.
Hypercapnia-hypoxia that occurs at night because of the disease can cause injury in the head of the optic nerve, which is extremely sensitive to hypoxia, and ganglion cells(10,11). Glaucoma is more com-monly seen in individuals with the disease(10). Impairment of the balance between NO and endothelin is one of the factors which is attributed with ganglion cell injury in patients with glaucoma. As mentioned above, the delicate balance between NO and endothelin is also impaired in OSAS, and this suggests that glaucoma-like injury can occur. Increases in intraocular pressure (IOP) can afect the optic nerve and make it more sensitive to glaucoma-like injury. The more glaucoma and hypoxic medium, the more ganglion cells and optic nerve are vulnerable to high rates of injury.
Spectral domain optic coherence tomography (SD-OCT) can de-tect low degree retinal nerve losses in these tissues during the early stages of OSAS.
The efect of OSAS on the macula, choroid, and retinal nerve iber layer (RNFL) has not been comprehensively studied(12-15); moreover, these studies have conlicting results. Most of these studies have assessed the choroidal and RNFL or choroidal and retinal thickness. However, in our present study, all of the retinal, choroidal, and RNFL thicknesses have been evaluated. The aim of the present study is to evaluate posterior ocular structures in patients with newly diagnosed OSAS without any systemic disease and also evaluate posterior ocular alterations before treatment and during a 3-month follow-up.
METHODS
The present study was conducted in our clinic between Februa-ry 2014 and JanuaFebrua-ry 2015. Approval was obtained from the Erciyes University Ethics Committee for the study, which was conducted in accordance with the principles of the Helsinki Declaration. Written and verbal consent was obtained from the participants.
Inclusion criteria were >18 years of age, diagnosis with OSAS for the irst time, no treatment received for OSAS, and no other systemic disease. Exclusion criteria were corrected visual acuity <0.8, a history of previous ocular surgery or intravitreal injection, presence of any ocular disease, spherical equivalent (SE) greater than +3 diopters (D), SE value lesser than -3 D, and ocular axial length (AL) >24.99 mm.
Following polysomnography performed in the Neurology Sleep Laboratory, patients were classiied according to the frequency of apnea-hypopnea per hour of sleep (apnea-hypopnea indexes, AHI). Those with <5 AHI were placed in the control (C) group, those with 5-15 AHI were classiied in the mild (M) OSAS group, those with 15-30 AHI were classiied in the moderate (Mo) OSAS group, and those with ≥30 AHI were classiied in the severe (S) OSAS group(16).
All patients underwent routine ophthalmological examination, and biometric measurements were made using an İOL Master (Carl Zeiss Meditec, Dublin, CA). Later, the macula, choroid, and RNFL thi cknesses were measured with SD-OCT in each patient. Those indi-viduals who were diagnosed with severe OSAS and for whom treat-ment was started were re-evaluated after 4 and 12 weeks in terms of ocular examination and measurement of the posterior ocular structures. Only the right eyes of the participants were evaluated in the present study.
P
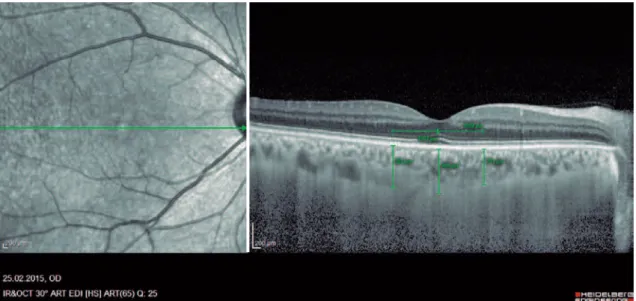
ROCEDUREOFIMAGEACQUISITIONThe central macular thickness (CMT), RNFL thicknesses, and cho roidal thickness (CT) measurements were obtained using the Spectralis SD-OCT (Heidelberg Engineering; wavelength: 870 nm) with the enhanced depth imaging modality that has previously been described) (Figure 1)(16). All subjects were imaged by the same experienced technician. The central subfoveal choroidal thickness (CSCT), temporal choroidal thickness (TCT; 1 mm temporal CT from the fovea), and nasal choroidal thickness (NCT; 1 mm nasal CT from the fovea) were measured by two clinicians (I.Y. and E.P.) in a blinded manner, without knowledge of information of the subjects, and the mean of their measurements was used in the analysis. Measurements with a diference larger than 10% between the clinicians were ex-cluded from the study. The peripapillary RNFL thickness parameters were automatically calculated using the same SD-OCT device and divided into regions including nasal (N) quadrant thickness (90°), nasal superior (Ns) quadrant thickness (45°), nasal inferior (Ni)
drant thickness (45°), temporal (T) quadrant thickness (90°), temporal superior (Ts) quadrant thickness (45°), temporal inferior (Ti) quadrant thickness (45°), and mean (G) thickness (360°) (Figure 2). To minimize the possibility of choroidal changes attributable to diurnal choroidal luctuations(17), all scans were performed during the same time of the day between 11:00 a.m.-12:00 p.m.
S
TATISTICALANALYSESAll statistical analyses were performed using SPSS for Windows version 22.0 (IBM Corp., Armonk, NY, USA). Continuous variables were presented as the mean ± standard deviation. Normal distribution was evaluated using the Kolmogorov-Smirnov test. Homogeneity of variances was tested using Levene’s test. The one-way analysis of variance (ANOVA) test was used to analyze parametric data. When a signiicant result was obtained, Schefé’s test was used for post hoc comparisons. For non-parametric statistics, data were analyzed
using the Kruskal-Wallis test. When a signiicant result was obtained, the Mann-Whitney U test with Bonferroni’s correction was used for post hoc comparisons. Diferences between variables at speciic time points of severe OSAS patients were analyzed by the repeated measures ANOVA test. A P value of <0.05 was considered statistically signiicant.
RESULTS
Seventy-two patients with OSAS participated in the present study. Patients were classiied according to the AHI.
The demographic and clinical data of the participants are given in detail in table 1. No statistically signiicant diference was obser-ved among the groups in terms of age, AL, IOP, or SE. However, the body mass index (BMI) was signiicantly higher in group S than in the other groups, whereas no signiicant diference existed among the other groups.
Figure 2. Example of retinal nerve iber layer (RNFL) thicknesses classiication.
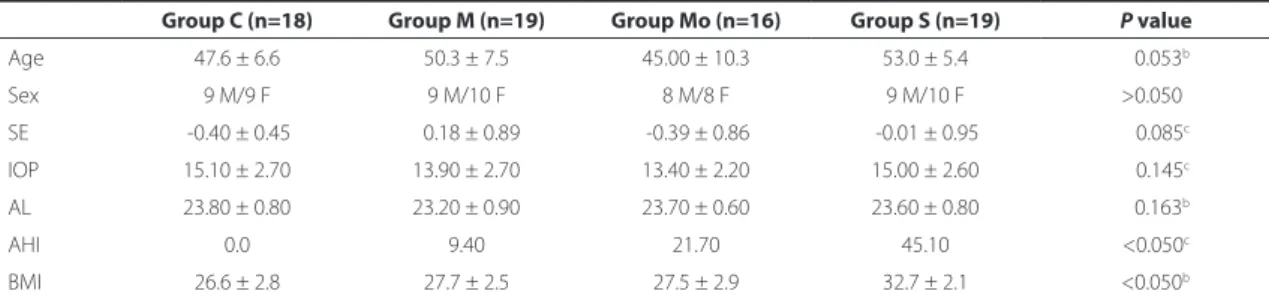
Table 1. Demographic and clinical data according to the frequency of apnea-hypopnea per hour of sleep (apnea-hypopnea indexes, AHI). Control group (C; AHI <5), mild obstructive sleep apnea syndrome (OSAS) group (M; 5 ≤AHI <15), moderate OSAS group (Mo; 15 ≤AHI <30), and severe OSAS group (S; AIH ≥30)(16)
Group C (n=18) Group M (n=19) Group Mo (n=16) Group S (n=19) P value
Age 47.6 ± 6.6 50.3 ± 7.5 45.00 ± 10.3 53.0 ± 5.4 0.053b
Sex 9 M/9 F 9 M/10 F 8 M/8 F 9 M/10 F >0.050b
SE -0.40 ± 0.45 00.18 ± 0.89 -0.39 ± 0.86 -0.01 ± 0.95 0.085c
IOP 15.10 ± 2.70 13.90 ± 2.70 13.40 ± 2.20 15.00 ± 2.60 0.145c
AL 23.80 ± 0.80 23.20 ± 0.90 23.70 ± 0.60 23.60 ± 0.80 0.163b
AHI 0.0 9.40 21.70 45.10 <0.050c
BMI 26.6 ± 2.8 27.7 ± 2.5 27.5 ± 2.9 32.7 ± 2.1 <0.050b
Variables are expressed as the mean ± standard deviation.
M= male; F= female SE= spherical equivalent; diopter; IOP= intraocular pressure; mmHg; Al= axial length; mm; AHI= apnea-hypopnea index; BMI= body mass index; kg/m2.
Measurements of posterior ocular structures of groups C, M, Mo, and S are given in detail in table 2. No signiicant diferences were observed among the groups in terms of CMT, CSCT, TCT, NCT, and RNFLs measurements (p=0.184, p=0.056, p=0.230, p=0.320, p>0.005, respectively).
After treatment, some posterior ocular structures changed signi-icantly in group S. While the CMT was 273.05 µm before treatment, it decreased to 272.00 µm after 4 weeks and to 270.52 µm after 12 weeks. Furthermore, the CSCT was 290.47 µm before treatment and decreased to 285.68 µm after 4 weeks and to 277.42 µm after 12 weeks. Finally, the mean RNFL was 101.10 µm before treatment, which decreased to 99.26 µm after 4 weeks and to 96.47 µm after 12 weeks. Table 3 shows these data in detail. Whereas statistically sig-niicant thinning was observed in the CSCT, G, Ni, Ns, and Ts during the 3-month follow-up of individuals with severe OSAS (p=0.005,
p=0.009, p=0.039, p=0.003, and p=0.02, respectively), no statistically
signiicant changes were found in the CMT, NCT, TCT, T, Ti, or N mea surements.
DISCUSSION
Various pathologies can be triggered by the additional efects that hemodynamic, humoral, and neurological changes have on cir-culation because of the resultant hypoxic and hyperbaric attacks that develop during OSAS. For instance, the frequency of macular edema is higher in individuals with OSAS with diabetes mellitus (DM) than in normal individuals, and thus OSAS poses a diferent risk for those with DM in terms of macular edema(18). Additionally, ocular diseases such as glaucoma usually accompany OSAS(10,19).
The efects of OSAS on posterior ocular tissues have been inves-tigated in several studies(11-14). In a study which investigated the dif erences in choroidal and RNFL thickness, the control group was
Table 3. Changes in the thicknesses of posterior ocular structures in severe obstructive sleep apnea syndrome (OSAS) over time
BT (n=19) A4W (n=19) A12W (n=19) p valuea
CSCT 290.47 285.68 277.42 0.005b
NCT 234.26 237.15 233.10 0.240b
TCT 242.47 248.47 236.57 0.410b
CMT 273.05 272.00 270.52 0.330b
G 101.10 99.26 96.47 0.009b
Ts 146.47 138.10 137.05 0.020b
T 78.05 77.73 75.26 0.232b
Tı 132.26 132.21 132.94 0.991b
N 74.42 74.89 72.36 0.631b
Ni 109.36 105.68 103.57 0.039b
Ns 117.05 115.94 111.78 0.003b
BT= before treatment; A4W= after 4 weeks; A12W= after 12 weeks; CSCT= central subfoveal choroidal thickness; NCT= nasal choroidal thickness; TCT= temporal choroidal thickness; CMT= central macular thickness; G= mean peripapillary RNFL thickness; Ts= temporal superior; T= temporal; Ti= temporal inferior; N= nasal; Ni= nasal inferior; Ns= nasal superior.
a= level of signiicance, P<0.05; b= repeated measures ANOVA.
Table 2. Posterior ocular structures measurements according to the frequency of apnea-hypopnea per hour of sleep (apnea-hypopnea indexes, AHI). Control group (C; AHI <5), mild obstructive sleep apnea syndrome (OSAS) group (M; 5 ≤AHI <15), moderate OSAS group (Mo; 15 ≤AHI <30), and severe OSAS group (S; AIH ≥30)(16)
Group C (n=18) Group M (n=19) Group Mo (n=16) Group S (n=19) p valuea
Choroidal thicknesses
CSCT 302.50 ± 86.90 323.60 ± 67.60 322.90 ± 76.80 290.47 ± 69.20 0.056b
NCT 278.50 ± 81.45 278.05 ± 92.28 284.20 ± 82.20 234.26 ± 57.33 0.320c
TCT 288.27 ± 80.79 284.73 ± 85.99 293.50 ± 65.20 242.47 ± 56.78 0.230c
CMT 272.11 ± 17.43 262.15 ± 30.90 259.56 ± 19.97 273.05 ± 17.94 0.184b
Retinal iber layer thicknesses
N 76.44 ± 0.51 76.78 ± 14.10 73.75 ± 11.45 74.42 ± 15.62 0.847c
Ns 113.00 ± 1.81 117.10 ± 27.45 112.18 ± 17.77 117.05 ± 17.18 0.791c
Ni 110.77 ± 3.31 113.42 ± 25.52 101.68 ± 12.40 109.36 ± 32.16 0.452c
T 71.00 ± 2.42 73.47 ± 17.22 69.93 ± 07.55 78.05 ± 11.12 0.142c
Ts 130.44 ± 2.95 136.21 ± 24.93 134.00 ± 10.25 146.47 ± 21.87 0.480c
Ti 136.44 ± 3.61 136.89 ± 20.09 140.50 ± 12.69 132.26 ± 32.65 0.705c
G 97.55 ± 9.27 100.57 ± 11.74 97.37 ± 05.94 101.10 ± 03.01 0.605c
Variables are expressed as the mean ± standard deviation.
CSCT= central subfoveal choroidal thickness; NCT= nasal choroidal thickness; TCT= temporal choroidal thickness; CMT= central macular thickness; N= nasal; Ns= nasal superior; Ni= nasal inferior; T= temporal; Ts= temporal superior; Ti= temporal inferior; G= mean.
compared with mild, moderate, and severe OSAS groups(12). In the severe group, the nasal choroid was found to be thinner than that in the moderate OSAS group and thicker than that in the control group. In our study, although diferences in thickness were observed, no signiicant diferences were found between the control group and the other OSAS groups in terms of CMT, CSCT, NCT, TCT, and RNFL thickness. As mentioned above, OSAS causes substantial changes in the vascular system. Although they do not cause apparent clinical indings, such as glaucoma, hypertension i.e. injury induced by these changes can manifest systemically in the vascular system. However, the duration for which it inluences the vascular system depends on the duration of the disease and the presence of other factors that can cause additional vascular injury. In a study that was conducted on the response of the choroid to hypocapnia in patients with OSAS, it was demonstrated that choroidal relexes in individuals in which cardio-vascular system CVS is not afected do not difer from that in normal individuals(20). Patients in our study were individuals who were newly diagnosed with OSAS without a systemic component, which could have caused the lack of diferences in the initial measurements. Thus, although patients in the severe OSAS group received treatment, sig-niicant thinning was observed in the CSCT and RNFL quadrants in this group as in the aforementioned study(12). In contrast, when the CMT was evaluated in our study, no signiicant change was observed either in the initial measurements or during follow-up.
In another study in which changes in choroidal and macular thi cknesses in OSAS were investigated, choroidal thinning was observed during the course of the disease(13). Similarly, in our study, changes in nasal, temporal, and central choroidal thickness were measured but no signiicant changes were found(13). Similar to our study, the previous study also investigated macular thickness, and it was determined that the central and nasal macular regions were thicker in the severe OSAS group than in the control group. The author compared the decreased choroid thickness and increased macular thickness to indings in diabetic retinopathy, and noted that macular thickening can result from vascular damage and increased permeability. In our study, at irst glance, the existence of no diferen-ce between the groups can be interpreted as there was no efect on vascular structures and that damage occurred. But, vascular damage and the appearance of the efects of this damage are determined by diferent elapsed times and personal variations of tissue reaction. In any case, a change in macular thickness was observed and choroidal thinning took place during the follow-ups.
In a previous study on OSAS in which the choroidal thickness was evaluated, choroidal thinning was observed in patients with severe OSAS(14). The author emphasized that this inding could have been caused by impaired blood and auto regulations in OSAS. The results of the patients with OSAS in that study were similar to those of the severe OSAS group in our study; the mean AHI in the previous study was 48, whereas the mean AHI in the severe OSAS group in our study was 45.1. Our study indicates that although the measurements of those with severe OSAS are not normal and do not difer from those of patients with less severe forms of OSAS’ others with OSAS, eventual thinning of the choroidal thickness and RNFL sectors shows that the disease has progressive efects both in blood regulation and RNFL injury.
Similar to our study, thinning of the RNFL was also found in a previous study on patients with OSAS who were followed up for 3 months(21). Followed up patients received treatment with CPAP in that study. Whereas only those with AHI ≥30 received treatment in our study, treatment was administered to those with AHI ≥5 in the pre-vious study. Data from our study are similar to those from the prepre-vious study: whereas thinning in the RNFL and the Ts, Ns, and Ni quadrants was observed, changes in the other quadrants were not statistically signiicant. The author stated that the tendency of individuals with OSAS to develop glaucoma could have had an efect on that result. Although ganglion cell injury is generalized in glaucoma, the inferior
and superior quadrants can be afected earlier in the disease pro-gression(22). Furthermore, while the mean IOP statistically signiicantly increased in our study, it did not reach the normal range. Thinning in the RNFL can occur not only because of glaucoma but also because of apnea-hypopnea, nocturnal hypotension, and impairment of the balance between NO and endothelin, leading to hypoperfusion and ischemia. Compared with most of the studies in this ield, a statisti-cally insigniicant diference in RNFL thickness was found between the control group and patients with OSAS in our study.
In a study on the relationship of RNFL and other vascular patho-logies with OSAS, an inverse relationship was found between AHI and RNFL thickness(15). Additionally, an inverse relationship was found bet-ween atherosclerosis and nasal RNFL thickness. It has been demons-trated that in young, healthy individuals, temporal retinal regions are more vascularized than nasal regions(23,24). This can explain why nasal tissues are damaged much earlier in hypoxia. Thus, in the majority of other studies and in ours, the nasal RNFL quadrants were afected. In the aforementioned study, inverse relationships were established between nasal RNFL thickness and atherosclerosis, BMI, and high-den sity lipoprotein cholesterol levels(15). Moreover, in another study that investigated the retina and optic nerve in adult OSAS patients using OCT, the nasal part of the RNFL was found to be thinner in OSAS patients than in the control group (without relevance to the classiication of OSAS)(25). The aforementioned reasons such as hypo-xia, hypercapnia i.e. are factors that somehow decrease the vascular supply, and the efect on the nasal quadrants occurred much earlier, thus conirms the results of our study. Our indings of statistically insigniicant diferences between the groups in terms of the initial RNFL thickness may be attributable to the exclusion of patients with glaucoma from our study, as glaucoma is more common in OSAS populations than in normal populations(10,20).
There are several limitations to our study that should be acknow-ledged. First, we included a relatively small number of patients in our study. Second, as systemic illnesses and eye diseases such as glau-coma are common in patients with OSAS, the inclusion of patients without any ocular or systemic diseases other than OSAS in our study is another limitation. The exclusion of people with glaucoma from our study may also explain the similar initial RNFL thicknesses found in the study groups.
In our study, we compared untreated patients with OSAS who were newly diagnosed and had no systemic disease. Individuals with severe OSAS who received CPAP treatment were re-evaluated after 4 and 12 weeks in terms of posterior ocular changes. In the irst mea-surement no statistical diference was found between control group and the OSAS’ the normal group and other groups. Despite the fact that the individuals with severe OSAS who were followed up, bene-itted from treatment clinically; statistically signiicant thinning in the CSCT, general RNFL, Ts, Ni, and Ns quadrants was found. Although patients with severe OSAS may recover clinically, we recommend that they be followed up in terms of ocular ischemic injury.
ACKNOWLEDGMENTS
The authors thank all the staf of the Ophthalmology Department - in particular, Sevilay Sözeri - for their contributions to the follow-up of data in our study and communication with participants.
REFERENCES
1. Punjabi NM. The epidemiology of adult obstructive sleep apnea. Proc Am Thorac Soc. 2008;5(2):136-43.
2. Waller EA, Bendel RE, Kaplan J. Sleep disorders and the eye. Mayo Clin Proc. 2008; 83(11):1251-61
3. Caples SM, Garcia-Touchard A, Somers VK. Sleep-disordered breathing and cardiovas-cular risk. Sleep. 2007;30(3):291-303.
5. Arnaud C, Dematteis M, Pepin JL, Baguet JP, Levy P. Obstructive sleep apnea, immuno-in lammation, and atherosclerosis. Semimmuno-in Immunopathol. 2009;31(1):113-25. 6. Waradekar NV, Sinoway LI, Zwillich CW, Leuenberger UA. Inluence of treatment on
muscle sympathetic nerve activity in sleep apnea. Am J Respir Crit Care Med. 1996; 153(4 Pt 1)1333-8.
7. Nickla DL, Wallman J. The multifunctional choroid. Prog Retin Eye Res. 2010;29(2):144-68. 8. Mojon DS, Mathis J, Zulauf M, Koerner F, Hess CW. Optic neuropathy associated with
sleep apnea syndrome. Ophthalmology. 1998;105(5):874-7.
9. Fuchsiager-Mayrl G, Luksch A, Malec M, Polska E, Wolzt M. Schmettener K. Role of endothelin-1 in choroidal blood low regulation during isometric exercise in healthy humans. Invest Ophthalmol Vis Sci. 2003;44(2):728-33.
10. Bendel RE, Kaplan J, Heckman M, Fredrickson PA, Lin SC. Prevalence of glaucoma in patients with obstructive sleep apnoea - a cross-sectional case series. Eye(Lond) 2008;22(9):1105-9.
11. Lin PW, Friedman M, Lin HC, Chang HW, Pulver TM, Chin CH. Decreased retinal nerve iber layer thickness in patients with obstructive sleep apnea/hypopnea syndrome. Graefes Arch Clin Exp Ophthalmol. 2011;249(4):585-93.
12. Bayhan HA, Aslan Bayhan S, İntepe YS, Muhaiz E, Gürdal C. Evaluation of the ma-cular choroidal thickness using spectral-domain optical coherence tomography in patients with obstructive sleep apnoea syndrome: response. Clin Experiment Oph-thalmol. 2015;43(2):139-44.
13. Xin C, Wang J, Zhang W, Wang L, Peng X. Retinal and choroidal thickness evaluation by SD-OCT in adults with obstructive sleep apnea-hypopnea syndrome (OSAS). Eye (Lond). 2014;28(4):415-21.
14. Karalezli A, Eroglu FC, Kivanc T, Dogan R. Evaluation of choroidal thickness using spectral-domain optical coherence tomography in patients with severe obstructive sleep apnea syndrome: a comparative study. Int J Ophthalmol. 2014;7(6):1030-4. 15. Shiba T, Takahashi M, Sato Y, Onoda Y, Hori Y, Sugiyama T et al. Relationship between
severity of obstructive sleep apnea syndrome and retinal nerve iber layer thickness. Am J Ophthalmol. 2014;157(6):1202-8.
16. Epstein LJ, Kristo D, Strollo PJ, Friedman N, Malhotra A, Patil SP, Ramark K, Rogers R,
Schwab RJ, Weaver EM, Weinstein MD; Adult Obstructive Sleep Apnea Task Force of the American Academy of Sleep Medicine. et al. Clinical guideline for the evaluation, management and long-term care of obstructive sleep apnea in adults. J Clin Sleep Med. 2009;15.5(3):263-76.
17. Spaide RF, Koizumi H, Pozonni MC, Enhanced depth imaging spectral-domain optical coherence tomography. Am J Ophthalmol. 2008;146(4):496-500. Erratum in: Am J Oph thalmol. 2009;148(2):325.
18. Usui S, Ikuno Y, Akiba M, Maruko I, Sekiryu T, Nishida et al. Circadian changes in subfoveal choroidal thickness and the relationship with circulatory factors in healthy subjects. Invest Ophthalmol Vis Sci. 2012;53(4):2300-7.
19. Mason RH, West SD, Kiire CA, Groves DC, Lipinski HJ, Jaycock A, et al. High prevalence of sleep disordered breathing in patients with diabetic macular edema. Retina. 2012; 32(9):1791-8. Comment in: Retina. 2012;32(10):2180; author reply 2180.
20. Lin PW, Friedman M, Lin HC, Chang HW, Wilson M, Lin MC. Normal tension glaucoma in patients with obstructive sleep apnea/hypopnea syndrome. J Glaucoma. 2011; 20(9):553-8.
21. Khayi H, Pepin JL, Geiser MH, Tonini M, Tamisier R, Renard E, et al. Choroidal blood low regulation after posture change or isometric exercise in men with obstructive sleep apnea syndrome. Invest Ophthalmol Vis Sci. 2011;16;52(13):9489-96. 22. Zengin MO, Tuncer I, Karahan E. Retinal nerve iber layer thickness changes in
obs-tructive sleep apnea syndrome: one year follow-up results. Int J Ophthalmol. 2014; 7(4):704-8.
23. Leung CK, Lam S, Weinreb RN, Liu S, Ye C, Liu L, et al. Retinal nerve iber layer imaging with spectral-domain optical coherence tomography: analysis of the retinal nerve iber layer map for glaucoma detection. Ophtalmology. 2010;117(9):1684-91. 24. Garhofer G, Werkmeister R, Dragostinof N, Schmetterer L. Retinal blood low in
healthy young subjects. Invest Ophthalmol Vis Sci. 2012;53(2):698-703.