O
r i g i n a la
rt i c l e3 1 5 Arq Bras Oftalmol. 2016;79(5):315-8 http://dx.doi.org/10.5935/0004-2749.20160090
INTRODUCTION
Cone dystrophy (CD) is an inherited retinal disease characterized by the deterioration of the cone cells responsible for central and color vision(1). Progressive vision loss, decreased color vision, photophobia, and nystagmus are common clinical features of CD. Full-field electro-retinography (ERG) reveals reduced single and flicker cone responses under photopic conditions and normal rod responses under scotopic conditions. ERG is a more sensitive technique and can be used to diag-nose CD earlier than is possible using current diag nostic techniques(1).
A variety of mechanisms, such as defective outer segment mor-phogenesis, protein transport along the cilium, phototransduction, or cellular interaction, have been suggested as being responsible
for cone dysfunction(2). The retinal pathology of CD occurs mainly between the photoreceptor outer segment and retinal pigment epi-thelium (RPE) layer(1). Alterations in the retinal structure were pre-viously demonstrated in patients with CD using spectral-domain optical coherence tomography (SD-OCT)(3), and some investigators have observed reduced neuroretinal thickness in the fovea centralis and macula using SD-OCT(3). Enhanced depth imaging (EDI) is a tech-nique that can be utilized to examine both the retina and choroid using specific focusing techniques and an SD-OCT device(4). Images acquired with EDI-OCT not only have an improved ability to visualize the deeper ocular structures and the choroid; they also allow the thickness and contour of the choroid to be assessed(5).
Submitted for publication: February 17, 2016 Accepted for publication: April 14, 2016
1 Department of Ophthalmology, GATA Medical School, Ankara, Turkey. 2 Department of Ophthalmology, Van Military Hospital, Van, Turkey.
Funding: No specific financial support was available for this study.
Disclosure of potential conflicts of interest: None of the authors have any potential conflicts of interest to disclose.
Corresponding author: Onder Ayyıldız. Department of Ophthalmology. GATA Medical School. Ankara
06010 - Turkey - E-mail: [email protected]
Approved by the following research ethics committee: GATA Medical School (# 2015-KAEK-45). ABSTRACT
Purpose: The aim of the present study was to use enhanced depth imaging optical coherence tomography (EDI-OCT ) to investigate choroidal changes in patients with cone dystrophy (CD) and to correlate these findings with clinical and electroretinography (ERG) findings.
Methods: This case-control study included 40 eyes of 20 patients with CD and 40 eyes of 40 age- and refraction-matched healthy individuals. Choroidal thickness (CT) measurements were obtained under the foveal center and at 500 and 1,500 µm from the nasal and temporal regions to the center of the fovea, respectively. EDI-OCT and ERG data were analyzed, and the correlations of CT with the best-corrected visual acuity (BCVA) and the central foveal thickness (CFT ) were evaluated.
Results: The mean subfoveal CTs in the CD and control groups were 240.70 ± 70.78 and 356.18 ± 48.55 µm, respectively. The subfoveal CT was significantly thinner in patients with CD than in the controls (p<0.001). The patients with CD also had significantly thinner choroids than the controls at each measurement location relative to the fovea (p<0.001). The subfoveal CT in the CD group correlated with CFT (p=0.012), but no significant correlation was found between the subfoveal CT and BCVA or photopic ERG responses.
Conclusions: The present study demonstrated a significant thinning of the choroid in patients with CD. EDI-OCT is a useful technique for describing the choroidal changes occurring in CD. Future studies investigating the association between choroidal changes and outer retinal destruction or the disease stage may provide a better understanding of the pathophysiology of CD.
Keywords: Choroid; Fovea centralis; Retinal dystrophies; Retinal cone photore-ceptor; Tomography, optical coherence; Electroretinography
RESUMO
Objetivo: O objetivo deste estudo foi a utilização de imagens de tomografia de coerência óptica com profundidade aprimorada (EDI-OCT ) para investigar alte-rações da coroide em pacientes com distrofia de cones (CD) e correlacionar esses achados com os achados clínicos e de eletrorretinografia (ERG).
Métodos: Este estudo de caso-controle incluiu 40 olhos de 20 pacientes com CD e 40 olhos de 40 indivíduos saudáveis com idades e refração pareados. As medidas da espessura da coroide (CT ) foram obtidas sob o centro foveal e a 500 µm e 1.500 µm de distância do centro da fóvea, nas regiões nasais e tem-porais. Dados de EDI-OCT e ERG foram analisados e as correlações do CT com a acuidade visual melhor corrigida (BCVA) e da espessura foveal central (CFT ) foram realizadas.
Resultados: As CTs subfoveais médias nos grupos CD e controle foram 240,70 ± 70,78 µm e 356,18 ± 48,55 µm, respectivamente. A CT subfoveal foi significativa-mente mais fina em pacientes com CD do que nos controles (p<0,001). Os com CD pacientes apresentaram também coroides significativamente mais finas do que os controles, em cada local de medição em relação à fóvea (p<0,001). A CT subfoveal no grupo CD se correlacionou com o CFT (p=0,012), mas nenhuma correlação significativa foi encontrada entre a CT subfoveal e a acuidade visual ou respostas fotópicas da ERG.
Conclusões: O presente estudo demonstrou um afinamento significativo da coroide em pacientes com CD. A EDI-OCT é uma técnica útil para descrever as mudanças que ocorrem na coroide de pacientes com CD. Futuros estudos in-vestigando a associação entre as alterações da coroide e a destruição da retina externa ou estágio da doença irão proporcionar uma melhor compreensão da fisiopatologia da CD.
Descritores: Coroide; Fóvea central; Distrofias retinianas; Células fotorreceptoras retinianas cones; Tomografia de coerência óptica; Eletrorretinografia
Is there a relationship between outer retinal destruction and choroidal changes
in cone dystrophy?
Existe uma relação entre a destruição da retina externa e alterações da coroide em distroia de cones?
Ist h e r ea r e l at I o n s h I pb e t w e e no u t e rr e t I n a ld e s t r u c t I o n a n dc h o r o I d a lc h a n g e sI nc o n ed y s t r o p h y?
3 1 6 Arq Bras Oftalmol. 2016;79(5):315-8
Most inherited retinal dystrophies lead to damage of the outer re-tinal structures and RPE. Several studies have demonstrated that a loss of photoreceptor and RPE cells leads to secondary choroidal thinning and atrophy(4,5). The pathogenesis of photoreceptor cell deterioration and RPE dysfunction in CD remains unclear, and knowledge on the changes in the choroid in retinal dystrophies is limited. To the best of our knowledge, no published study has yet examined the choroidal alterations in a large group of patients with CD using EDI-OCT.
The aims of this case-control study were to image and describe the choroidal changes occurring in patients with CD using EDI-OCT, to compare the results with those from age- and refraction-matched healthy controls, and to correlate these outcomes with the best-cor-rected visual acuity (BCVA) and ERG responses.
METHODS
This diagnostic case-control study was approved by the insti-tutional review board at GATA Medical School (# 2015-KAEK-45) and was performed at GATA Medical School between March and December 2015. Informed consent was obtained from each subject, and all study procedures adhered to the tenets of the Declaration of Helsinki. Twenty patients with CD were enrolled, and 40 healthy age- and refraction-matched volunteers without CD or other ocular diseases were included for comparison purposes as a control group. Data recorded for all subjects included Snellen BCVA, intraocular pressure, biomicroscopy, fundoscopy, refractive error, and EDI-OCT (Spectralis OCT; Heidelberg Engineering, Heidelberg, Germany) fin-dings as well as demographic data such as age and sex. The diagnos-tic criteria for CD were as follows: decreased cone cell function with relatively normal rod cell function in full-field ERG (RetiScan System; Roland Consult, Wiesbaden, Germany); a history of progressive visual loss, photophobia, nystagmus, or poor color vision; and fundoscopic findings in the macula with non-specific changes to the characteristic RPE lesions of the bull’s eye and reduced neuroretinal thickness in the fovea and macula in OCT. All patients with CD underwent color vision testing and full-field standard ERG. Some of the patients with CD also underwent visual field testing, fluorescein angiography, and fundus autofluorescence imaging.
All subjects were examined using EDI-OCT imaging with pupil dilation. All EDI-OCT images were obtained by the same experienced technician in ambient lighting in the afternoon. The OCT device was positioned sufficiently close to the eye to obtain an inverted image. Each section was obtained using automatic eye-tracking software, and 100 averaged images were taken to improve the signal-to-noise ratio. A horizontal image across the fovea was obtained for each sub ject. The choroidal thickness (CT) measurement was performed ma nually in a vertical direction from RPE/Bruch’s membrane interface to the sclerochoroidal interface (Figure 1). The choroid was indepen-dently measured by two blinded observers (OA and GO) at the foveal center and at 500 and 1,500 µm from the nasal and temporal regions to the center of the fovea, respectively. The measurement locations were determined according to the cone cell density in the retina(6).
Data analysis was performed using SPSS for Windows 16.0 softwa-re package (SPSS, Inc., Chicago, IL, USA). The data wesoftwa-re expsoftwa-ressed as percentage values or as group mean and standard deviation values. The t-test was used to compare continuous variables with normal dis-tribution, and the Mann-Whitney U-test was used to compare non-nor mally distributed continuous variables. The chi-square test was used for the comparison of discrete variables. Pearson correlations were performed to explore the correlations among BCVA, central foveal thickness (CFT), subfoveal CT, and photopic ERG responses in the CD group. A p-value<0.05 was accepted as statistically significant.
RESULTS
A total of 20 patients (12 men and 8 women; 40 eyes) with a diagnosis of CD were included in the study. The mean age was 28
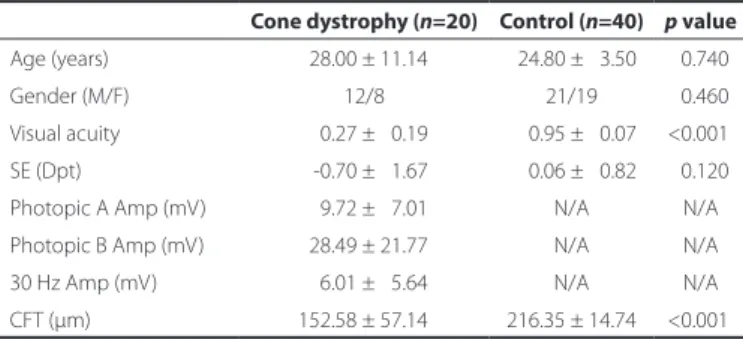
± 11.14 years (range, 18-55 years); the mean spherical equivalent (SE) was -0.70 ± 1.67 diopters (range, -3.50 to +2.50); and the mean BCVA was 0.27 ± 0.19. All patients were phakic with clear lenses. The control group included 40 individuals (21 men and 19 women; 40 eyes) with no abnormalities of the anterior segment and fundus. The mean age in the control group was 24.50 ± 3.50 years (range, 18-32 years); the mean SE was 0.06 ± 0.82 diopters (range, -1.50 to +1.25); and the mean BCVA was 0.95 ± 0.07. The study group and the control group differed significantly in terms of BCVA (p<0.001), whereas the age and SE differences were not statistically significant (p=0.74 and p=0.12, respectively; Table 1).
The mean CFT measured 152.58 ± 57.14 µm in the CD group and 219.35 ± 14.74 µm in the control group. CFT was significantly thinner in patients with CD than in controls (p<0.001; Table 1). In addition to the significant difference in CFT between the groups, the mean subfoveal CTs in the CD and control groups were 240.70 ± 70.78 and 356.18 ± 48.55 µm, respectively. The subfoveal CT was also significan-tly thinner in patients with CD than in controls (p<0.001; Figure 2). The CT measurements taken at 1,500 and 500 µm from the nasal region, and 500 and 1,500 µm from temporal region to the center of the fovea were, respectively, 190.80 ± 79.17, 235.68 ± 77.66, 243.48 ± 72.24, and 221.13 ± 63.14 µm in the CD group and 325.18 ± 54.28, 336.70 ± 43.31, 330 ± 55.38, and 372.38 ± 41.83 µm in the control group (Figure 2). The patients with CD had significantly thinner CTs compared with the controls at each measurement location relative to the fovea (p<0.001).
The mean BCVAs for the CD and control groups were 0.27 ± 0.19 and 0.95 ± 0.07, respectively (p<0.001). Best corrected visual acuity correlated weakly with CFT in the CD group (Pearson’s r=0.552, p<0.001) and no correlation was found between BCVA and other fac-tors, such as the subfoveal CT and photopic ERG responses (Table 2). In the same group, subfoveal CT correlated weakly with CFT (Pearson’s r=-0.396, p=0.012) and no significant correlation was found between the subfoveal CT and BCVA or the photopic ERG responses.
DISCUSSION
Previous histopathological studies have established chorioca-pillaris degeneration, photoreceptor loss, and RPE deterioration in eyes with various dystrophies(7,8). The photoreceptor layer and RPE are the major sites of structural impairment as discerned by SD-OCT in patients with CD. Some investigators have observed reduced
neuro-A
B
Ay y i l d i z O, e t A l.
3 1 7
Arq Bras Oftalmol. 2016;79(5):315-8
retinal and retinal thickness in the fovea, with this reduced thickness predominantly localized to the outer layers(3,9). In agreement with the-se previous findings, we found a significant decreathe-se in CFT in eyes with CD (Table 1). In addition, BCVA and the subfoveal CT correlated with the thinning of these retinal layers (Table 2).
Visual acuity (VA) is determined by the number of preserved cones in the fovea(3). The neuroretinal thickness in the fovea is not the only determining factor for VA as VA also depends on the extent of the preservation of the photoreceptors and of the contour of the outer retinal layer-RPE complex(3). Eyes with better preserved
neuro-retinal structures in the fovea show a smaller reduction in the neuro-retinal thickness and better VA(3).
In this case-control study, the patients with CD demonstrated sig-nificantly thinner CTs than healthy controls at each measurement lo-cation relative to the fovea. The significance of the choroidal thinning observed in CD is unclear. It may be related to the characteristic pho-toreceptor degeneration of CD, which could cause choroidal thin-ning. A similar thinning of the choroid has been reported in patients with other inherited retinal dystrophies and in animal models(4,5,10). Destruction of the RPE cells has been reported in animal models of disease responsible for secondary choriocapillaris atrophy(5,11). A requirement for vascular endothelial growth factor, which is produ-ced by RPE cells, has been demonstrated for choroidal maintenance; therefore, this growth factor may play a role in choroidal thinning(4,12).
The retinas, and especially the photoreceptor cells, are the most metabolically active tissues in the body, and their oxygen consump-tion is faster than that seen in other tissues(13). Progressive destruction of the outer segment of the retina in retinal dystrophies may reduce the demand for oxygen and other metabolic nutrients. Impaired oxygenation and a reduced nutrient supply may thus contribute to the reduction in retinal and choroidal blood flow. Reductions in retinal and choroidal circulation and volume have previously been shown to occur in hereditary retinal disorders and in animal models of disease(4,14,15). Consequently, the choroidal thinning observed in our patients may be a manifestation of decreased choroidal blood flow and may indicate reduced oxygen dependence in the retina.
We found no significant correlation between BCVA and subfoveal CT in the patients with CD in our study. Previous studies that exami-ned the choroid using EDI-OCT for a variety of other inherited retinal disorders also revealed no relationship between choroidal thinning and BCVA(4,5,7). Interestingly, the subfoveal CT correlated with CFT in the current study. On the contrary, Dhoot et al.(4) and Yeoh et al.(5) found no correlation between CT and CFT. Yeoh et al.(5) reported al terations in the choroid in eyes with inherited retinal disorders, and they analyzed CT with focal retinal thinning using EDI-OCT; however, they did not correlate the results with those of age-matched healthy controls. In the present study, we determined a diffuse thinning of the choroid and a break of the choroidal contour in relation to the outer retinal damage in patients with CD; these features were correlated with CFT.
In CD, only the cone responses are diminished in the standard full-field ERG. ERG is more sensitive and can be used to diagnose CD earlier than is possible with current SD-OCT techniques(1). Cho et al.(1) reported a correlation between central retinal thinning and BCVA as well as the electrophysiological function, in eyes with CD. However, in our study, no significant correlation was found between retinal dysfunction on ERG and any of the other variables, such as BCVA, CFT, or CT (Table 2). Demonstration of a relationship among these pa rameters may require studies on a larger population.
The limitations of this study are the lack of genetic investigation, the small sample size, and its cross-sectional nature. We did not assess the various retinal and choroidal layers, and nor did we measure the choroidal blood flow. A prospective longitudinal assessment of the outer retinal injury in patients with CD and the relationship with choroidal alterations may contribute further to our understanding of the pathogenesis of CD.
In conclusion, patients with CD showed significantly thinner cho-roids than individuals in the control group. BCVA and the subfoveal CT correlated with CFT in these patients; however, BCVA did not cor-relate with the subfoveal CT. A long-term study with more subjects may establish a correlation between the disease stage and the extent and pattern of choroidal thinning.
REFERENCES
1. Cho SC, Woo SJ, Park KH, Hwang JM. Morphologic characteristics of the outer retina in cone dystrophy on spectral-domain optical coherence tomography. Korean J Oph thalmol. 2013;27(1):19-27.
Table 1. Characteristics of the individuals
Cone dystrophy (n=20) Control (n=40) p value
Age (years) 28.00 ± 11.14 024.80 ± 03.50 0.740
Gender (M/F) 12/8 21/19 0.460
Visual acuity 0.27 ± 00.19 000.95 ± 00.07 <0.001 SE (Dpt) -0.70 ± 01.67 000.06 ± 00.82 0.120
Photopic A Amp (mV) 9.72 ± 07.01 N/A N/A
Photopic B Amp (mV) 28.49 ± 21.77 N/A N/A
30 Hz Amp (mV) 6.01 ± 05.64 N/A N/A
CFT (µm) 152.58 ± 57.14 216.35 ± 14.74 <0.001
M= male; F= female; SE= spherical equivalent; Dpt= diopter; Amp= amplitude; Photopic A= electroretinogram photopic A wave; Photopic B= electroretinogram photopic B wave; 30 Hz= electroretinogram 30-Hz wave; N/A= not applicable; CFT= central foveal thickness.
Table 2. Pearson correlations in the cone dystrophy group (p values)
BCVA CFT SCT
Photopic A Amp
Photopic B Amp
30 Hz Amp
BCVA 1 <0.001 0.770 0.180 0.23 0.77
CFT <0.001 1 0.012 0.680 0.57 0.77
SCT 0.770 0.012 1 0.360 0.27 0.08
Photopic A Amp 0.180 0.680 0.360 1 N/A N/A Photopic B Amp 0.230 0.570 0.270 N/A 1 N/A
30 Hz Amp 0.770 0.770 0.080 N/A N/A 1
Ist h e r ea r e l at I o n s h I pb e t w e e no u t e rr e t I n a ld e s t r u c t I o n a n dc h o r o I d a lc h a n g e sI nc o n ed y s t r o p h y?
3 1 8 Arq Bras Oftalmol. 2016;79(5):315-8
2. Lima LH, Sallum JM, Spaide RF. Outer retina analysis by optical coherence tomogra-phy in cone-rod dystrotomogra-phy patients. Retina. 2013;33(9):1877-80.
3. Zahlava J, Lestak J, Karel I. Optical coherence tomography in progressive cone dystro-phy. Biomed Pap Med Fac Univ Palacky Olomouc Czech Repub. 2014;158(4):628-34. 4. Dhoot DS, Huo S, Yuan A, Xu D, Srivistava S, Ehlers JP, et al. Evaluation of choroidal
thickness in retinitis pigmentosa using enhanced depth imaging optical coherence tomography. Br J Ophthalmol. 2013;97(1):66-9.
5. Yeoh J, Rahman W, Chen F, Hooper C, Patel P, Tufail A, et al. Choroidal imaging in inherited retinal disease using the technique of enhanced depth imaging optical coherence tomography. Graefes Arch Clin Exp Ophthalmol. 2010;248(12):1719-28. 6. Jonas JB, Schneider U, Naumann GO. Count and density of human retinal
photore-ceptors. Graefes Arch Clin Exp Ophthalmol. 1992;230(6):505-10.
7. Chhablani J, Nayaka A, Rani PK, Jalali S. Choroidal thickness profile in inherited retinal diseases in Indian subjects. Indian J Ophthalmol. 2015;63(5):391-3.
8. Voo I, Glasgow BJ, Flannery J, Udar N, Small KW. North Carolina macular dystrophy: Clinicopathologic correlation. Am J Ophthalmol. 2001;132(6):933-5.
9. Wolfing JI, Chung M, Carroll J, Roorda A, Williams DR. High resolution retinal imaging of cone-rod dystrophy. Ophthalmology. 2006;113(6):1014-9.
10. May CA, Horneber M, Lutjen-Drecoll E. Quantitative and morphological changes of the choroid vasculature in RCS rats and their congenic controls. Exp Eye Res. 1996; 63(1):75-84.
11. Korte GE, Reppucci V, Henkind P. RPE destruction causes choriocapillary atrophy. Invest Ophthalmol Vis Sci. 1984;25(10):1135-45.
12. Saint-Geniez M, Kurihara T, Sekiyama E, Maldonado AE, D’Amore PA. An essential role for RPE-derived soluble VEGF in the maintenance of the choriocapillaris. Proc Natl Acad Sci USA. 2009;106(44):18751-6.
13. Caprara C, Grimm C. From oxygen to erythropoietin: relevance of hypoxia for retinal development, health and disease. Prog Retin Eye Res. 2012;31(1):89-119.
14. May CA, Narfstrom K. Choroidal microcirculation in Abyssinian cats with hereditary rod-cone degeneration. Exp Eye Res. 2008;86(3):537-40.
15. Langham ME, Kramer T. Decreased choroidal blood flow associated with retinitis pigmentosa. Eye (Lond). 1990;4(Pt 2):374-81.