Blood Pressure Reduction in Hyper-reactive Individuals after Aerobic
Exercise
Cleusa Maria Richter
1, Tiago Facchini Panigas
1, Daiana Cristine Bündchen
1, Thiago Dipp
1, Kalyse Claudino Belli
1,
Paulo Ricardo Nazário Viecili
1,2Instituto de Cardiologia de Cruz Alta1; Universidade de Cruz Alta - UNICRUZ2, Cruz Alta, RS - Brazil
Mailing address: Paulo Ricardo Nazário Viecili •
Rua Domingos Veríssimo, 636 - Cruz Alta - 98005-700 - Cruz Alta, RS - Brazil
E-mail: [email protected], [email protected]
Manuscript received January 14, 2009; revised manuscript received September 08, 2009; accepted October 07, 2009.
Abstract
Background: Some normotensive sedentary individuals have an exaggerated increase in blood pressure (BP) during physical activity, which is a behavior that is called blood pressure hyper-reactivity.
Objective: To investigate the effect of an aerobic exercise program (AEP) on blood pressure in individuals with blood pressure hyper-reactivity (BPH).
Methods: Ten male volunteers with BPH, aged 45 ± 10 years, referred to as the experimental group (EG), took part in an AEP on a treadmill, 3 times a week for two months. They were compared to 14 men with BPH, aged 48 ± 8 years, referred to as the control group (CG), who remained sedentary. The subjects were evaluated before and after the AEP by stress test for comparison purposes. We evaluated the initial, peak and test-end heart rates (HR), systolic blood pressure (SBP) and diastolic blood pressure (DBP).
Results: There a significant decrease in the initial SBP (-5%; p=0.01), initial DBP (-4.6%; p=0.01), peak SBP (-12.4%; p=0.001), peak DBP (-14.7%; p=0.03), final SBP (-4.6%, p=0.03) in the EG. The CG continued with its hyper-reactive behavior, which evolved to more exaggerated levels when the results before and after the study were compared (p<0.04). In the HR, there was an increase only in the final HR, of 11.3 bpm, after training (p=0.02). The test-peak VO2 increased by 4.4 ml.kg-1.min-1 in the EG (p=0.01) and remained similar in the CG.
Conclusion: The AEP normalized the behavior of the blood pressure hyper-reactivity in sedentary men. (Arq Bras Cardiol 2010; 95(2): 251-257)
Key words: Exercise/physiology; physical exertion; risk factors; blood pressure/physiology.
Despite the physiological pressure behavior during physical stress, it was possible to notice, in some individuals without hypertension, an even greater response in relation to the expected increase in BP. This type of blood pressure behavior has been termed blood pressure hyper-reactivity (BPH) in response to exercise3. The mechanisms suggested for the
hyper-reactive blood pressure response to exercise are not yet well defined. However, they are attributed to an increase in sympathetic autonomic stimuli or to an exaggerated response of the cardiovascular system to adrenergic stimulation and to maintenance of the diastolic function3. There was also
indication of a possible reduction in the endothelial vasodilator function as a mechanism that could contribute to the onset of high blood pressure during exercise, and which could be the link between the behavior of BPH and the worst clinical course of high blood pressure4.
On the other hand, data in the literature have demonstrated that aerobic exercise brings numerous benefits, including a reduction of 3 to 15 mmHg in SBP, in addition to a reduction in the amount of medication prescribed1,2,5-16.
Thus, the purpose of this study was to examine the effects of regular aerobic exercise on blood pressure of
Introduction
The parameters of the normal behavior of systolic blood pressure (SBP) during exercise are flexible, because several factors can modify the individual response. These factors include: age, sex, type of physical activity, emotional state and measurement method employed1. For males, the
increments between 40 and 90 mmHg in SBP are considered physiological, whereas for females, the increase between 30 and 60 mmHg is considered to be physiological. This hemodynamic response of SBP occurs during maximum dynamic exercise, such as walking or running, carried out mainly in exercise treadmill tests (ETT)1. On the other hand,
normotensive individuals with exaggerated blood pressure response during physical stress.
Methods
We selected, from a database of the Cardiology Institute of Cruz Alta, State of Rio Grande do Sul, 24 men with blood pressure hyper-reactivity to physical stress. They were distributed randomly into two groups. The first group with ten individuals, aged 45 ± 10 years, called the Experimental Group (EG), took part in an AEP. The second group, called the Control Group (CG), with 14 individuals, aged 48 ± 8 years, did not do physical exercises and remained sedentary. All patients underwent a new stress test (before the AEP) with Bruce protocol for confirmation of hyper-reactive response. This procedure was reproduced in all of them. The individuals signed an informed consent and this study was approved by CEP-ICCA-UNICRUZ: 0007/2008. The study excluded individuals diagnosed with systemic high blood pressure, with the 24-hour ABPM (Ambulatory Blood Pressure Monitoring) being used as the evaluation method, and adopting, as the criterion, the monitored SBP greater than 135 mmHg and DBP greater than 90 mmHg17.
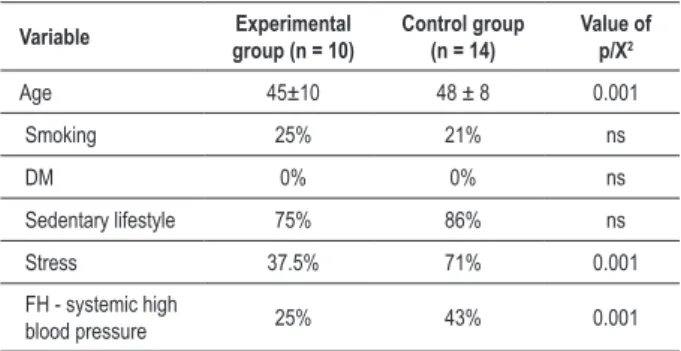
In the characterization of the 24 individuals, age and cardiovascular risk factors were taken into account. We considered that the individuals were smokers when they smoked on a daily basis, regardless of the number of cigarettes per day. We considered that the individuals were diabetics when their blood glucose levels increased on an empty stomach or two hours after eating a meal, as diagnosed by laboratory examination. We considered that an individual was sedentary when such individual did not do any scheduled regular exercise at least twice a week. Individuals were considered to be stressed when they complained of anxiety, with emotional or work overload or any prolonged tension. We also considered any family history of high blood pressure (FH-systemic blood pressure), as shown in Table 1.
The AEP comprised walking or jogging on an electric treadmill three times a week for 60 days, with duration and intensity being prescribed according to the pre-test peak VO2 of each individual.
The peak VO2 was obtained indirectly by the equation
suggested by the ACSM (2000)1, which was calculated by using
the computer program ERGO PC, version 2.2, for sedentary men. The result of each individual was used to calculate the metabolic unit, training fraction and training intensity18. After
the AEP, all individuals from both groups underwent a stress test (after the AEP), for comparing the treatment used, where we took into account the following variables:
• Anthropometric variables - Weighing was done by using a Cauduro Ltda scale, model BB, for 150 kg. The height was measured with a centimeter ruler. The BMI was calculated by using the standard formula (BMI = weight/height2). The
abdominal circumference (AC) was measured with the use of a metric tape at the height of the umbilical scar (cm).
• Hemodynamic variables of the stress test - we considered the initial (at rest), peak and final values (recovery of up to three minutes) of SBP and DBP, which were obtained by the classic method17. The heart rate was calculated by direct
electrocardiographic monitoring - we considered the initial (at rest), peak and final values (recovery).
• Exercise test variables - The total test time (TTT) was obtained by a maximal graded exercise test with Bruce protocol on an IMBRASPORT treadmill, model Classic, and by a computer program called ERGO PC, version 2.2., by MICROMED Biotecnologia Ltda. The Peak VO2 was obtained indirectly and it was corrected by computer program ERGO PC, version 2.2, for sedentary men.
The results reported were based on means and standard deviations. For parametric variables, an independent t test was used, for comparing one group to the other, a paired
t test for comparisons within the groups. For analyzing the nonparametric variables, the Kruscal-Wallis H test was carried out. The chi-square test was used for categorical variables. The differences between the groups were considered significant, at p < 0.05. For the statistical analysis, we used the program called Statistical Package for Social Sciences, version 11.5, for Windows.
Results
Table 2 illustrates the distribution of individuals in the anthropometric variables, measured before and after the AEP.
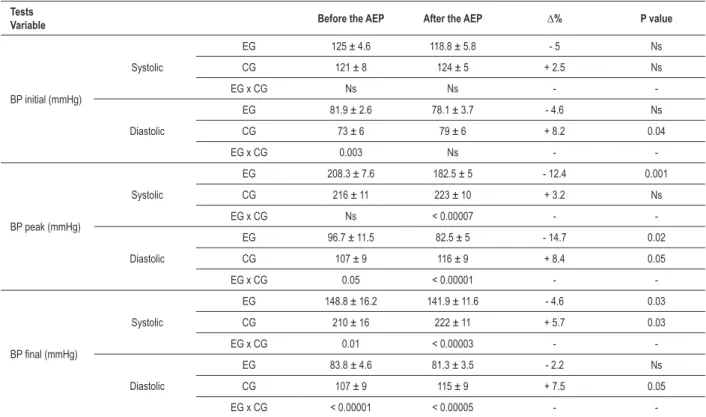
In both groups, there was no significant change in height, weight, BMI and WC variables. Table 3 illustrates the rest (initial), peak and recovery results of SBP and DBP during the exercise test, before and after the AEP in the EG and during the re-evaluation in the CG, with the respective percentage variations and the statistical significance values.
After the AEP, there was a decrease in initial SBP and DBP values in the EG, of 6.2 mmHg (-5%) and 3.8 mmHg (-4.6%), on average, respectively. As for the CG, we observed a significant increase only in the initial values of DBP, of 6 mmHg (8.2%, p <0.04), on average. When we compared data between the groups, it was possible to notice that, before the AEP, the SBP in the EG was 8.9 mmHg higher than in the CG, on average. This difference changed after the AEP.
In the EG, there was a reduction of 25.8 mmHg (-12.4%, p<0.001) in peak SBP values and 14.2 mmHg (-14.7%, p <0.02) in DBP values, on average, thereby changing the
Table 1 - Characteristics of 24 individuals with blood pressure hyper-reactivity behavior under physical stress conditions
Variable Experimental group (n = 10)
Control group (n = 14)
Value of p/X2
Age 45±10 48 ± 8 0.001
Smoking 25% 21% ns
DM 0% 0% ns
Sedentary lifestyle 75% 86% ns
Stress 37.5% 71% 0.001
FH - systemic high
blood pressure 25% 43% 0.001
Data expressed as mean (M) ± standard deviation (SD), percentage (%); DM -
Table 3 -Initial, peak and inal SBP and DBP values of the ET, before and after the AEP in hyper-reactive people
Tests
Variable Before the AEP After the AEP ∆% P value
BP initial (mmHg)
Systolic
EG 125 ± 4.6 118.8 ± 5.8 - 5 Ns
CG 121 ± 8 124 ± 5 + 2.5 Ns
EG x CG Ns Ns -
-Diastolic
EG 81.9 ± 2.6 78.1 ± 3.7 - 4.6 Ns
CG 73 ± 6 79 ± 6 + 8.2 0.04
EG x CG 0.003 Ns -
-BP peak (mmHg)
Systolic
EG 208.3 ± 7.6 182.5 ± 5 - 12.4 0.001
CG 216 ± 11 223 ± 10 + 3.2 Ns
EG x CG Ns < 0.00007 -
-Diastolic
EG 96.7 ± 11.5 82.5 ± 5 - 14.7 0.02
CG 107 ± 9 116 ± 9 + 8.4 0.05
EG x CG 0.05 < 0.00001 -
-BP inal (mmHg)
Systolic
EG 148.8 ± 16.2 141.9 ± 11.6 - 4.6 0.03
CG 210 ± 16 222 ± 11 + 5.7 0.03
EG x CG 0.01 < 0.00003 -
-Diastolic
EG 83.8 ± 4.6 81.3 ± 3.5 - 2.2 Ns
CG 107 ± 9 115 ± 9 + 7.5 0.05
EG x CG < 0.00001 < 0.00005 -
-Data expressed in M and SD (±); mmHg - millimeters of mercury; Δ% - delta percentage; BP - blood pressure; EG - experimental group; CG - control group. Table 2 - Anthropometric characteristics of the hyper-reactive
individuals before and after the AEP
Variables Groups
Before the
AEP After the AEP P value
Weight (kg)
EG 88.19 ± 11.9 87.63 ± 12.09 Ns
CG 88 ± 13 87 ± 11 Ns
(EG x CG) Ns Ns
-Height (m)
EG 1.76 ± 0.03 1.76 ± 0.03 Ns
CG 1.74 ± 0.06 1.74 ± 0.06 Ns
(EG x CG) Ns Ns
-BMI (kg/m²)
EG 28.49 ± 3.08 28.30 ± 3.16 Ns
CG 29 ± 4 28.6 ± 3.6 Ns
(EG x CG) Ns Ns
-AC (cm)
EG 95 ± 2.4 103 ± 0.8 Ns
CG 104 ± 1.2 103 ± 1 Ns
(EG x CG) Ns Ns
-Data expressed in M and SD (±); kg - kilogram; m - meters; kg/m2 - kilograms
per square meter. EG - experimental group; CG - control group; AEP - aerobic
exercise program; NS - not signiicant.
groups, it was possible to note that the peak systemic blood pressure was similar before the AEP for both groups. However, there was no significant increase in the CG, whose behavior was more hyper-reactive at the end of the study, whereas the EG’s behavior was physiological after the AEP. When we compared the peak DBP before the AEP, between the two groups, it was higher in the CG, with an increase in pressure of 9 mmHg (8.4%, p<0.05) after the AEP. The EG’s values were already lower before the AEP, and there was a significant reduction of 14.2 mmHg (-14.7%, p<0.02) after the AEP. So, the resulting behavior was within physiological limits.
On the same line of thought, when we analyzed the final pressures, there was no significant reduction in SBP or DBP in the experimental group with the AEP. Interestingly, despite the CG’s higher levels before the study, both for SBP and DBP, there was a significant increase in pressure, thereby exacerbating even more the blood pressure hyper-reactive behavior. Figure 1 illustrates the behavior of SBP and DBP before and after the AEP during the exercise test.
The initial, peak and final HR of the exercise test, before and after the AEP, as well as the other exercise variables - TTT and peak VO2 - in both groups, were similar and are shown in Table 4.
Discussion
BP is known to vary a lot, both in the course of a day and from one individual to another. And these variations are also noticed during the exercise test. The exaggerated BP response previously hyper-reactive behavior to physiological levels.
Table 4 -Initial, peak and inal HR values during ET, peak VO2 and total test time
Tests
Variable Before the AEP After the AEP ∆% P value
Initial HR (bpm)
EG 77 ± 11.2 76.4 ± 12.5 - 0.8 Ns
CG 84 ± 17 82 ± 12 - 2 Ns
EG x CG Ns Ns -
-Peak HR (bpm)
EG 166.3 ± 11.8 153.5 ± 20.9 - 7.7 Ns
CG 159 ± 13 159 ± 15 0 Ns
EG x CG Ns Ns -
-Final HR (bpm)
EG 98.1 ± 15.9 109.4 ± 14.1 11.5 Ns
CG 111 ± 17 112 ± 17 + 1 Ns
EG x CG Ns Ns -
-Peak VO2 (ml.kg -1.min-1)
EG 37 ± 7.5 41.4 ± 5.5 10.8 Ns
CG 31 ± 7 34 ± 8 8.8 Ns
EG x CG 0.03 0.01 -
-TTT (min.)
EG 10’55’’ ± 1’96’’ 11’95’’ ± 1’30’’ 11.7 Ns
CG 8’13’’ ± 2’06’’ 8’81’’ ± 2’05’’ 7.7 Ns
EG x CG Ns Ns -
-Data expressed in M and SD (±); bpm - beats per minute, HR - heart rate, peak VO2. - maximum volume of oxygen consumed; (ml.kg-1.min-1) - milliliters per kilogram per
minute; (min.) - minutes; EG - experimental group; CG - control group; D% - delta percentage; Ns - not signiicant.
to physical stress, as observed in normotensive individuals at rest, has been forming a new group of individuals with different BP response. These individuals are not classified as hypertensive, but the response of their BP in different situations is not normal, either. So, they were classified as hyper-reactive3. Little is known about the possible factors that
influence the development of or trigger this phenomenon4.
In a study conducted by Rodrígues et al19, it was suggested
that the effects of smoking are related to blood pressure hyper-reactivity. However, in our study, only 25% of the EG and 21% of the CG were smokers. Thus, this cannot be one of the factors that are responsible for this phenomenon. On
Figure 1 - SBP and DBP behavior curves of individuals with blood pressure hyper-reactivity under physical stress conditions, before and after an aerobic exercise program, during an exercise test with Bruce protocol. Pre SBP and Pre DBP - pre-training systolic blood pressure and pre-training diastolic blood pressure; Post SBP
and Post DBP - post-training systolic blood pressure and post-training diastolic blood pressure; R - resting; F - inal (recovery test).* *initial pre SBP x initial post SBP, p=0.01; † pre peak SBP x post peak SBP, p=0.001; ‡ pre inal SBP x post inal SBP, p=0.03. § pre initial DBP x post initial DBP, p=0.01; ¶ pre peak DBP x post peak DBP, p=0.03; # pre inal SBP x post inal SBP, p=ns.
Pre SBP
Post SBP
Post DBP Pre DBP
the other hand, there is no mention in the literature that giving up smoking could cause the blood pressure hyper-reactive behavior to revert to physiological levels in such individuals.
The sedentary lifestyle was found in 75% of the EG and 86% of the CG, in harmony with the study of Marsaro et al3, in
which the hyper-reactive behavior of BP, during exercise, was attributed to the fact that the subjects examined led a lifestyle that included little physical activity. However, most of the adult population is sedentary, but the behavior of the majority of such people is not hyper-reactive to exercise test. So, it is difficult to attribute this behavior to a sedentary lifestyle.
Among the individuals studied, 37% of the EG and 70% of CG were classified as stressed. In the same study conducted by Marsaro et al3, the influence of this factor on blood
pressure hyper-reactivity was noted in stress tests carried out in laboratories, such as the cold pressor test, Stroop test, mathematical calculations, dynamic and isometric exercises and 24-hour ABPM for hyper-reactive individuals. The results demonstrated a high hemodynamic response to these and other stressful stimuli during the day and greater variability of BP in ABPM. However, the influence of this factor on the blood pressure hyper-reactivity behavior in this study was impaired, since individuals were not monitored by ABPM in different stressful situations and they were not objects of this investigation. The family history of systemic high blood pressure was observed in a study with children, in which we investigated the association of this factor with higher levels of BP, thereby demonstrating that children with family history of systemic high blood pressure have higher levels of BP during stress, compared to children whose parents had normal BP20. The
same was observed in normotensive adults at rest and with family history of systemic high blood pressure. Thus, their blood pressure hyper-reactivity was higher due to physical and mental stress than among individuals without family history of systemic high blood pressure3. Thus, according to the data
mentioned, the family history of systemic high blood pressure is a strong predictor of higher levels of BP and reactivity in the event of stress. Only 25% of the EG and 43% of the CG in this study had a family history of systemic high blood pressure. However, despite this difference, due to the small sample size, it was not possible to conduct a more in-depth analysis of such findings.
As for the age factor, it was demonstrated that an exaggerated hypertensive response to exercise, in middle-aged individuals, multiplied the risk of high blood pressure by four2. In another study with younger individuals, the risk
increased 1.51 times in white individuals and 1.61 in black individuals21. However, this study was interrupted and there
was no intention of analyzing whether individuals with blood pressure hyper-reactivity could develop high blood pressure over a period of observation.
The BMI of both groups fell within in the overweight classification range (25-30 kg/m2), and in both groups, the
abdominal circumference was larger than 94 cm, reaching values that were, on average, close to the highest risk of coronary disease, since the isolated measurement of AC has proved to be sufficient to establish cardiovascular risk22. As
noted, after the AEP, there were no significant changes in the
anthropometric variables of this study, despite a significant reduction in the EG’s blood pressure levels.
In studies of our service, conducted with hypertensive individuals that did exercises, we observed a significant reduction of up to 15 mmHg in the SBP and 10 mmHg in the DBP13, but there were no changes in anthropometric
measurements after three months of exercise23. It was also
noted that most of the BP reduction, around 90%, occurred within a period that was shorter than two weeks13, an amount
of time that is insufficient to reduce weight or abdominal circumference. Thus, it was demonstrated that weight loss may contribute little to BP reduction, at least in a short period of time, with respect to the use of physical exercise as a non-pharmacological measure. In addition, it was demonstrated that there could be other mechanisms in the BP reduction, regardless of body weight and abdominal circumference23.
With respect to the hemodynamic variables, Lima et al22
conducted a study with subjects with blood pressure hyper-reactivity, evaluated by ABPM before and after a four-month-long AEP. They demonstrated that there were no significant reductions in blood pressure levels and there were significant reductions in HR. However, this study did not evaluate the pressure behavior during physical stress. In fact, on the one hand, these effects may be the result of hemodynamic mechanisms or indirect effects of metabolic and neural mechanisms that occur only under stress conditions22. Moreover, the data found in this
study demonstrated that there was a considerable reduction in blood pressure in the EG, which was not seen in the CG, which showed an increase in blood pressure hyper-reactivity. This reduction can be attributed to the physiological vasodilatation as a result of physical stress14. Moreover, this study analyzed
blood pressure values during treadmill exercise, thereby demonstrating the loss of hyper-reactivity, a fact that had not been demonstrated in the literature.
It is known that regular physical exercise can cause a reduction in resting blood pressure levels (around 15 mmHg in SBP and 7 mmHg in DBP) in hypertensive individuals, besides allowing the reduction in doses of antihypertensive drugs1,2,9-16.This hypotensive effect of exercise could be largely
explained by changes and modifications in the endothelium, however, the literature does not mention any specific results24. However, there are reports that, in healthy subjects,
exercise increases the production of endothelium-derived nitric oxide with consequent prolonged vasodilator effect on blood microcirculation25. On the other hand, there are still
doubts as to the mechanisms involved in the BP reduction in hypertensive patients after an AEP. However, there is a tendency to accept that the frequent increase in the force exerted by blood on the vascular wall leads to a continued increase in the release of nitric oxide, and then, to prolonged vasodilatation. This improvement in the endothelium-dependent vasodilator response suggests that exercise training interferes with endothelial dysfunction and, consequently, with the level of BP in hypertensive patients26,which could
somehow justify the blood pressure behavior observed in this study. However, more conclusive results about these mechanisms still need to be further demonstrated25.
endothelium and the exaggerated responses of BP during exercise. In a study conducted by Stewart et al4, it was
suggested that there may be a dysfunction of the endothelial vasodilator function, and there are mechanisms that contribute to the manifestation of hyper-reactivity during exercise, which may be one of the factors that help trigger this phenomenon in our patients. However, as such fact has not been investigated, it is not possible to prove it.
Finally, even though the peak VO2 was obtained indirectly,
to prescribe the volume and intensity of the individualized aerobic exercise training of the sample, the AEP’s effect proved to be positive, because there was an increase in the functional capacity of the myocardium, with final values that were closer to the ideal ones for the activities carried out. This demonstrated the positive effect of the program on the general physical condition of individuals that were part of the EG.
Study limitations
There was little acceptance of volunteers that participated in the aerobic exercise program. That is why the sample that received treatment was small, although the results found demonstrated a positive and beneficial effect.
Conclusion
Normotensive subjects with hyper-reactivity resulting from physical stress, who took part in a proper regular aerobic exercise program, were able to reduce extremely high blood pressure levels to physiological values. Thus, we suggest conducting further research to confirm the effect produced by the AEP on larger samples and with a more accurate methodology.
Potential Conflict of Interest
No potential conflict of interest relevant to this article was reported.
Sources of Funding
There were no external funding sources for this study.
Study Association
This article is part of the thesis of master submitted by Cleusa Maria Richter, from Universidade de Passo Fundo-RS
and Universidade de Cruz Alta-RS.
References
1. Mahler DA, Froelicher VF, Miller NH, York TD In: Kenney L, Humphrey RH, Bryant CCX. Manual do ACSM para teste de esforço e prescrição de exercícios - American College of Sports Medicine. 5ª ed. Rio de Janeiro: Revinter; 2000. p 118-121.
2. Kokkinos PF, Papademetriou V. Exercise and hipertension. Coron Artery Dis. 2000; 11: 99-102.
3. Marsaro EA, Vasquez EC, Lima EG. Avaliação da pressão arterial em indivíduos normais hiper-reatores: um estudo comparativo dos métodos de medidas e da MAPA. Arq Bras Cardiol. 1996; 67 (5): 319-24.
4. Stewart KJ, Sung J, Silber HA, Fleg JL, Keleman MD, Turner KL, et al. Exaggerated exercise blood pressure is related to impaired endothelial vasodilator function. Am J Hypertens. 2004; 17 (4): 314-20.
5. Fox EL, Bowers RW, Foss ML. Bases fisiológicas da educação física e dos desportos. 4o ed. Rio de Janeiro: Guanabara Koogan; 1991. p. 231-47.
6. Mcardle WD, Katch FI, Katch VL. Fisiologia do exercício: energia, nutrição e desempenho humano. 4º ed. Rio de Janeiro: Guanabara Koogan; 1998. p. 377-81.
7. Powers SK, Howley ET. Fisiologia do exercício: teoria e aplicação ao condicionamento e ao desempenho. 3° ed. São Paulo: Manole; 2000. p. 266-278.
8. Robergs RA, Robergs SO. Princípios fundamentais de fisiologia do exercício para aptidão, desempenho e saúde. São Paulo: Phorte; 2002. p. 148-272.
9. Viecili PRN, Bündchen DC, Richter C M, Dipp T, Lambert DB, Pereira AMR, Barbosa L C, Rubin AC, Barbosa EG, Paniga TF. Curva Dose-resposta do exercício em hipertensos: Análise do número de sessões para efeito hipotensor. Arq Bras Cardiol 2009; 92(5):393-399
10. Cornelissen VA, Fagard RH. Effects of endurance training on blood pressure, blood pressure-regulating mechanisms, and cardiovascular risk factors. Hypertension. 2005; 46: 667-75.
11. Forjaz CLM, Junior CGC, Araújo EA, Costa LAR, Teixeira L, Gomides RS. Exercício físico e hipertensão arterial: riscos e benefícios. Hipertensão. 2006; 9 (3): 104-12.
12. Dipp T, Bündchen DC, Panigas TF, Belli KC, Richter CM, Viecili PRN, et al.
Economic benefit oh physical program for hypertensive subjects: variation in cost-dose-medication. (abstract). Circulation. 2008; 117 (19): 128.
13. Bundchen DC, Panigas TF, Dipp T, Belli KC, Carvalho T, Viecili PRN, et al. The dose-response curve for exercise and blood pressure: how many sessions are needed? (abstract). Circulation. 2008; 117 (19): 131.
14. Whelton SP, Chin A, Xin X, He J. Effect of aerobic exercise on blood pressure: a meta-analysis of randomized, controlled trials. Ann Intern Med. 2002; 136: 493-503.
15. Forjaz CLM, Santaella DF, Rezende LO, Barreto ACP, Negrão CE. A duração do exercício determina a magnitude e a duração da hipotensão pós-exercício. Arq Bras Cardiol. 1998; 70 (2): 1-6.
16. Fagard RH. Exercise and the blood pressure response to dynamic physical training. Med Sci Sports Exerc. 2001; 33 (6): S484-S492.
17. Sociedade Brasileira de Cardiologia. Sociedade Brasileira de Hipertensão. Sociedade Brasileira de Nefrologia. V Diretrizes brasileiras de hipertensão arterial. Arq Bras Cardiol. 2007; 89 (3): e24-e79.
18. Leite PF. Fisiologia do exercício, ergometria e condicionamento físico. 2a ed. Rio de Janeiro: Atheneu; 1986. p. 70-4.
19. Rodrigues MB, Pinnini JJA, Leiva JG, Nuñez AJY, Urquizar MF. Reactividad cardiovascular y factores de riesgo cardiovascular en individuos normotensos del municipio de rodas, cienfuegos. Rev Esp Salud Publica. 1999; 73 (5): 577-84.
20. Alcino AB, Lipp MEN. Reactividad cardiovascular de niños em situaciones de estrés social: psicologia. [Acesso em 2009 nov 10]. Disponível em http:// www.psiquiatria.com/psicologia/vol2num2/art4.htm
21. Halpern A, Mancini MC. Tratamento farmacológico da obesidade: drogas termogênicas. Arq Bras Endocrinol Metab. 1996; 40: 224-7.
22. Lima EG, Herkenhoff F, Vasquez EC. Monitorização ambulatorial da pressão arterial em indivíduos com resposta exagerada dos níveis pressóricos em esforço: influência do condicionamento físico. Arq Bras Cardiol. 1998; 70 (4): 243-9.
pressure in hypertensive obese subjects submitted to an exercise physical program. (abstract). Circulation. 2008; 117 (19): 228.
24. Goldhammer E, Tanchilevitch A, Maor I, Beniamini Y, Rosenschein U, Savig M. Exercise training modulates cytokines activity in coronary heart disease patients. Int J Cardiol. 2005; 100 (1): 93-9.
25. Negrão CE, Santos AC, Alves MJNN. Exercício físico e endotélio. In: Luz PL, Laurindo FRM, Chagas ACP. Endotélio e doenças cardiovasculares. São Paulo: Atheneu; 2003.