Association Between Hypertension and Overweight in Adults in
Belém, State of Pará (Brazil), 2005
Hilma Paixão Borges
1, Nilma do Carmo Cruz
1, Erly Catarina Moura
1,2,3Faculdade de Nutrição - Instituto de Ciências da Saúde - Universidade Federal do Pará (UFPA)1, Belém, PA; Centro Colaborador em Alimentação e Nutrição da Região Norte (CECAN-Norte), UFPA2, Belém, PA; Núcleo de Pesquisas Epidemiológicas em Nutrição e Saúde (NUPENS) - Universidade de São Paulo (USP)3, São Paulo, SP - Brazil
Mailing address: Erly Catarina de Moura •
Avenida Generalíssimo Deodoro, 565/1103 - 66055-240 - Belém, PA - Brazil E-mail: [email protected]
Manuscript received October 10, 2007; revised manuscript received January 08, 2008; accepted January 15, 2008.
Summary
Background: Hypertension is a major public health issue affecting 20 to 25% of the global population of adults, and 12 to 35 % of Brazilians.
Objective: To evaluate the association between hypertension and overweight.
Methods: A cross-sectional study was conducted in 2005 with a probabilistic sampling of the population ≥18 years of age in Belém, capital of the state of Pará, in the Northern region of Brazil, using the telephone surveillance system for chronic diseases (SIMTEL). The dependent variable was hypertension, the explanatory variable was overweight and the confounding variables were age, level of education and lifestyle characteristics. The variables associated with hypertension were run through the regression logistic model and odds ratios were calculated for each variable.
Results: Hypertension affected 16.2% of men and 18.3% of women, and overweight affected 49.2% of men and 34.1% of women. The prevalence of hypertension was directly associated with age and overweight in both genders. Among men, hypertension was associated with intake of vegetables and low intake of beans (similar to kidney- and pinto-type beans); among women, hypertension was associated with marital status (widow or separated), and inversely to education level. The risk of hypertension increased directly with weight for both genders (p<0.001), and it was 6.33 times higher among obese men and 3.33 among obese women as compared to normal-weight subjects.
Conclusion: Overweight was associated with hypertension. However, variables such as age, education, and food consumption interfere in this relationship, creating circumstances favorable to reducing or increasing that risk. (Arq Bras Cardiol 2008;91(2):99-106)
Key words: Hipertension, obesity, adults.
sedentarism, inappropriate eating patterns and others) are considered modifiable. Among these, a direct association between hypertension and obesity and between hypertension and overweight stands out4. Gender, age and certain socioeconomic aspects are potentially confounding variables of the relationship between overweight and hypertension, since they are associated with body mass5.
A study conducted in 2006 with adult populations of Brazilian state capitals and the Federal District indicated a prevalence of 44.1% of overweight, 11.4% of these were cases of obesity, and 21.6% of the population reported having a prior medical diagnosis of hypertension6.
In this article, we studied the association between a prior medical diagnosis of hypertension and overweight, taking into account sociodemographic and lifestyle variables among the adult male and female population in the city of Belém (state of Pará).
Methods
This is a cross-sectional study using data obtained by
Introduction
The increasing prevalence of non-communicable chronic diseases among populations is well known, especially obesity and hypertension. Hypertension is a chronic disease considered a major public health problem across all socioeconomic strata1. It is estimated that at least 50 million people in the United States have high blood pressure, and Brazilian studies have shown prevalences from 12% to 35%2 in the country. Hypertension is one of the leading causes of morbidity and mortality in the world, and one of the most prevalent risk factors for the development of coronary artery disease, cerebrovascular accidents, peripheral vascular disease, renal failure, heart failure, as well as obesity3.
Arq Bras Cardiol 2008;91(2):99-106
SIMTEL (surveillance system of risk and protection factors for chronic non-communicable diseases by telephone interview) in 2005. SIMTEL was carried out in five capitals of Brazilian macro-regions and Belém was chosen to represent the Northern region. Sampling procedures used by SIMTEL-BELÉM were the same as those used in other capitals, which aimed to obtain a probabilistic sampling of the population ≥ 18 years old living in households with at least one fixed telephone line. The minimum number of interviews was established as 2,000 in order to estimate with a 95% confidence coefficient and an approximate two percentage point error the frequency of any risk factor in the study population, following the same methodology of the SIMTEL-2003 survey carried out in São Paulo7.
In the first phase of the sampling, 7.000 telephone numbers were drawn from the fixed household telephone catalogue in the city of Belém; next, these telephone lines were redrawn and divided into 20 replicas of 350 telephone lines ordered from 1 to 20, each replicas reproducing the same ratio of lines per area of the city. The second phase of the sampling consisted in the random selection of the individuals – one per telephone line – to be interviewed by the system. This phase involved the prior identification, among the lines drawn, of those that were, in fact, household telephones and were in service (eligible lines), and the agreement to participate in the survey. Up to ten phone calls were placed to each number during the first phase: on weekdays, two calls in the morning, two in the afternoon, two at night (up to 9:00 p.m.); on weekends, one on Saturday morning, one on Saturday afternoon, one on the morning of the Sunday or holiday and another in the afternoon. In the second phase, up to 10 calls were also placed on the days and times pre-set in the first phase or through later contacts. The following situations were considered as losses: telephone numbers called up to 10 times with failure to contact for confirmation of a household and selection of a household member in the first phase, or no contact made with the selected person in the second phase. In total, 3,500 telephone numbers were called, 2,918 of which were eligible (confirmed households, no answer, busy, fax or answering machine), 205 people refused to participate in the study, and 2,620 interviews were completed, e.g., an 89.9% success rate and 7.0% refusal rate.
The total SIMTEL-BELÉM database sample consisted of 2,620 individuals. For the purpose of this article, however, since it is an association study, pregnant women (23 cases), subjects who did not know their weight and height (27 cases), subjects who did not know their weight (39 cases), and those who did not know their height (179 cases) were excluded, leaving 2,352 valid cases.
The SIMTEL interview is based on a questionnaire consisting of questions on demographic and socioeconomic characteristics, eating patterns, self-reported weight and height, smoking status, alcohol bing drinking use, presence or absence of hypertension, among others.
For the purpose of this investigation, hypertension was considered as the outcome variable, and overweight was considered the explanatory variable. Hypertension was classified as Yes or No, according to prior medical diagnosis;
overweight was classified as non-overweight, preobesity and obesity, according to the body mass index (BMI) values calculated as weight in kilograms divided by the square of the height in meters, e.g., < 25 kg/m2, 25 to 29 kg/m2, and 30 kg/m2 or more, respectively8.
The other independent variables considered potentially confounders were age (classified in six age groups: 18 to 24, 25 to 34, 35 to 44, 45 to 54, 55 to 64, or 65 years of age and more), skin color (stratified in two groups: white and yellow or mulatto, light brown skin and black), schooling (stratified in four levels: 0 to 4, 5 to 8, 9 to 11, or 12 and more years of schooling), marital status (stratified in three groups: single, married or widowed and separated), regular intake of fruit and vegetables (≥ 5 times per week), beans [similar to kidney- or pinto-type beans] (≥ 5 times per week), soft drinks (≥ 3 times per week), fatty meats or chicken meat with skin, alcohol binge drinking use (> 5 doses for men and > 4 doses for women in at least one occasion in the last 30 days), and physical activity during leisure time (≥ 1 day per week) were stratified as Yes or No, and smoking status was stratified in three categories: never smoked, smoker, or ex-smoker.
The estimates of hypertension prevalence according to the independent variables were calculated separately for men and women. The variables associated with hypertension at the p<0.05 level were selected to calculate the crude odds ratio for the occurrence of hypertension in each category by logistic regression. Next, a multivariate analysis was performed for each variable adjusted for the other variables, aiming to identify the predictors of hypertension. Only the variables with p<0.05 values after the adjustment were entered into the final model in order to determine the adjusted odds ratio of hypertension, with a 95% confidence interval.
In this study, the informed consent form was replaced by a verbal consent obtained during the telephone contacts with the study population. This study was approved by the Ethics Committee of the Faculdade de Saúde Pública of the
Universidade de São Paulo.
Results
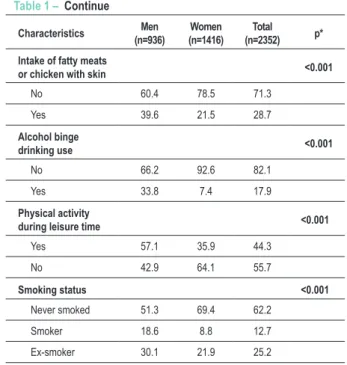
Study population consisted mostly (60.2%) of women (Table 1). There is a higher percentage of men in the youngest age group and a smaller percentage of widowed or divorced men. Men had higher frequencies of overweight, non-regular fruit and vegetable intake, regular soft drink intake, the habit of eating fatty meats or chicken with the skin, and alcohol binge drinking use. On the other hand, women had higher frequencies of non-regular intake of beans and no reference to leisure practice of physical activities. No differences were observed between genders as to skin color, schooling level, and references to hypertension. Hypertension affected approximately 17.5% of the study population, whereas preobesity and obesity affected 29.9% and 10.2%, respectively, totalizing 40.1% of the population with overweight.
Table 2 shows that, among men, the prevalence of hypertension increases directly with age; it is higher in the
Table 1 – Distribution (%) of adults (≥ 18 years of age) according
to sociodemographic characteristics, presence of hypertension, overweight, eating patterns, alcohol binge drinking use, physical activity during leisure time and smoking status, by gender
Belém, 2005
Characteristics (n=936)Men (n=1416)Women (n=2352)Total p*
Age (years) <0.001
18 to 24 23.0 15.6 18.5
25 to 34 25.9 24.6 25.1
35 to 44 21.8 23.0 22.5
45 to 54 12.7 17.2 15.4
55 to 64 8.7 10.8 9.9
≥ 65 8.0 8.8 8.5
Skin color 0.099
White or yellow 28.1 31.2 30.0
Mulatto, light brown
or black 71.9 68.8 70.0
Years of schooling 0.346
0 to 4 10.1 10.4 10.3
5 to 8 19.1 16.5 17.5
9 to 11 48.0 50.8 49.7
≥ 12 22.8 22.3 22.5
Marital status <0.001
Single 41.0 37.2 38.7
Married 52.1 46.3 48.6
Widowed or
separated 6.8 16.5 12.6
Hypertension 0.200
No 83.8 81.7 82.5
Yes 16.2 18.3 17.5
Overweight <0.001
No overweight 50.7 66.0 59.9
Preobesity 37.9 24.6 29.9
Obesity 11.3 9.5 10.2 Regular intake of
fruit and vegetables <0.001
Yes 15.1 22.5 19.6
No 84.9 77.5 80.4
Regular intake of
beans <0.001
Yes 52.5 32.7 40.6
No 47.5 67.3 59.4
Regular intake of
soft drinks <0.001
No 57.6 75.8 68.5
Yes 42.4 24.2 31.5
Table 1 – Continue
Characteristics (n=936)Men (n=1416)Women (n=2352)Total p*
Intake of fatty meats
or chicken with skin <0.001
No 60.4 78.5 71.3
Yes 39.6 21.5 28.7
Alcohol binge
drinking use <0.001
No 66.2 92.6 82.1
Yes 33.8 7.4 17.9
Physical activity
during leisure time <0.001
Yes 57.1 35.9 44.3
No 42.9 64.1 55.7
Smoking status <0.001
Never smoked 51.3 69.4 62.2
Smoker 18.6 8.8 12.7
Ex-smoker 30.1 21.9 25.2
* Comparison between genders as per the chi-square test.
group with less schooling, it decreases with the increase in years of schooling up to the range corresponding to high school, and increases again among people with more years of schooling. Hypertension also increases directly with weight, affecting 42.5% of obese subjects. Hypertension is higher among widowed and separated people than among married people, and it is higher among those who are married than among single subjects.
Hypertension was greater among those who regularly ate fruit and vegetables, and for those who did not regularly eat beans or have soft drinks.
It was also greater among those who had once experimented tobacco smoking, especially ex-smokers. Among women, hypertension also increased with age, diminished with schooling and increased with weight, and affecting 41.0% of obese women. It was greater among widowed and separated women than among married women, and it was also greater among married women than among single women. It was greater with regular intake of fruit and vegetables, with the non-habit of consuming fatty meats or chicken meat with skin, and with the no alcohol binge drinking use and smoking, especially ex-smokers.
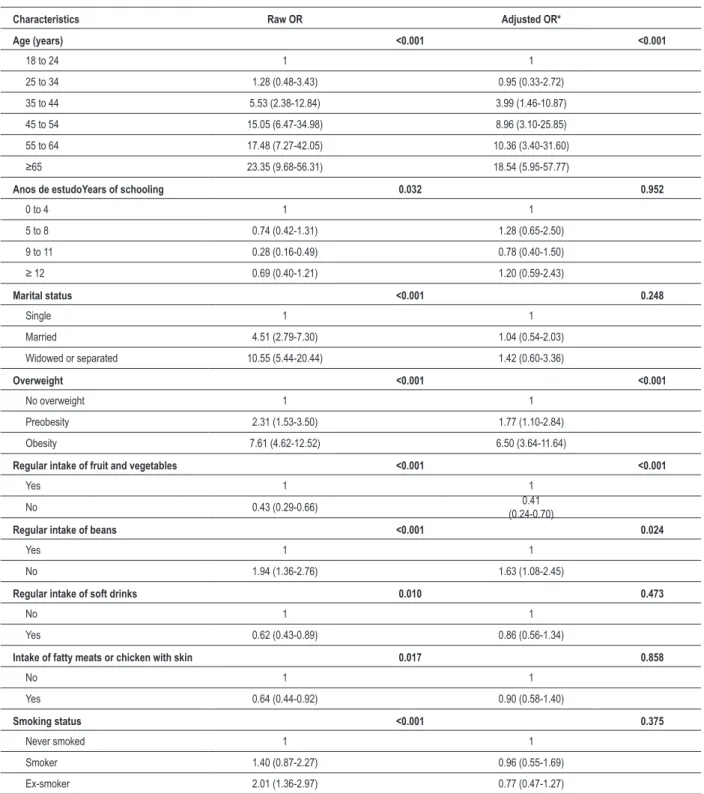
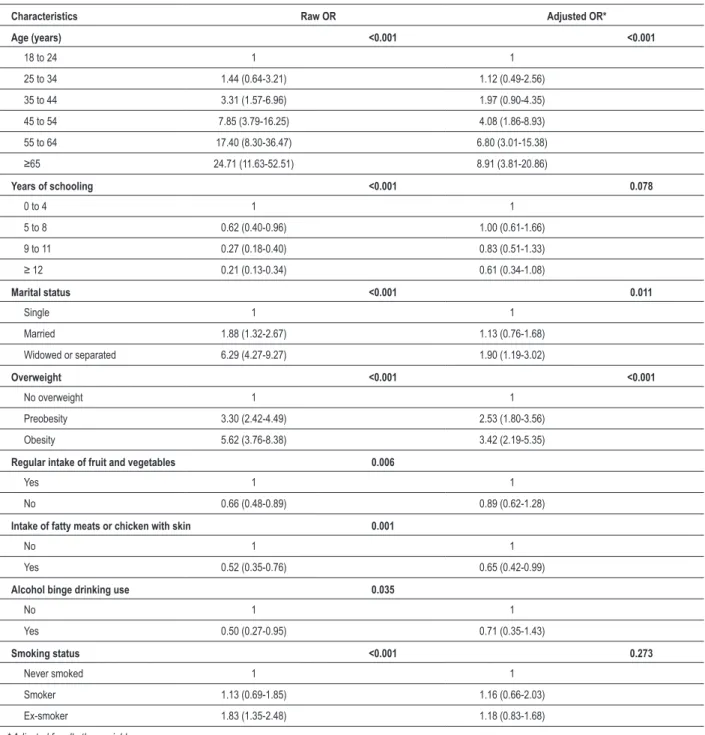
Logistic regression showed that, among men, only age, overweight, intake of fruit and vegetables, and intake of beans remained associated with hypertension after adjustments for the other variables (Table 3). Among women, the variables that remained in the model were age, marital status, and overweight (Table 4).
Arq Bras Cardiol 2008;91(2):99-106 Table 2 – Prevalence (%) of hypertension among adults (≥ 18 years
of age) according to sociodemographic characteristics, overweight, eating patterns, alcohol binge drinking use, physical activity during
leisure time and smoking status, per gender - Belém, 2005
Characteristics Men % pp Women % pp
Age (years) <0.001 <0.001
18 to 24 3.3 4.1
25 to 34 4.1 5.7
35 to 44 15.7 12.3
45 to 54 33.6 25.0
55 to 64 37.0 42.5
≥65 44.0 51.2
CorSkin color 0.087 0.613
White or yellow 19.5 19.0
Mulatto, light
brown, black 14.9 17.9
Years ooling <0.001 <0.001
0 to 4 27.4 38.1
5 to 8 21.8 27.5
9 to 11 9.6 14.3
≥ 12 20.7 11.4
Marital status <0.001 <0.001
Single 5.7 9.9
Married 21.5 17.1
Widowed or
separated 39.1 40.8
Overweight <0.001 <0.001
No overweight 8.8 11.0
Preobesity 18.3 29.0
Obesity 42.5 41.0 Regular intake of
fruit and vegetables <0.001 0.006
Yes 27.7 23.5
No 14.2 16.8
Regular intake of
beans <0.001 0.087
Yes 12.0 15.8
No 20.9 19.5
Regular intake of
soft drinks 0.009 0.161
No 18.9 19.1
Yes 12.6 15.7
Intake of fatty meats or chicken with skin
0.016 0.001
No 18.6 20.1
Yes 12.7 11.5
Table 2 – Continue
Alcohol binge
drinking use 0.170 0.031
No 17.4 18.9
Yes 13.9 10.5
Active during
leisure time 0.119 0.083
Yes 14.6 20.7
No 18.4 17.0
Smoking status 0.002 <0.001
Never smoked 12.5 16.0
Smoker 16.7 17.7
Ex-smoker 22.3 25.8
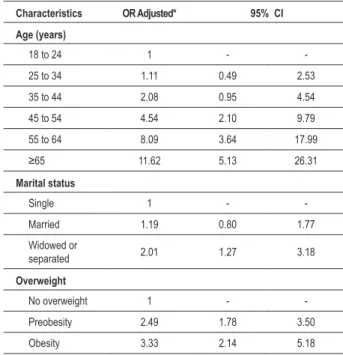
increased risk of hypertension starting at the age of 35, an increase of 80% in the risk for those with a BMI between 25 and 29 kg/m2, and a 533% for those with a BMI equal to or greater than 30 kg/m2, a reduction of 40% for those who did not regularly eat fruit and vegetables, and 69% for those who did not regularly eat beans (Table 5). Among women, the risk of hypertension increased with age after the age of 45, increased 27% for widows or divorcées, and 87% with a BMI between 25 and 29 kg/m2 and 114% among women with a BMI equal to or greater than 30 kg/m2 (Table 6). For both genders, overweight proved to be the best predictor of hypertension with a potential for modification.
Discussion
The aim of this study was to assess the association between hypertension and overweight. Medical diagnosis of hypertension was reported by 17.5% of the study population. In a population-based study conducted in 2003 through house calls in Belém, 18% of the population aged 25 years and more reported having been diagnosed with hypertension, 15% men and 19% women9. In 2006, in another population-based study conducted in Belém, data obtained through telephone calls showed that 16.1% of men and 21.2% of women had hypertension6. Our study indicated 16.2% of hypertension among men and 18.3% among women, values which are similar to those reported in the two studies cited above considering the confidence interval.
We observed a direct association between prevalence of hypertension and age, in accordance with other studies5,10-15. Regarding schooling, there was an inverse association with the prevalence of hypertension, which is in agreement with the results obtained in several studies12,15-17.
Marital status also proved to be associated with the prevalence of hypertension: widowed or separated and married individuals had greater prevalences compared to single individuals. Similar data were reported by another study15, where single women showed a lower prevalence of hypertension. According to Sawyer et al18,the presence of a partner or stable family ties is associated with access to
Table 3 - Odds Ratio (OR) and 95% conidence interval of hypertension among men (≥ 18 years of age) according to sociodemographic characteristics, overweight, eating patterns, alcohol binge drinking use, physical activity during leisure time and smoking status. Belém, 2005
Characteristics Raw OR Adjusted OR*
Age (years) <0.001 <0.001
18 to 24 1 1
25 to 34 1.28 (0.48-3.43) 0.95 (0.33-2.72)
35 to 44 5.53 (2.38-12.84) 3.99 (1.46-10.87)
45 to 54 15.05 (6.47-34.98) 8.96 (3.10-25.85)
55 to 64 17.48 (7.27-42.05) 10.36 (3.40-31.60)
≥65 23.35 (9.68-56.31) 18.54 (5.95-57.77)
Anos de estudoYears of schooling 0.032 0.952
0 to 4 1 1
5 to 8 0.74 (0.42-1.31) 1.28 (0.65-2.50)
9 to 11 0.28 (0.16-0.49) 0.78 (0.40-1.50)
≥ 12 0.69 (0.40-1.21) 1.20 (0.59-2.43)
Marital status <0.001 0.248
Single 1 1
Married 4.51 (2.79-7.30) 1.04 (0.54-2.03)
Widowed or separated 10.55 (5.44-20.44) 1.42 (0.60-3.36)
Overweight <0.001 <0.001
No overweight 1 1
Preobesity 2.31 (1.53-3.50) 1.77 (1.10-2.84) Obesity 7.61 (4.62-12.52) 6.50 (3.64-11.64)
Regular intake of fruit and vegetables <0.001 <0.001
Yes 1 1
No 0.43 (0.29-0.66) (0.24-0.70)0.41
Regular intake of beans <0.001 0.024
Yes 1 1
No 1.94 (1.36-2.76) 1.63 (1.08-2.45)
Regular intake of soft drinks 0.010 0.473
No 1 1
Yes 0.62 (0.43-0.89) 0.86 (0.56-1.34)
Intake of fatty meats or chicken with skin 0.017 0.858
No 1 1
Yes 0.64 (0.44-0.92) 0.90 (0.58-1.40)
Smoking status <0.001 0.375
Never smoked 1 1
Smoker 1.40 (0.87-2.27) 0.96 (0.55-1.69) Ex-smoker 2.01 (1.36-2.97) 0.77 (0.47-1.27)
* Adjusted for all other variables.
health care services and, consequently, a greater likelihood of having hypertension diagnosed, which would justify the greater prevalence of hypertension among these subjects. Marital status is also associated with age, which is associated with hypertension, e.g., widowed or separated persons tend to
be older and more prone to hypertension, thus representing a confounder variable. After adjustments for age, marital status lost its association with hypertension among men, although it remained among women.
Arq Bras Cardiol XXXX; XX(X) : XXX-XXX Table 4 - Odds Ratio (OR) and 95% conidence interval of hypertension among women (≥ 18 years of age) according to sociodemographic characteristics, overweight, eating patterns, alcohol binge drinking use, physical activity during leisure time and smoking status - Belém, 2005
Characteristics Raw OR Adjusted OR*
Age (years) <0.001 <0.001
18 to 24 1 1
25 to 34 1.44 (0.64-3.21) 1.12 (0.49-2.56)
35 to 44 3.31 (1.57-6.96) 1.97 (0.90-4.35)
45 to 54 7.85 (3.79-16.25) 4.08 (1.86-8.93)
55 to 64 17.40 (8.30-36.47) 6.80 (3.01-15.38)
≥65 24.71 (11.63-52.51) 8.91 (3.81-20.86)
Years of schooling <0.001 0.078
0 to 4 1 1
5 to 8 0.62 (0.40-0.96) 1.00 (0.61-1.66)
9 to 11 0.27 (0.18-0.40) 0.83 (0.51-1.33)
≥ 12 0.21 (0.13-0.34) 0.61 (0.34-1.08)
Marital status <0.001 0.011
Single 1 1
Married 1.88 (1.32-2.67) 1.13 (0.76-1.68)
Widowed or separated 6.29 (4.27-9.27) 1.90 (1.19-3.02)
Overweight <0.001 <0.001
No overweight 1 1
Preobesity 3.30 (2.42-4.49) 2.53 (1.80-3.56) Obesity 5.62 (3.76-8.38) 3.42 (2.19-5.35)
Regular intake of fruit and vegetables 0.006
Yes 1 1
No 0.66 (0.48-0.89) 0.89 (0.62-1.28)
Intake of fatty meats or chicken with skin 0.001
No 1 1
Yes 0.52 (0.35-0.76) 0.65 (0.42-0.99)
Alcohol binge drinking use 0.035
No 1 1
Yes 0.50 (0.27-0.95) 0.71 (0.35-1.43)
Smoking status <0.001 0.273
Never smoked 1 1
Smoker 1.13 (0.69-1.85) 1.16 (0.66-2.03) Ex-smoker 1.83 (1.35-2.48) 1.18 (0.83-1.68)
* Adjusted for all other variables.
of hypertension among individuals who were overweight, as had already been reported in other studies5,19-21.
The association between eating patterns and overweight is well-known22, in addition to its consequent and possible correlation with hypertension. Among the men in this study, the lack of regular intake of beans and the regular intake of fruit and vegetables was associated with hypertension. In the community studied, beans are a regular part of homemade meals, reflecting a greater concern with health,
whereas only 15% of men are used to eating fruit and vegetables. This can be considered a reverse causality variable, e.g., hypertensive subjects began to eat greater quantities of these foods in an attempt to improve their health status. One of the known recommendations given to hypertensive patients is a balanced diet that includes greater amounts of fruit and vegetables than the patient would normally eat.
Regarding smoking , an indirect association with
Table 6 - Odds Ratio (OR) of hypertension among women (≥ 18 years of age) according to age, marital status and overweight - Belém, 2005
Characteristics OR Adjusted* 95% CI
Age (years)
18 to 24 1 -
-25 to 34 1.11 0.49 2.53
35 to 44 2.08 0.95 4.54
45 to 54 4.54 2.10 9.79
55 to 64 8.09 3.64 17.99
≥65 11.62 5.13 26.31
Marital status
Single 1 -
-Married 1.19 0.80 1.77
Widowed or
separated 2.01 1.27 3.18
Overweight
No overweight 1 -
-Preobesity 2.49 1.78 3.50
Obesity 3.33 2.14 5.18
* Adjusted for all other variables.
Table 5 - Odds Ratio (OR) of hypertension among men (≥ 18 years
of age) according to age, overweight, intake of fruit and vegetables
and intake of beans - Belém, 2005
Characteristics OR Adjusted* 95% CI
Age (years)
18 to 24 1 -
-25 to 34 1.04 0.38 2.86
35 to 44 4.52 1.89 10.82
45 to 54 10.69 4.45 25.70
55 to 64 12.92 5.16 32.33
≥65 21.34 8.59 53.06
Overweight
No overweight 1 -
-Preobesity 1.80 1.14 2.85
Obesity 6.33 3.58 11.17 Regular intake of fruits and vegetables
Yes 1 -
-No 0.40 0.25 0.66
Regular intake of beans
Yes 1 -
-No 1.69 1.13 2.53
* Adjusted for all other variables.
hypertension was observed, in which ex-smokers had a greater prevalence of hypertension as compared to smokers or to those who had never smoked. Costa et al23 also observed a greater prevalence of hypertension among ex-smokers. A study conducted by Jardim et al24 reported a positive association between hypertension and discontinued smoking (ex-smokers); however, the greatest prevalence was observed among non-smokers. In a study conducted by Barreto et al25, a greater prevalence of hypertension was observed among those who had never smoked, followed by smokers and ex-smokers, respectively. Lessa et al12 reported a greater prevalence of hypertension among non-smokers as compared to smokers.
After adjustments for the study variables, we observed that age and overweight remained associated with hypertension for both genders; the intake of fruit, vegetables and beans remained associated only for men, and marital status only for women. Taking into consideration overweight as the explanatory variable and all others as the confounder variables, we found a risk of 1.8 for hypertension among men and of 2.49 among women in preobesity and of 6.33 and 3.33, respectively, for both genders in obesity. In the population of Fortaleza, the risk equal to 2.04 and 4.08 was found, respectively for the same anthropometric strata, independently of gender5. In Bambuí, state of Minas Gerais, the odds ratio for hypertension for overweight individuals was 2.82, and for the obese, 4.29, after adjustments for
gender, age, schooling, smoking status and physical activity25. According to data from the National Health and Examination Survey, the prevalence of hypertension among overweight individuals is 2.9 times that of eutrophic subjects26. Considering both genders, our data show a 2.16 odds ratio in preobesity and 4.26 in obesity, similar to what had been described earlier. It is noteworthy that the odds ratio was used as a proxy for the prevalence ratio, which is the most adequate measurement for transversal studies such as ours, despite the risk of overestimating values, significance, and direction of associations are normally maintained.
It is also noteworthy that although the instrument used to collect data (telephone survey) in this study was not the same as that used in the studies discussed, our study can be considered reliable, since the telephone fixed service reaches a high percentage of the population in Belém6, which lead us to conclude that the sample was representative of the population. However, the prevalence of hypertension found need to be carefully evaluated, as it reflects mainly the access to healthcare services and not the prevalence of the disease.
Arq Bras Cardiol XXXX; XX(X) : XXX-XXX
References
1. World Health Organization. Diet, nutrition and prevention of chronic diseases. Report FAO/WHO Expert Consulation. Geneva: WHO; 2003. (WHO Technical Report Series 916).
2. Brandão AP, Brandão AA, Magalhães MEC, Pozzan R. Epidemiologia da hipertensão arterial. Rev Soc Cardiol Estado de São Paulo. 2003; 13 (1): 7-19.
3. Andrade JP, Vilas-Boas F,Chagas H, Andrade M. Aspectos epidemiológicos da aderência ao tratamento da hipertensão arterial sistêmica. Arq Bras Cardiol. 2002; 79 (4): 375-83.
4. Gus M, Fuchs SC, Moreira LB, Wiehe M, Silva AF, Albers F, et al. Association between different measurements of obesity and the incidence of hypertension. Am J Hypertens. 2004; 17: 50-3.
5. Feijão AMM, Gadelha FV, Bezerra AA, Oliveira AM de, Silva MSS, Lima JWO. Prevalência de excesso de peso e hipertensão arterial, em população urbana de baixa renda. Arq Bras Cardiol. 2005; 84 (1): 29-33.
6. Ministério da Saúde. Vigilância de Fatores de Risco e Proteção para Doenças Crônicas por Inquérito Telefônico. Brasília, 2007.
7. Monteiro CA, Moura EC, Jaime PC, Lucca A, Florindo AA, Figueiredo ICR, et al. Monitoramento de fatores de risco para doenças crônicas por entrevistas telefônicas. Rev Saúde Pública. 2005; 39 (1): 47-57.
8. World Health Organization [WHO]. Obesity: preventing and managing the global epidemic. Report of a WHO Consultation on Obesity. Geneva: WHO; 2000. (WHO Technical Report Series 894).
9. Ministério da Saúde. Inquérito domiciliar sobre comportamentos de risco e morbidade referida de doenças e agravos não transmissíveis: Brasil, 15 capitais e Distrito Federal, 2002-2003. Rio de Janeiro: INCA, 2004.
10. Gus I, Fischmann A, Medina C. Prevalência dos fatores de risco da doença arterial coronariana no Estado do Rio Grande do Sul. Arq Bras Cardiol. 2002; 78 (5): 478-83.
11. Sabry MOD, Sampaio HAC, Silva MGC. Hipertensão e obesidade em um grupo populacional no Nordeste do Brasil. Rev Nutr. 2002; 15 (2): 139-47.
12. Lessa I, Magalhães L, Araújo MJ, Almeida Fº N, Aquino E, Oliveira MMC. Hipertensão arterial na população adulta de Salvador (BA). Arq Bras Cardiol. 2006; 87 (6): 747-56.
13. Wang W, Lee ET, Fabsitz RR, Devereux R, Best L, Welty TK, et al. A longitudinal study of hypertension risk factors and their ralation to cardiovascular disease: the strong heart study. Hypertension. 2006; 47: 403-9.
14. Drukteinis JS, Roman MJ, Fabsitz RR, Lee ET, Best LG, Russel M, et al. Cardiac and systemic hemodinamic characteristics of hypertension and
prehypertension in adolescents and young adults: the strong heart study. Circulation. 2007; 16: 221-7.
15. Hartmann M, Dias-da-Costa JS, Olinto MTA, Pattussi MP, Tramontini A. Prevalência de hipertensão arterial sistêmica e fatores associados: um estudo de base populacional em mulheres no sul do Brasil. Cad Saúde Pública. 2007; 23 (8): 1857-66.
16. Santos ZMSA, Silva RM, Becker SLM. Avaliação do índice de massa corporal (IMC) em mulheres hipertensas. RBPS. 2003; 16 (1/2): 34-8.
17. Gus I, Harzheim E, Zaslavsky C, Medina C, Gus M. Prevalência, reconhecimento e controle da hipertensão arterial sistêmica no Estado do Rio Grande do Sul. Arq Bras Cardiol. 2004; 83: 424-8.
18. Sawyer DO, Leite IC. Alexandrino R. Perfis de utilização de serviços de saúde no Brasil. Cadernos Saúde Coletiva. Rio de Janeiro. 2002; 71: 757-76.
19. Lerario DDG, Gimeno SG, Franco LJ, Iunes M, Ferreira SRG e Grupo de Estudo de Diabetes na Comunidade Nipo-Brasileira, São Paulo, Brasil. Excesso de peso e gordura abdominal para a síndrome metabólica em nipo-brasileiros. Rev Saúde Pública. 2002; 36 (1): 4-11.
20. Carneiro G, Faria NA, Ribeiro Fº F, Guimarães A, Lerario D, Ferreira SRG, et al. Influência da distribuição da gordura corporal sobre a prevalência de hipertensão arterial e outros fatores de risco cardiovascular em indivíduos obesos. Rev Assoc Med Bras. 2003; 49 (3): 306-11.
21. Souza ARA, Costa A, Nakamura D, Mocheti LN, Stevenato Fº PR, Ovando LA. Um estudo sobre hipertensão arterial sistêmica na cidade de Campo Grande, MS. Arq Bras Cardiol. 2007; 88 (4): 441-6.
22. Sichieri R. Dietary patterns and their associations with obesity en the Brazilian city of Rio de Janeiro. Obesity Research. 2002; 10 (1): 42-9.
23. Costa JSD, Barcellos FC, Sclowitz ML, Sclowitz IKT, Castanheira M, Olinto MT, et al. Prevalência de hipertensão arterial em adultos e fatores associados: um estudo de base populacional urbana em Pelotas, Rio Grande do Sul, Brasil. Arq Bras Cardiol. 2007; 88 (1): 59-65.
24. Jardim PCBV, Gondim MRP, Monego ET, Moreira HG, Vitorino PVO, Souza WKSB, et al. Hipertensão arterial e alguns fatores de risco em uma capital brasileira. Arq Bras Cardiol. 2007; 88 (4): 452-7.
25. Barreto SM, Passos VMA, Firmo JOA, Guerra HL, Vidigal PG, Lima-Costa MFF. Hypertension and clustering of cardiovascular risk factors in a community in southeast Brazil-The Bambui Health and Ageing Study. Arq Bras Cardiol. 2001; 77: 576-81.
26. Van Itallie TB. Health implications of overweight and obesity in the United States. Ann Int Med. 1985; 103: 983-8.
Potential Conflict of Interest
I hereby declare that there are no any potential conflicts of interests involving this study.
Sources of Funding
This study has been partially funded by Edital CT-Saúde/
MCT/MS/CNPq number 30/2004.
Study Association
This article is part of the academic thesis by Hilma Paixão Borges and Nilma do Carmo Cruz, from Faculdade de Nutrição do Instituto de Ciências da Saúde da Universidade Federal do Pará.