ENERGY AND MASS TRANSFER PARAMETERS IN A BRAZILIAN SEMI-ARID
ECOSYSTEM UNDER DIFFERENT THERMOHYDROLOGICAL CONDITIONS
ANTÔNIO HERIBERTO DE CASTRO TEIXEIRA, RICARDO GUIMARÃES ANDRADE,
JANICE FREITAS LEIVAS
Embrapa Satellite Monitoring, Campinas, São Paulo, Brazil
[email protected], [email protected], [email protected]
Received July 2014 - Accepted March 2015
ABSTRACT
In the Brazilian semi-arid region, the natural vegetation (“Caatinga”) has been replaced by irrigated agriculture, emphasising the importance for quantiication of the energy and mass exchanges. Eddy covariance and micro-climatic measurements in this natural ecosystem, were analysed for two years under different thermohydrological conditions. Sensible heat lux (H) accounted for 49 and 64% of the net radiation (Rn), respectively, during the wetter and the drier conditions of 2004 and 2005. The corresponding fractions of Rn partitioned as latent heat lux (LE) were 40% and 25%. Evapotranspiration (ET) in 2004, with 693 mm, represented 96% of precipitation (P), while in 2005 (399 mm), it was 18% higher than P, which evidenced the use of the remaining soil moisture from the previous wetter year. All the soil-water-vegetation-atmosphere transfer parameters were inluenced by the rainfall amounts. However, the surface resistance (rs) was the most strongly affected by the soil moisture status, dropping with increases of the ratio of ET to reference evapotranspiration (ET0). On the other hand, the highest rs values were related to increases in both vapour pressure deicit (De) and aerodynamic temperature (T0). The current research aimed to quantify the energy and mass exchange between the “Caatinga” and the lower atmosphere, testing in which circumstances the biophysical controlling parameters can be reasonably predicted from agrometeorological data, throughout parameterizations, to incorporate in large-scale models.
Keywords: energy balance; roughness parameters; modelling; “Caatinga”.
RESUMO: PARÂMETROS DE TRANSFERÊNCIA DE ENERGIA E MASSA EM ECOSSISTEMA
DO SEMIÁRIDO BRASILEIRO SOB DIFERENTES CONDIÇÕES TERMO HIDROLÓGICAS Na região semiárida brasileira, a vegetação natural (Caatinga) tem sido substituída pela agricultura irrigada, enfatizando a importância da quantiicação das trocas de massa e de energia. Medições microclimáticas e das correlações turbulentas no ecossistema Caatinga, foram analisadas para dois anos, envolvendo diferentes condições termo hidrológicas. O luxo de calor sensível (H) representou 49 e 64% do saldo de radiação (Rn), respectivamente durante as condições mais úmidas e mais secas de 2004 e 2005. As frações correspondentes de Rn para o luxo de calor latente (LE) foram de 40% e 25%. A evapotranspiração (ET) em 2004, com 693 mm, representou 96% da precipitação (P), enquanto que em 2005 (399 mm), foi 18% maior que P, evidenciando o uso da umidade do solo remanescente do ano anterior mais úmido. Todos os parâmetros de transferência das relações solo-água-vegetação-atmosfera analisados foram inluenciados pela quantidade de chuvas. Entretanto, a resistência da superfície (rs) foi o mais fortemente afetado pelas condições de umidade do solo, sendo reduzida com o aumento da razão da ET para a evapotranspiração de referência (ET0). Por outro lado, os valores mais elevados de rs foram relacionados com elevações em ambos, do déicit de pressão do vapor (De) e da temperatura aerodinâmica (T0). A pesquisa corrente objetivou a quantiicação das trocas de energia e massa entre a Caatinga e a baixa atmosfera, testando em que circunstâncias os parâmetros
biofísicos de controle deste processo podem ser estimados razoavelmente com parametrizações através de dados agrometeorológicos, para incorporação em modelos de larga escala.
1. INTRODUCTION
In arid and semi-arid regions, actual evapotranspiration (ET) from vegetated surfaces dominates the water luxes, which accounts for more than 90% of rainfall (Wang et al., 2004, Huxman et al., 2005, Sun et al., 2010). However, climate and land use changes in these environments will affect the large-scale energy and water balances due to alterations in species composition, vegetation cover and soil moisture (Wu and Archer, 2005; Zhang and Schilling, 2006, Lu et al., 2011), bringing the importance for quantiication of the energy balance components. These components can be quantiied by analysing the available energy, the gradients of air temperature or/and air humidity, and the aerodynamic and surface resistance (Gash and Shuttleworth, 2007).
Energy balance methods can be applied at specific sites by using ield measurements, but it becomes increasingly important to assess the surface luxes on large scales (Timouk et al., 2009). They are used for solving practical questions relating to environmental sciences such as hydrology, meteorology and agronomy. In meteorology, they allow to model land-surface-atmosphere interactions, leading to weather forecasts that are more reliable to detect effects of climate and land use changes on rainfall, which in turn inluence desertiication (Oyama and Nobre, 2004).
Eddy covariance (EC) systems, became a standard field method, despite the general problem of the lack of energy balance closure (Lu et al., 2011; Zhang et al., 2012; Kessomkiat et al., 2013). An additional dificult is the use of point measurements, which provide lux values for speciic sites (Tanaka et al., 2008), because they may not be representative of the entire area of interest (Teixeira et al., 2014). However, meteorology demands reliable ield data, serving as a ground truth for large-scale models, being important to improve the parameterizations, including the exchanges of momentum, energy and water vapour between the vegetated surface and the atmosphere (Anderson et al., 2012; Teixeira et al., 2014).
According to Mulligan (2004), to model the exchange processes between the vegetation and the atmosphere in semi-arid regions, it is indispensable to consider the different effects that may occur during wet periods and those that involve long water stress. The soil water state determines these processes largely (Xue et al., 2004). It has been shown that meso-scale
moisture heterogeneity greatly inluences the atmospheric
boundary layer and thermodynamics, meso-scale circulations, and conversion triggering and intensity (LeMone et al., 2007). Modelling studies have suggested that surface heterogeneity potentially has an effect on rainfall in the tropics
(Avissar et al., 2004). The feedback between climate and land
use changes and the variability of the surface radiation and
energy balances in semi-arid regions, is still poorly understood. Several studies on the turbulent transports above and within crop canopies have been done in irrigated crops (e.g. Kounouhéwa et al., 2013; Teixeira et al., 2014); however, fewer ones have examined these processes within the Brazilian natural ecosystems under different thermohydrological conditions (e.g. Hayashi et al, 2002; Silans and Silva, 2007).
More insights are needed into the considerable inluence
of natural ecosystems on circulation at different spatial and temporal scales. Previous studies in Brazilian semi-arid region
have used ield measurements in irrigated crops and natural
vegetation to calibrate and validate remote sensing methods based on the Penman-Monteith equation (Teixeira, 2010). However, the data set for “Caatinga”, comprising different thermohydrological conditions, has not been in-depth explored.
Even the “Caatinga” ecosystem being heterogeneous both vertically and horizontally, it has an expressive potential for development of rural productivity activities, despite the low amounts of precipitation in the Brazilian semi-arid region (Costa et al., 2009). Oyama and Nobre (2004) demonstrated, however, through global circulation models that changes in this natural
ecosystem have caused desertiication, demanding more study
about the effect of these changes on the energy and water balances. In “Caatinga” ecosystem, the dry period is characterized by senescent vegetation, with some of the species losing their leaves in the dry season while others storing water in special organs. However, as soon as the rainy season starts, the plants develop rapidly, with the water consumption sometimes being higher than that for the surrounded introduced irrigated crops. This dynamic depend on the thermohydrological conditions for a speciic year, which affects phenology and biomass production. The feedback between the weather conditions and the variability of the surface energy balance in the “Caatinga” ecosystem is still poorly understood, despite that its seasonal dynamics and diurnal variations are known to play a major role in the water cycle on large scales. Surface albedo changes with moisture and vegetation conditions directly affect the the energy partition and then precipitation (Kounouhéwa et al., 2013). There is a need to understand and quantify these processes, which control the surface luxes, as well to evaluate land surface models.
throughout parameterizations aiming the use of large-scale models applicable to the Brazilian semi-arid region. Variations of the energy fluxes are described from observation data for a unusual wetter year of 2004 and for the year 2005 with precipitation amounts bellow the long-term average.
2. MATERIALS AND METHODS
2.1 Study site description
The study site was a natural vegetation called “Caatinga”,
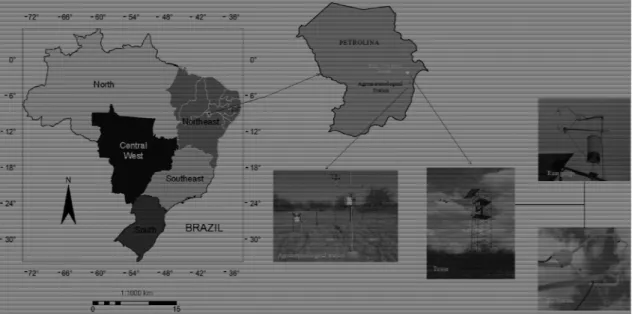
with the lux tower located at the municipality of Petrolina (9º03ꞌ S; 40º19ꞌ W; elevation 375 m), Pernambuco (PE) State, in the
semi-arid region of Northeast Brazil (Figure 1).
According to Teixeira (2009), in the Brazilian semi-arid region, disturbed currents from the South, North, East and West inluence the climatology. Excluding the places of high altitude, all areas present long-term annual air temperatures (Ta) larger than 24 °C. The average maximum is 33 °C and the average minimum is 19 °C. The warmest months are October and November when the sun is near the zenith position with low cloud cover and the coldest ones are June and July at the winter solstice in the South hemisphere.
The thermal homogeneity strongly contrasts with the spatial and temporal heterogeneity of the rainfall regime. Most precipitation fall during the irst four months of the year, accounting for 68% of the annual precipitation, which presents a long-term (50 years) value of 570 mm yr-1. The sandy soil is
classiied as Latossoil Red-Yellow with low retention capacity,
with the groundwater depth around 2.5 m.
Figure 1 - Location of the study region at Petrolina municipality, Pernambuco (PE) State, Northeast Brazil. Highlights are given for the eddy covariance (EC) system in “Caatinga” and the agrometeorological station close to the experimental area.
2.2 Vegetation type and dataset
The geographic domain of “Caatinga” occupies an area of around 750,000 km2, which corresponds to 54% of the Brazilian Northeast and 11% of the country (Alves et al., 2008). This type of semi-arid natural ecosystem is deined as bushes that possess small leaves or thorns. The dry period is characterized by senescent vegetation, however, as soon as the rainy season starts, the plants rapidly turn green. It is a mixture of different species and the more frequent ones are Caesalpinia microphylla Mart., Manihot pseudoglaziovii Pax et. K Hoffman, Croton conduplicatus Kunth and Sapium lanceolatum. Some of them lose their leaves in the dry season and others store water. The plants are adapted to tolerate water stress, under environmental constraints, which increases rainfall use eficiency (Teixeira, 2009).
Data sets from an Eddy Covariance (EC) system together with other microclimate measurements during 2004 and 2005 were used, involving different rainfall conditions (720 mm yr-1 and 340 mm yr-1, respectively). Simultaneously, the reference evapotranspiration (ET0) (Allen et al. 1998) was acquired from
an automatic agro-meteorological station (9º08ꞌ S; 40º18ꞌ W;
elevation 375 m) (see Figure 1). Although, the station being
around 9 km from the experimental site, the study region is very lat and the ET0 data is referred to a hypothetical grassed reference surface.
CSAT3, Campbell Scientiic, Logan, UT) to determine the sensible heat lux (H) and a fast response infrared CH2/H2O gas
analyser (LI7500-Licor, Nebraska – USA) to acquire the latent heat lux (LE). The sensors were programmed with a sampling
at a high frequency of 16 Hz. Corrections to LE due to sensible
and latent heat luxes (Webb et al., 1980), frequency losses
(Moore, 1986) and coordinate rotation (McMillen, 1988) were
applied by using software developed by van Dijk et al. (2004).
All components of short and long wave radiation were measured with pyranometers and pyrgeometers facing up and down (Kipp & Zonen, Delft, The Netherlands). Net radiation (Rn) was acquired by the difference of all incident and outgoing
energy luxes. The soil heat lux (G) was measured with one lux
plate (model HFT3-L, REBS, Radiation and Energy Balance Systems, Seattle, WA), placed 2 cm below the soil surface. Although measuring G at only one place in “Caatinga” being not accurate, its value for 24 hours is close to zero. On the other hand, the main objective of the current research was to study the seasonal dynamics of daily energy partition under different thermohydrological conditions, with less interest in the short-time scale components.
Precipitation was quantiied in the experimental area, with a tipping bucket rain gauge (model TE525-L, Campbell
Scientific, Logan, UT, USA) close to the EC sensors. Microclimate measurements of air temperature (Ta) and relative
humidity (RH) were taken above the vegetation with a probe from Vaisala (model HMP 45C-L, Helsinki, Finland) at the same
height as the radiation sensors.
2.3 Theory
Latent (LE) and sensible (H) heat luxes were calculated,
respectively, by the following equations:
where LE and H are in W m-2; λ is the vaporization latent heat
(J kg-1); ρ
a is the air density (kg m-3); cp is the air speciic heat
at constant pressure (J kg-1K-1); and w’, ρ
v’, Ta’ are respectively the instantaneous deviation of vertical wind speed, water vapour density and air temperature in relation to their mean values (respectively m s-1, kg m-3, oC). The bars indicate averages (Stull, 1988).
Missing and unrealistic EC-based LE data from the gas analyser during the rainy and low turbulence periods were illed by the relationship between (H + LE) and the available energy (Rn + G) (Teixeira and Bastiaanssen, 2012).
The Penman-Monteith equation was developed to predict LE from vegetated surfaces (Allen et al., 1998)
' ' w LE=λ ρv
' T ' w c
H=ρa p a
(1)
(2)
where Rn and G are in W m-2, ∆ is the slope of the saturated
vapour pressure curve (kPa oC-1); e
sandea are respectively the
actual and saturation vapour pressure of the air (kPa); γ is the psychometric constant (kPa o C-1); r
s and ra are respectively the surface and aerodynamic resistances (s m-1).
To estimate rs (s m-1), microclimatic data on Ta and RH were used together with Rn, LE and G, inverting Equation 3 (Teixeira, 2009). For ra (s m-1), the following equation was applied:
where z0h is the roughness length governing transfer of heat
and vapour (m); k is the von Karman’s constant (0.41); u* is the friction velocity (m s-1); z is the wind measurement height (m); d is the displacement height (m); Ψh is the stability correction
due to buoyancy; and L is the Obukhov length.
Following the standard work of Allen et al. (1998),
we assumed z0h as being 10% of the roughness length for momentum (z0m), with z0m calculated by:
where Ψm is the stability correction due for momentum; and u is the horizontal wind speed from the sonic anemometer (m s-1).
As “Caatinga” species have different heights, making it dificult to formulate a suitable formulation for d, we used
the relationships d = 0.66hv (Allen et al., 1998), being hv the mean height of the vegetation. Ratios of d to the height of the vegetation (hv) were usually reported to lie in the range of 0.6 (Garrat, 1978).
The EC data could be used to acquire u* directly:
where u’ is the instantaneous deviation of horizontal wind speed (m s-1) in relation to their mean values (Stull, 1988).
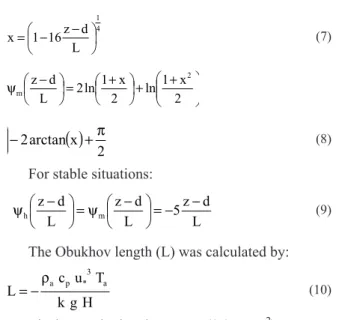
The universal functions suggested by Businger et al. (1971) and the integrated stability functions of temperature (Ψh) and momentum (Ψm) were applied.
For unstable situations:
with ) r r 1 ( r ) e e ( c ) G R ( LE a s a a s p a n + γ + ∆ − ρ + − ∆ = (3) * h h 0 a ku z d z ln r ψ − − = (4) − ψ + − = L d z u u k exp d z z m * m 0 (5) ' w ' u u*=
For stable situations:
The Obukhov length (L) was calculated by:
where g is the gravitational constant (9.81 m s-2).
The aerodynamic surface temperature (T0) was derived by using microclimatic data on H, Ta, and ra (Smith et al., 1989). 4 1 L d z 16 1 x − − = (7) 2 x 1 ln 2 x 1 ln 2 L d z 2 m + + + = − ψ
( )
2 x arctan 2 2x2 π
+ −
(8)
L d z 5 L d z L d z m h − − = − ψ = − ψ (9) H g k T u c L a 3 * p a ρ − = (10) a p a a 0 T c r H T + ρ = (11)
3. RESULTS AND DISCUSSION
3.1 Weather drivers
Figure 2 shows the monthly average weather variables in the agro-meteorological station, during the years 2004 and 2005.
Considering both years, RG was lower from May to July, with a monthly mean value of 15.0 MJ m-2 d-1, and higher from October to December, averaging 21.0 MJ m-2 d-1 (Figure 2a). Ta followed RG along the years , however with a time lag of one month, with the largest thermal conditions from October to
December, when there was a peak of 28.9 °C (Figure 2b). The Ta minimum values occurred between June and August, averaging 23.9 and 23.7 °C in July of 2004 and 2005, respectively. The seasonal trend for RH is shown in Figure 2c. The highest and the lowest values occurred respectively during the rainy season from January to May (averages of 74% and 71% for the years 2004 and 2005, respectively) and the driest period from September to November (corresponding average values of 52% and 50%). As an opposite behaviour of RH, the lowest u values were during the rainiest period (February to April), with mean values of 1.4 m s-1 and 1.6 m s-1, respectively for the years 2004 and 2005,
12.0 14.4 16.8 19.2 21.6 24.0
Jan Feb Mar Apr May Jun Jul Aug Sep Oct Nov Dec 2004 2005 22.0 23.6 25.2 26.8 28.4 30.0
Jan Feb Mar Apr May Jun Jul Aug Sep Oct Nov Dec
45 52 59 66 73 80
Jan Feb Mar Apr May Jun Jul Aug Sep Oct Nov Dec 1.0 1.5 2.0 2.5 3.0 3.5
Jan Feb Mar Apr May Jun Jul Aug Sep Oct Nov Dec
G lo ba l s ola r r ad ia tio n – RG (MJ m -2 d -1) Re la tiv e hu m id ity – R H (% ) W ind sp ee d – u (m s -1) A ir te m pe ra tu re – Ta ( oC )
Month of the year
(a) (b)
(c) (d)
Figure 2 - Monthly average values of weather variables during the years 2004 and 2005: (a) Global solar radiation – RG; (b) Mean air temperature
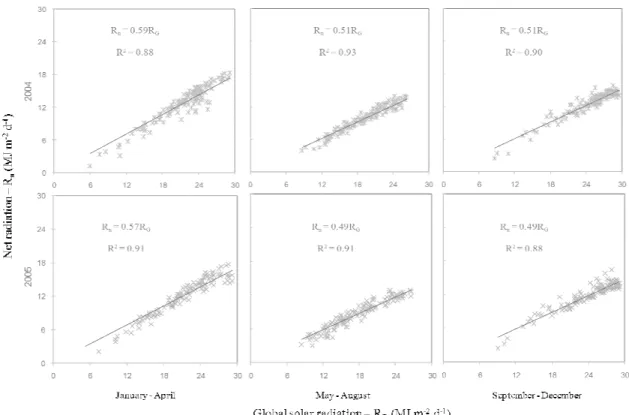
Figure 3 - Relations between the daily values of net radiation (Rn) and incident global solar radiation (RG) in natural vegetation (“Caatinga”) for each four-month periods of the years 2004 and 2005.
while the highest ones were under the driest conditions, around 3.0 m s-1 in both years (Figure 2d).
3.2 Energy balance
Figure 3 presents the daily relations between Rn and RG for each four-month period of the years 2004 and 2005.
There were consistent relationships between Rn and RG, with the slopes of all equations ranging between 0.49 and 0.59, similar to those obtained by Hughes et al. (2001) for a temperate salt marsh in Australia. Stanhill et al. (2006) reported values of Rn/RG around 0.50 for nine different associations of natural vegetation and two agricultural surfaces. Considering both years of the current study, the variation in RG explained around 90% of that for Rn, evidencing that the daily available energy for “Caatinga” can be accurately estimated from pyranometers under any thermohydrological conditions. However, during the rainy season, Rn represented 60% of RG, while outside this period, this fraction dropped to 50%. The high correlations between Rn and RG are relevant because nowadays, the spatial variation of RG across vast areas can be well described from satellite images.
Data quality from the EC system was verified by analysing the energy balance closure. The turbulent energy luxes (LE + H) and the available energy (Rn - G) were compared for the whole period of measurements (2004-2005) on a daily time-scale (Figure 4).
Since the main objective of this research is for better understanding the dynamics of the seasonal energy balance in “Caatinga”, there was no interest in studying hourly closures.
Yet, storage components (soil, air column) were not included,
but at daily time-scale analyses, the errors due to the absence of these components may be neglected.
The daily closure was 89%, with a Root Mean Square Error (RMSE) of 0.9 MJ m-2 d-1, conirming the good quality of the dataset. A closure error of 10 to 30 % is frequent with EC measurements. Gu et al. (2008), Lu et al. (2011) and Zhang et al. (2012) also reported available energy (Rn - G) exceeding
measured luxes (LE + H) in natural vegetation. Results from 22 lux sites indicated a mean imbalance in the order of 20%
(Wilson et al., 2002).
The lack of energy balance closure can be associated
with measurement errors in Rn and G, however EC systems have their own sources of error (Twine et al., 2000). In addition,
this lack can also be due to sampling errors related to different footprints, neglected energy sinks, loss of low and/or high frequency contributions to the turbulent heat lux and advection
of scalars (Paw U et al., 2000).
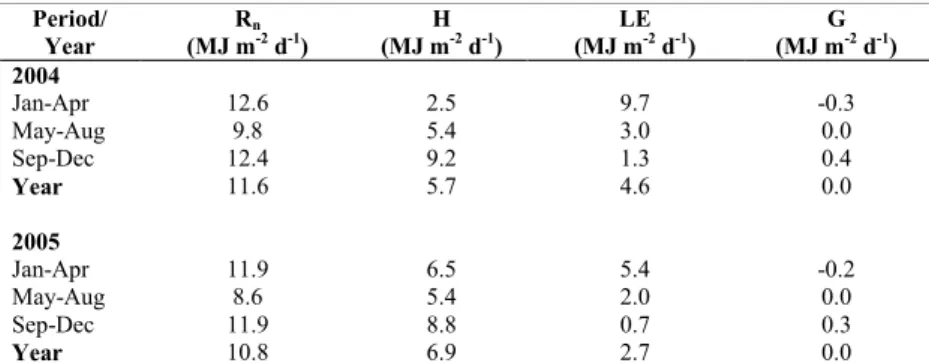
The four-month and annual averaged values for the energy balance components in “Caatinga”, along the years 2004 and 2005, are given in Table 1.
Figure 4 - Relationship between the turbulent energy luxes (LE
+ H) and the available energy (Rn - G) from the energy balance
measurements. LE – Latent heat lux; H – Sensible heat lux; Rn – Net
radiation; and G – Soil heat lux.
0 4 9 13 18 22
0 4 9 13 18 22
H
+
LE
(
M
J m
-2
d
-1)
Rn- G (MJ m-2d-1) H + LE = 0.89(Rn– G)
R2= 0.84
Period/ Year
Rn
(MJ m-2 d-1)
H (MJ m-2 d-1)
LE (MJ m-2 d-1)
G (MJ m-2 d-1)
2004
Jan-Apr 12.6 2.5 9.7 -0.3
May-Aug 9.8 5.4 3.0 0.0
Sep-Dec 12.4 9.2 1.3 0.4
Year 11.6 5.7 4.6 0.0
2005
Jan-Apr 11.9 6.5 5.4 -0.2
May-Aug 8.6 5.4 2.0 0.0
Sep-Dec 11.9 8.8 0.7 0.3
Year 10.8 6.9 2.7 0.0
Table 1 - Four-month and annual average values for the energy balance components in “Caatinga”, during the years 2004 and 2005: net radiation (Rn), sensible heat lux (H); latent heat lux (LE) and soil heat lux (G).
in average, accounted for 49 and 64 % of Rn in 2004 and 2005, respectively. During the rainiest period from January to April, these fractions were 20% and 55%. The highest H/Rn values occurred from September to December, with an average of 74% for both years. The annual partitions of Rn as LE were 40 % and
25 % with the maximums of 77 and 45% occurring in the irst
four-month periods of the years 2004 and 2005, respectively. The available energy used as G on a daily time-scale may be neglected, being close to 0% for all thermohydrological conditions.
The LE range corresponded to daily ET rates between 4.0 and 0.3 mm d-1, respectively, with the highest and lowest values, occurring during the irst and third four-month periods of the years 2004 and 2005. Considering the annual amounts, ET for the irst year with 687 mm represented 95% of P, while in the second one, with total ET of 403 mm, it was 19% more than the total rainfall amount. ET higher than P means that the remaining soil moisture from the previous year contributed to the water luxes.
Lu et al. (2011) found the ratio ET/P varying from 0.78 to 1.50 for disturbed and undisturbed ecosystems in the semi-arid Inner Mongolia, the higher limit being attributed to ground water access from the root zones. ET rates of 207 mm yr-1 in a desert steppe Mongolia reported by Zhang et al. (2012) and of 266 to 319 mm yr-1 for grassland in California by Ryu et al. (2008), are lower than those for the Brazilian “Caatinga” species. However, ET for 2005 in the current study is inside the range of 341 to 426 mm yr-1found by Gu et al. (2008) in a Qinghai-Tibetan alpine meadow grassland.
Figure 5 presents the daily relations of LE and H with Rn, for each four-month period of the years 2004 and 2005.
The largest fraction of Rn was transformed into LE from January to April; however, both, their relations and correlations, were different according to the amount of P in the different years. While in 2004 LE represented 77% of Rn, with the regression equation explaining 67% of the cases, in 2005 these numbers were 46% and 33%. From May to December, LE/Rn declined progressively. After April, LE variations could not be explained by changes in Rn, with the R2 close to zero. Zhang et al. (2012) found variations in Rn explaining around 57% of those for LE from April to September in a desert steppe of Mongolia. However, the rainfall regime in Mongolia is more stable than that for the Brazilian semi-arid conditions, where R2 of this magnitude occurred only during the unusual rainy season of 2004.
The H/Rn ratio is also dependent on P, but in an inverse way, when comparing with LE/Rn. From January to April in 2004, one can see much smaller H/Rn values, when compared
with the same period in 2005. After the irst four-month periods,
H/Rn increased continuously, but from May to August, because of the higher remaining soil moisture in 2004, lower values are
veriied, when compared with those for 2005.
The difficulties of modelling the energy fluxes in the Brazilian semi-arid natural vegetation rely on the poor correlations of LE and H with Rn in some periods of the year.
Rn, when the soil was wet enough. Then, ET from “Caatinga”
is primarily determined by patterns of P. According to Yuan
et al. (2010), annual ET rates will approach annual P in semi-arid environments, which is in agreement with other natural ecosystems (Wang et al., 2004; Ryou et al., 2008; Zhang et al., 2012).
3.3 Soil-Water-Vegetation-Atmosphere relations
In well-irrigated crops, values of ET/ET0 (Well known
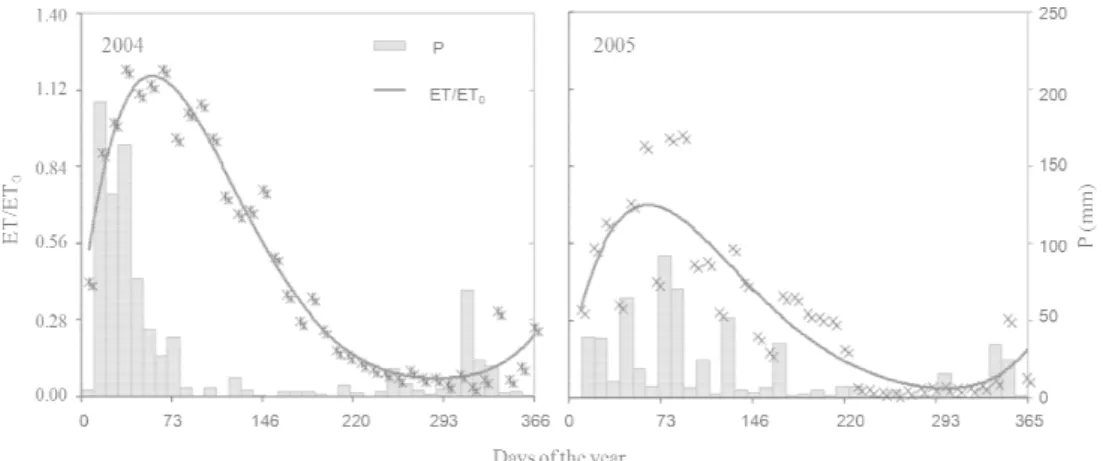
as crop coeficient – Kc) can be used for estimating the water requirements at different spatial scales (Teixeira, 2009). This ratio is related to soil moisture conditions, and in natural vegetation, it can be used to characterize the moisture status in the root zones (Lu et al., 2011). In the current study, curves of the ET/ET0 average ten-day periods, along the years 2004 and 2005, were constructed together with the corresponding P totals over the “Caatinga” for the same time-scale (Figure 6).
A strong ET/ET0 dependence on rainfall conditions is observed, with the highest values occurring during the rainy season (January-April), and those for 2005 are 40% lower than those for 2004. During the driest periods of both years, ET/ET0 was close to zero. Another increase happened in November, at the start of the next rainy season. The mean ET/ET0 values were 0.47 and 0.31 with peaks of 1.19 and 0.95 for the years 2004 and 2005, respectively.
Figure 5 - Daily relations between latent (LE) and sensible (H) heat luxes with net radiation (Rn) in “Caatinga” for each four-month periods of the years 2004 and 2005.
Zhang et al. (2012), who studied a temperate desert steppe in Inner Mongolia, China, found seasonal variations of ET/ET0 with mean daily values from 0.16 to 0.75, lower than those of the current study. However, Lu et al. (2011), in the same Chinese region, presented values higher than 1.00 for six different ecosystems. Sumner and Jacobs (2005) reported an ET/ET0 rangebetween 0.47 and 0.92 in a non-irrigated pasture site in Florida, USA, similar to values during the rainy period for the Brazilian “Caatinga” species.
Zhou and Zhou (2009) concluded that air temperature, air humidity and the available energy were the most important variables for the ET/ET0 variations in a reed marsh in the northeast of China. In the current study, the most explanatory factor for the highest values of this ratio was the concentration
of precipitations during the irst semester of the year. The strong
ET/ET0 dependence on the amount of rains is consistent with
results in other semi-arid regions (Yamanaka et al., 2007; Lu
et al., 2011).
It can be concluded that parameterizations will strongly depend on the soil moisture conditions. Zhang et al. (2012) confirmed this limitation in a desert steppe ecosystem in Mongolia, where the magnitude and frequency of ET were
dificult to simulate during rainfall events. On the other hand,
Figure 6 - Seasonal variation of the ten-day period averaged values for the ratio of actual (ET) to reference (ET0) evapotranspiration in “Caatinga”
during the years 2004 and 2005 together with totals of precipitation (P). The smoothed lines indicate the polynomial trends of ET/ET0 values along the years.
In mixed vegetation, plant structures exert drag effects on the wind, producing turbulent eddies which are largely responsible for the vertical mixing of mass across the
biosphere-atmosphere interface (Thomas and Foken, 2007). Our ability to predict surface-layer mass and energy luxes at any time
and spatial scales with accuracy, therefore, depends on the effectiveness of the parameterization of these effects (Mahrt, 2010).
The four-month and annual averages of the key vegetation parameters related to water and energy luxes in “Caatinga”, for the years 2004 and 2005, are shown in Table 2.
Due to several tall and aerodynamically rough canopy architectures, the mixed species from “Caatinga” presented high u* values, however without differences between the drier and the wetter years, both with annual average values of 0.39 m s-1. In 2004, the z0m values were 30% larger than those for 2005,
because during the irst year, the natural vegetation generates
much turbulent movements above the canopies, because of high rain amounts contributing to plant development. According to Harman (2012), z0m is dependent on soil moisture and vegetation conditions.
The highest ra coincided with the lowest rs during the rainiest four-month periods of both years. The relatively low ra, around 40 s m-1, can be directly ascribed to the tall natural species. The both larger De and rs in 2005 when compared to
2004, during the irst four-month periods, are also consequences
of soil moisture differences between the years. The higher u in 2005 did not contribute for increasing the ET rates in relation to 2004, because most of the time in 2005, the soil was drier.
Among the dificulties of using Equation 3, especially
on large scales, are the ra and rs estimations (Jia, 2004). A more in-depth physical explanation of “Caatinga” energy and water luxes can be obtained if these resistances are analysed. The average rs from January to April 2005 was four times of that
for 2004, as soil moisture constraints and high water vapour
pressure deicit (De) induced much the stomata closure in 2005 (Mata-Gonzáles et al., 2005). The larger rs from September to December in both years are due to the increasing atmospheric demand together with lower rainfall amounts.
The most influenced vegetation parameter by the thermohydrological conditions was rs. Figure 7 shows its relation with other parameters, which also depend more or less on these conditions.
On the one hand, there was not a clear relationship between rs and surface albedo (α0). On the other hand, rs dropped exponentially with increases on ET/ET0, and rose with increments on T0 and De. The highest correlation was obtained with ET/ET0, followed by De and T0. Testi et al. (2004), who studied an olive orchard in Spain also reported increases in rs with rising De values. Rana et al. (2005) conirm the dependence of rs on De, but according to these authors, the energy available to the vegetation also plays a role.
4. CONCLUSIONS
From the energy balance parameterizations in “Caatinga”, it is concluded that net radiation can be estimated from the global solar radiation data with good accuracy, under any thermohydrological conditions. This is highly relevant because nowadays the spatial variation of solar radiation across vast areas can be acquired from satellites, which aids in the description of the available energy in this Brazilian natural ecosystem.
The sensible heat lux was in general in excess of the latent heat lux, except under the rainiest conditions. During
Period/ Year
u*
(m s-1)
z0m
(m)
ra
(s m-1)
rs
(s m-1)
De
(kPa)
u (m s-1)
2004
Jan-Apr 0.31 0.53 50 205 1.1 2.0
May-Aug 0.42 0.39 34 1134 1.3 3.0
Sep-Dec 0.44 0.36 36 3279 2.1 3.2
Year 0.39 0.43 40 1542 1.5 2.8
2005
Jan-Apr 0.32 0.35 50 865 1.4 2.2
May-Aug 0.43 0.31 35 1710 1.2 3.2
Sep-Dec 0.44 0.31 38 4431 2.0 3.2
Year 0.39 0.33 41 2332 1.5 2.9
Table 2 - Four-month and annual averages for the key vegetation parameters for “Caatinga”, during the years 2004 and 2005: friction velocity
(u*); roughness length for momentum (z0m); aerodynamic (ra) and surface (rs) resistances; vapour pressure deicit (De); and horizontal wind speed above the canopies (u).
y = 47980e-27.23x
R² = 0.11
0 1700 3400 5100 6800 8500
0.10 0.12 0.14 0.16 0.18 0.20
y = 1.8718e0.23x
R² = 0.26
0 1700 3400 5100 6800 8500
20.0 24.0 28.0 32.0 36.0 40.0
y = 97.13e1.18x
R² = 0.42
0 1700 3400 5100 6800 8500
0.1 1.1 2.1 3.1 4.1 5.1
y = 3349.6e-2.88x
R² = 0.82
0 1700 3400 5100 6800 8500
0.00 0.30 0.60 0.90 1.20 1.50
rs
(s
m
-1)
rs
(s
m
-1)
rs
(s m
-1)
rs
(s
m
-1)
α0 T0(oC)
De(kPa) ET/ET0
(a) (b)
(c) (d)
Figure 7 - Relationships between surface resistance (rs) and other soil-water-vegetation-atmosphere related parameters. (a) with surface albedo
(α0); (b) with aerodynamic surface temperature (T0); (c) with vapour pressure deicit (De); and (d) with the ratio of actual (ET) to reference (ET0)
evapotranspiration.
as these fractions will strongly depend on the soil moisture conditions, which in turn are variable along and among the years.
T h e u s e o f t h e r a t i o o f a c t u a l t o r e f e r e n c e evapotranspiration has been done eficiently in irrigated crops for water requirements determination, however, in the Brazilian natural vegetation it is also strong dependent on the amounts of precipitation. Indeed, the most explanatory factor for its highest values was the concentration of unusual rains in the irst semester of 2004.
During the wetter year 2004, the natural vegetation generates much turbulent movement above the canopies, due to much rain amounts, which promoted larger vegetative development of the “Caatinga” species. The relatively low
aerodynamic resistance (see Table 2) could be directly ascribed to the tall natural species, while the surface resistance values were affected by the soil moisture constraints and high water
vapour pressure deicit, both inducing stomata closure. This resistance dropped exponentially with the ratio of actual to reference evapotranspiration, while increased with rising aerodynamic surface temperature and vapour pressure deicit.
The results of the current research are useful for understanding the dynamics of the natural vegetation in the Brazilian semi-arid conditions, which has experienced climate
and land use changes with consequent signals of desertiication
6. REFERENCES
ALLEN, R.G.; PEREIRA, L.S.; RAES, D.; SMITH, M.
Crop evapotranspiration, Guidelines for computing crop water requirements, FAO Irrigation and Drainage Paper 56. Rome, Italy, 1998, 300p.
ALVES, J.J.A.; ARAÚJI, M.A. de; NASCIMENTO, S.S. Degradação da Caatinga: uma investigação ecogeográica.
Caminhos de Geograia, v. 9, p. 143-155, 2008.
ANDERSON, M.C.; KUSTAS, W.P.; ALFIERI, J.G.; GAO, F.; HAIN, C.; PRUEGER, J.H.; EVETT, E; COLAIZZI, P.; HOWELL, T.; CHÁVEZ, J.L. Mapping daily evapotranspiration at Landsat spatial scales during
BEAREX’08 field campaign. Advances in Water
Resources, v. 50, p. 162-177, 2012.
AVISSAR, R.; da SILVA, R.R.; WERTH, D. Implications of tropical deforestation for regional and global hydroclimate.
In: Ecosystem and Land Use Change. Geophysical
Monograph Series, v. 153, p. 73-83, 2004.
BUSINGER, J.A.; WYNGAARD, J.C.; IZUMI, Y.; BRADLEY, E.F. Flux-profile relationships in the atmospheric surface layer. Journal of Atmospheric Science, v. 28, p. 189-191. 1971.
C O S TA , M . H . ; N U N E S , E . L . ; S E N N A , M . C . A . ; IMBUZEIRO, H.M.A. Estado da arte da simulação da taxa de ixação de carbono de ecossistemas tropicais. Revista Brasileira de Meteorologia, v. 76, n. 179-187, 2009. GARRAT, J.R. Transfer characteristics for a heterogeneous
surface of large aerodynamics roughness. Quarterly Journal of Royal Meteorology Society, v. 104, p. 491-502, 1978. GASH, J.H.C.; SHUTTLEWORTH, W.J. Evaporation,
selection, introduction and commentaries, Sahra benchmark papers in hydrology, IAHS, ISBN 978-901502-98-5, 2007. GU, S.; TANG, Y.; CUI, X.; DU, M.; ZHAO, L.; LI, Y.; XU,
S.; ZHOU, H.; KATO, T.; QI, P.; ZHAO, X. Characterizing evapotranspiration over a meadow ecosystem on the Qinghai-Tibetan Plateau. Journal of Geophysical Research, v. 113: D08118. DOI: 10.1029/2007JD009173, 2008.
HARMAN, I.N. The role of roughness sublayer dynamics within surface exchanges schemes. Boundary Layer Meteorology, v. 142, p. 1-20, 2012.
HAYASHI, M.M.S.; CAMPELO Jr., J.H.; FILHO, N.P.; NOGUEIRA, J.S.; VOURLITS, G.L. Balanço de Energia da Crotalaria juncea L. no Período Seco e no Período Úmido
do Ano, em Condições de Cerrado. Revista Brasileira de Agrometeorologia, v. 10, p. 197-205, 2002.
HUGHES, C.E.; KALMA, J.D.; BINNING, P.; WILLGOOSE, G.R.; VERTZONIS, M. Estimating evapotranspiration for a temperate salt marsh Newcastle, Australia. Hydrological Processes, v. 15, p. 957-975, 2001.
HUXMAN, T.E.; WILCOX, B.P.; BRESHEARS, D.D.;
SCOTT, R.L.; SNYDER, K.A.; SMALL E.E.; HULTINE,
K.; POCKMAN, W.T.; JACKSON, R.B. Ecohydrological implications of woody plant encroachment. Ecology, v. 86, p. 308-319, 2005.
JIA, L. Modeling heat exchanges at the land-atmosphere interface using multi-angular thermal infrared measurements. PhD dissertation, Wageningen, the Netherlands, 199 p, 2004.
KESSOMKIAT, W.; FRANSSEM, HARRIE-JAN H.; GRAF, A.; VEREECKEN, H. Estimation random errors of eddy covariance data: An extended two-tower approach.
Agricultural and Forest Meteorology, v. 171-172, p. 203-209, 2013.
KOUNOUHÉWA, B.; MAMADOU, O.; N’GOBI, G.K.; AWANOU, C.N. Dynamics and diurnal variations of surface radiation budget over agricultural crops located in Sudanian climate. Atmospheric and Climate Sciences, v. 3, p. 121-131, 2013.
LeMONE, M.A.; CHEN, F.; ALTIERI, J.C.; TEWARI, M.; GEERTS, B.; MIAO, Q.; GROSSMAN, R.L.; COUTER, R.L. Influence of land cover and soil moisture on the horizontal distribution of sensible and latent heat luxes in Southeast Kansas during IHOP 2002 and CASES-97.
Journal of Hydrometeorology, v. 8, p. 68-87, 2007. LU, N.; CHEN, S.; WILSKE1, B.; SUN, G.; CHEN, J.
Evapotranspiration and soil water relationships in a range of disturbed and undisturbed ecosystems in the semi-arid Inner Mongolia, China. Journal of Plant Ecology, v. 4, p. 49-60, 2011.
MAHRT, L. Computing turbulent luxes near the surface: needed improvements. Agricultural and Forest Meteorology, v. 150, p. 501-509, 2010.
MATA-GONZÁLEZ, R.; McLENDON, T.; MARTIN, D.W.
The inappropriate use of crop transpiration coeficients
(Kc) to estimate evapotranspiration in arid ecosystems: a review. Arid Land Research and Management, v. 19, p. 285-295, 2005.
McMILLEN, R.T. An eddy correlation technique with extended applicability to non-simple terrain. Boundary Layer Meteorolog, v. 43, p. 231-245, 1988.
MOORE, C.J. Frequency response corrections for eddy correlation systems. Boundary Layer Meteorology, v. 37, p. 17-35, 1986.
MULLIGAN, M. A review of European Union funded
research into modelling Mediterranean desertiication.
Department of Geography, Kingꞌs College London, Strand,
London WC2R 2LS, UK, 2004.
OYAMA, M.D.; NOBRE, C.A. Climatic consequences of
simulation study. Journal of Climate, v. 17, p. 3204-3203, 2004.
PAW U, K.T.; BALDOCCHI, D.D.; MEYERS, T.P.; WILSON, K.B. Corrections of eddy covariance measurements
incorporating both advective effects and density luxes,
Boundary Layer Meteorology, v. 97, p. 487-511, 2000. RANA, G.; KATERJI, N.; LORENZA, F. de. Measuring and
modelling of evapotranspiration of irrigated citrus orchard under Mediterranean conditions. Agricultural and Forest Meteorology, v. 128, p. 199-209, 2005.
RYOU, Y.; BALDOCCHI, D.D.; MA, S.; HEHN, T. Interannual variability of evapotranspiration and energy exchange over an annual grassland in California. Journal of Geophysical Research, v. 113, D09104. DOI: 10.1029/2007JD009263, 2008.
SILANS, A.M.B.P de; Siva, F.M. da. Fluxo de calor sensível e evapotranspiração na Caatinga: Estudo experimental.
Revista Brasileira de Recursos Hídricos, v. 12, p. 177-188, 2007.
SMITH, R.G.C.; BARRS, H.D.; MEYER, W.S. Evaporation from irrigated wheat estimated using radiative surface temperature: an operational approach. Agricultural and Forest Meteorology, v. 48, p. 331-344, 1989.
STANHILL, G., HOFSTEDE, G.J., KALMA, J.D. Radiation balance of natural and agricultural vegetation. Quartely Journal of the Royal Meteorological Society, v. 92, p. 128-140, 2006.
STULL, R.B. An Introduction to Boundary Layer Meteorology. Kluwer Academic Plublishers: Boston; 666p, 1988. SUMNER, D.M.; JACOBS, J.M. Utility of Penman-Monteith,
Priestley-Taylor, reference evapotranspiration, and pan evaporation methods to estimate pasture evapotranspiration. Journal of Hydrology, v. 308, p. 81-104, 2005.
SUN, G; ALSTAD, K; CHEN, J.; FORD, C.R.; LIN, G.; LIU,
C.; LU, N.; MCNULTY S.G.; MIAO, H.; NOORMETS,
A. A general predictive model for estimating monthly ecosystem evapotranspiration. Ecohydrology, v. 4, p. 245-255, 2010.
TANAKA, H.; HIYAMA, T.; KOBAYASHI, N.; YABUKI, H.; ISHII, Y.; DESYATKIN, R.V.; MAXIMOV, T.C.; OHTA, T. Energy balance and its closure over a young larch forest in eastern Siberia. Agricultural and Forest Meteorology, v. 148, p. 1954-1967, 2008.
TEIXEIRA, A.H. de C. Water productivity assessments from
ield to large scale: a case study in the Brazilian semi-arid
region, LAP Lambert Academic Publishing: Saarbrücken, Germany; 226 p. 2009.
TEIXEIRA, A.H. de C. Determining regional actual evapotranspiration of irrigated and natural vegetation in the São Francisco river basin (Brazil) using remote sensing
and Penman-Monteith equation. Remote Sensing, v. 2, p. 1287-1319, 2010.
TEIXEIRA, A. H. de C.; BASTIAANSSEN, W.G.M. Five
methods to interpret ield measurements of energy luxes over a micro-sprinkler-irrigated mango orchard. Irrigation Science, v. 30, p. 13-28, 2012.
TEIXEIRA, A.H. de C.; HERNANDEZ, F.B.T.; LOPES, H.L.; SCHERER-WARREN, M.; BASSOI, L.H. A Comparative Study of Techniques for Modeling the Spatiotemporal Distribution of Heat and Moisture Fluxes in Different Agroecosystems in Brazil. In: Remote Sensing of Energy Fluxes and Soil Moisture Content, PETROPOULOS G. (ed). 1ed.Boca Raton: CRC Group, Taylor and Francis, Florida: 169-191, 2014.
TESTI, L.; VILLALOBOS, F.J.; ORGAZ, F. Evapotranspiration of a young olive orchard in southern Spain. Agricultural and Forest Meteorology. v. 121, p. 1-18, 2004.
THOMAS, C.; FOKEN, T. Flux contribution of coherent structures and its implications for the exchange of energy and matter in a tall canopy. Boundary Layer Meteorology, v. 123, p. 317-337, 2007.
TIMOUK, F.; KERGOAT, L.; MOUGIN, E.; LLOYD, C.R.; CESCHIA, E.; COHARD, J.-M.; ROSNAY, P.
de; HIERNAUX, P.; DEMAREZ, V.; TAYLOR, C.M. Response of surface energy balance and water regime and vegetation development in a Sahelian landscape. Journal of Hydrology, v. 375, p. 178-189, 2009.
TWINE, T.E.; KUSTAS, W.P.; NORMAN, J.M.; COOK,
D.R.; HOUSER, P.R.; MEYERS, T.P.; PRUEGER, J.H.; STARKS, P.J.; WESELY, M.L. Correcting eddy-correlation
lux estimates over grassland. Agricultural and Forest Meteorology, v. 103, p. 279-300, 2000.
van DIJK, A.; MOENE, A.F.; DE BRUIN, R. The principles
of surface lux physics: theory, practice and description
of the Ecpack library: Internal Report, Meteorology and Air Quality Group, Wageningen University, Wageningen, The Netherlands; 99p, 2004.
WANG, X.; BROWN-MITIC, C.M.; KANG, E.; ZHANG, J.; LI, X. Evapotranspiration of Caraganakorshinskii communities in a revegetated desert area: Tengger Desert, China. Hydrological Processes, v. 18, p. 3293-3303, 2004. WEBB, E.K.; PEARMEN, G.L.; LEUNING, R. Correction
of lux measurements for density effects due to heat and water vapour transfer. Quarterly Journal of the Royal Meteorological Society, v. 106, p. 85-100, 1980.
TENHUNEN , J.; VALENTINI, R.; VERMA, S. Energy balance closure at Fluxnet sites. Agricultural and Forest Meteorology, v. 113, p. 223-243, 2002.
WU, X.; ARCHER, S. Scale-dependent influence of topography-based hydrologic features on patterns of woody plant encroachment in savanna landscapes. Landscape Ecology, v. 20, p. 733-742, 2005.
YAMANAKA, T.; KAIHOTSU, I.; OYUNBAATAR, D.;
GANBOLD, T. Summer time soil hydrological cycle and surface energy balance on the Mongolian steppe. Journal of Arid Environment, v. 69, p. 65-79, 2007.
YUAN, W.; LIU, S.; LIU, H.; RANDERSON, J.T.; YU, G.;
TIESZEN, L.L. Impacts of precipitation seasonality and
ecosystem types on evapotranspiration in the Yukon River Basin, Alaska. Water Resources Research, v. 46: W02514. DOI: 10.1029/2009WR008119, 2010.
XUE, Y.; JUANG, H.-M.H.; PRINCE, W.-P.LI,S.; DEFRIES, R.; JIAO, Y.; VASIC, R. Role of land surface processes in monsoon development: East Asia and West Africa. Journal of Geophysical Research, v. 109, p. 1-24, 2004.
ZHANG, Y.K.; SCHILLING, K.E. Effects of land cover on water table, soil moisture, evapotranspiration, and
groundwater recharge: a ield observation and analysis.
Journal of Hydrology, v. 319, p. 328-338, 2006.
ZHANG, F.; ZHOU, G.; WANG, Y.; YAN, F.; CHRISTER
NILSSON, C. Evapotranspiration and crop coeficient for a temperate desert steppe ecosystem using eddy covariance in Inner Mongolia, China. Hydrological Processes, v. 26, p. 379-386, 2012.