BGD
8, 7525–7550, 2011Organohalogens from saline environments
K. Kotte et al.
Title Page
Abstract Introduction
Conclusions References
Tables Figures
◭ ◮
◭ ◮
Back Close
Full Screen / Esc
Printer-friendly Version Interactive Discussion
Discussion
P
a
per
|
Dis
cussion
P
a
per
|
Discussion
P
a
per
|
Discussio
n
P
a
per
|
Biogeosciences Discuss., 8, 7525–7550, 2011 www.biogeosciences-discuss.net/8/7525/2011/ doi:10.5194/bgd-8-7525-2011
© Author(s) 2011. CC Attribution 3.0 License.
Biogeosciences Discussions
This discussion paper is/has been under review for the journal Biogeosciences (BG). Please refer to the corresponding final paper in BG if available.
Organohalogen emission from saline
environments – spatial extrapolation
using remote sensing as most promising
tool
K. Kotte1, F. L ¨ow2, S. G. Huber1, I. Mulder1, and H. F. Sch ¨oler1 1
Institute of Earth Sciences, University of Heidelberg, 69120 Heidelberg, Germany
2
Department of Remote Sensing, Institute of Geography, University of W ¨urzburg, 97074 W ¨urzburg, Germany
Received: 1 July 2011 – Accepted: 14 July 2011 – Published: 28 July 2011 Correspondence to: K. Kotte ([email protected])
BGD
8, 7525–7550, 2011Organohalogens from saline environments
K. Kotte et al.
Title Page
Abstract Introduction
Conclusions References
Tables Figures
◭ ◮
◭ ◮
Back Close
Full Screen / Esc
Printer-friendly Version Interactive Discussion
Discussion
P
a
per
|
Dis
cussion
P
a
per
|
Discussion
P
a
per
|
Discussio
n
P
a
per
|
Abstract
Due to their negative water budget most recent semi-/arid regions are characterized by vast evaporates (salt lakes and salty soils). We recently identified those hyper-saline environments as additional sources for a multitude of volatile halogenated organohalo-gens (VOX). These compounds affect the ozone layer of the stratosphere and play 5
a key role in the production of aerosols. A remote sensing based analysis was per-formed in the southern Aral Sea basin, providing information of main soil types as well as their extent and spatial and temporal evolution. VOX production has determined in dry and moist soil samples for 24 h. Several C1- and C2 organohalogens, including chloromethane and bromomethane, have been found in hyper-saline topsoil profiles. 10
The range of naturally produced organohalogens includes dichloroethene. For the 15 000 km2ranging research area in the southern Aralkum desert a daily production of up to 23 t dichloroethene has been calculated using MODIS time series and supervised image classification. The applied setup reproduces a short-term change in climatic conditions starting from dried-out saline soil, instantly humidified during rain events or 15
flooding. VOX emission from dry fallen Aral Sea sediments will further increase since the area of salt affected soils is expected to increase in future. Opportunities, limits and requirements of satellite based rapid change detection and salt classification are discussed.
1 Introduction
20
Organic compounds containing halogens – especially chlorine – have been considered for a long time to be of industrial origin only, and it was assumed that humans could eas-ily control the production and emission of these compounds in case they would cause a threat for life on Earth. Recent environmental problems such as stratospheric ozone destruction and the increasing pollution of the biosphere through volatile organohalo-25
BGD
8, 7525–7550, 2011Organohalogens from saline environments
K. Kotte et al.
Title Page
Abstract Introduction
Conclusions References
Tables Figures
◭ ◮
◭ ◮
Back Close
Full Screen / Esc
Printer-friendly Version Interactive Discussion
Discussion
P
a
per
|
Dis
cussion
P
a
per
|
Discussion
P
a
per
|
Discussio
n
P
a
per
|
feedbacks on cloud formation, Earth’s albedo and eventually the regional and global climate.
Since the middle of the 70’s it became clear that some reactive organohalogens are purposefully produced by nature e.g. in soils and sediments of hyper-saline salt lakes (Winterton, 2000; Gribble, 2010; Sch ¨oler and Keppler, 2003; Weissflog et al., 2005). 5
To date, the natural production of more than 4714 different organohalogens is known, involving biogeochemical, biochemical and microbial processes (Gribble, 2010). This includes de-novo producers like fungi, halophilic bacteria and archaea, plants, animals, and insects.
In addition to volatile alkyl halides and polar organohalogens such as haloacetates, 10
there is evidence that even semi-volatile organohalogens can be naturally formed from humic substances through abiotic geochemical processes. For instance nature’s pro-duction of chloromethane (5–6 Mt) exceeds the anthropogenic propro-duction (50 Kt) by a factor of 100 (WMO, 2007).
While anthropogenic organohalogen pollution is certainly an important issue and the 15
ban of some compounds as stipulated in international treaties have to be carefully con-trolled, it is high time to commence with a comprehensive study of the natural release of organohalogen species, in particular to the lower atmosphere and the terrestrial environment. The importance of very short-lived halogenated substances (VSLS) for the budget of stratospheric bromine was emphasized by WMO (2007). Many of these 20
VSLS are of natural origin.
Relevant data on the quantity and variety of low molecular weight organohalogens in the terrestrial environment are limited. This compartment receives significant fluxes of inorganic halides via the deposition of sea salt aerosols and from combustion pro-cesses, and in addition from weathering processes of rocks. Due to the lower con-25
BGD
8, 7525–7550, 2011Organohalogens from saline environments
K. Kotte et al.
Title Page
Abstract Introduction
Conclusions References
Tables Figures
◭ ◮
◭ ◮
Back Close
Full Screen / Esc
Printer-friendly Version Interactive Discussion
Discussion
P
a
per
|
Dis
cussion
P
a
per
|
Discussion
P
a
per
|
Discussio
n
P
a
per
|
There have been a number of studies that have dealt with the release of organohalo-gens from coastal marshes and other wetlands, where halogenation was suggested to depend on fungal and bacterial activity (e.g. von Glasow and Crutzen, 2007). Be-sides biotic formation of organohalogens there is also increasing evidence of an abiotic formation in soils involving humic substances and iron (Keppler et al., 2000, 2004; Hu-5
ber et al., 2009). Although the exact mechanisms leading to the abiotic formation of organohalogens, e.g. the potential role of radicals and reactive humic and Fe species are still not fully understood.
There is a number of studies that tried to come up with budgets for longer-lived halo-carbons, mainly of interest for stratospheric chemistry, including emissions from peat-10
lands (e.g. Dimmer et al., 2001), wetlands (Varner et al., 1999), salt marshes (Rhew et al., 2000), and terrestrial vegetation (Yokouchi et al., 2000, 2002; Hamilton et al., 2003). It is not clear if further polyhalogenated C1-organohalogens such as CH2Cl2,
CHCl3, and CCl4 or even C2-organohalogens such as tri- and tetrachloroethene are formed during the decomposition of dead organic matter in soil.
15
Research has so far mainly focussed on regions polluted by humans and on coastal areas. Thus the global source strengths of organohalogens from soils and vegetation are poorly constrained. Keppler et al. (2005) highlighted the need for a better quantifi-cation of long-lived halomethanes such as CH3Cl and CH3Br from recently discovered,
additional natural terrestrial sources. For example, Wishkerman et al. (2008) eluci-20
dated the reaction of plant pectin with bromide forming CH3Br. This appears abiotically
at ambient temperatures with the observed emission to doubled with every 5◦C rise.
Elevated concentrations of CH3Br and CHCl3 have been proven for hyper-saline sedi-ments of southern Russian and Kalmykian salt lakes (Weissflog et al., 2005). These re-sults have important implications for the VOX release from vegetation and soils located 25
BGD
8, 7525–7550, 2011Organohalogens from saline environments
K. Kotte et al.
Title Page
Abstract Introduction
Conclusions References
Tables Figures
◭ ◮
◭ ◮
Back Close
Full Screen / Esc
Printer-friendly Version Interactive Discussion
Discussion
P
a
per
|
Dis
cussion
P
a
per
|
Discussion
P
a
per
|
Discussio
n
P
a
per
|
water content, and organic content.
Some VOX or their metabolic degradation products exhibit a phytotoxic potential, where infected plants show increased plant transpiration, early senescence, decreased plant growth and overall lower plant vitality. Especially in combination with drought stress episodes and soil salting this can accelerate desertification.
5
Thus, the emission and deposition of VOX to and from the atmosphere can strongly influence the functioning of terrestrial ecosystems (e.g. Lange et al., 2004).
Beside the intensified public discussion on the trustability of climate models and their outcomes, there is no doubt that the predicted climate change will send his first indica-tions within the next few decades. Towards the end of the 21st century a clear increase 10
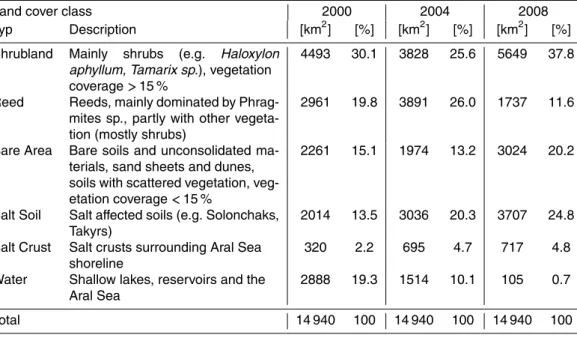
of dry areas is expected for Middle Asia as well as for Africa, as shown in Fig. 1. For both regions the current situation of land degradation and desertification becomes more problematic due to a constant anthropogenic influence, such as overgrazing, pol-lution and physical overstraining. In some regions the proposed climate change will lead in consequence of higher temperature, more frequent heat waves, lower rainfall 15
and higher evaporation to an increase in quantity and scale of hyper-saline salt lakes, salty soils and salt-dust storms. Due to their negative water budget most recent semi-/arid regions are characterized by vast evaporates (salt lakes) and salty soils. Thus number and size of saline ecosystems will increase from the time when deserts and semi-deserts start spreading, as it observable e.g. in Middle Asia.
20
In consequence the question emerges whether and how recent and future saline terrestrial ecosystems will have an impact on global VOX budget, including seasonal effects like dissolving of halite minerals during rain events followed by recrystallization, as well as annually shifting soil temperature and soil humidity.
For the first time this study aims to combine remote sensing and VOX emission data 25
to examine the potential of satellite products for estimation of regional VOX emission loads from hyper-saline environments.
BGD
8, 7525–7550, 2011Organohalogens from saline environments
K. Kotte et al.
Title Page
Abstract Introduction
Conclusions References
Tables Figures
◭ ◮
◭ ◮
Back Close
Full Screen / Esc
Printer-friendly Version Interactive Discussion
Discussion
P
a
per
|
Dis
cussion
P
a
per
|
Discussion
P
a
per
|
Discussio
n
P
a
per
|
ecosystems. Obviously satellite based remote sensing seems to be the method of choice, since the knowledge on spatial distribution and dynamic of surface salt types allows to extrapolate small scale VOX emission data to regional and global scales.
Within this study hyper-saline ecosystems of different geographical origin, different geochemical character and different development states have been compared for VOX 5
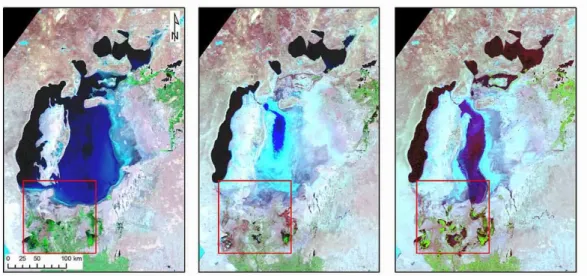
production potential. The Central Asian Aralkum, whose soils have been tested for VOX production, serves as a perfect example for a highly dynamic, spreading saline ecosystem, composed of hyper saline crusts and saline soils which appeared after desiccation of the Aral Sea (Fig. 2). Additionally remote sensing based analysis was performed in the southern Aral Sea basin, providing information of main soil types as 10
well as their extent and spatial and temporal evolution.
2 Methods
2.1 Study Area
The study area (Figs. 2 and 3) is located within the autonomous Republic of Karakalpakstan (Uzbekistan), covering an area of approximately 15 000 km2. With the 15
regression of the fourth largest sea of the world, a huge new saline desert emerged on the former seabed, which is called the “Aralkum” (Breckle et al., 2001). Former harbour cities like Muynak (Uzbekistan) are now located tens of kilometers away from the present shoreline. From a ecological point of view, it is considered as the world’s largest area where primary succession is taking place (Wucherer and Breckle, 2001). 20
Decreasing water flow in the Amu Darya river (the Oxus of ancient times) caused dra-matic loss of wetlands and the associated reed communities in the rich ecosystem of the Amu Darya river delta (Sivanpillai and Latchininsky, 2007). The shrinking Aral Sea exposed about 50 000 km2 of its former seabed (Micklin, 2007), which shows a wide variety of different landscape and soil types. The major part of the desiccated seabed 25
BGD
8, 7525–7550, 2011Organohalogens from saline environments
K. Kotte et al.
Title Page
Abstract Introduction
Conclusions References
Tables Figures
◭ ◮
◭ ◮
Back Close
Full Screen / Esc
Printer-friendly Version Interactive Discussion
Discussion
P
a
per
|
Dis
cussion
P
a
per
|
Discussion
P
a
per
|
Discussio
n
P
a
per
|
desertification and eolian erosion (Dukhovny et al., 2008). Salt affected areas in partic-ular appear after recession (e.g. a wide variety of Solonchaks and Takyrs), which are considered as a major source for salt – and dust storms in the region (Razakov and Kosnazarov, 1996; Orlovsky et al., 2001; Singer et al., 2003; Mees and Singer, 2006).
2.2 Monitoring land cover dynamics
5
Classification of Terra MODIS time-series was performed to assess the land cover dy-namics in the study area between 2000 and 2008 and to monitor different stages of soil salinization. The MOD09 8-day Surface Reflectance Data of the Terra MODIS satel-lite (Moderate Resolution Imaging Spectroradiometer) was chosen as primary data source. Seven spectral bands, centered at 648 nm, 858 nm, 470 nm, 555 nm, 1240 nm, 10
1640 nm, and 2130 nm respectively, were processed to obtain the full spectral range and improve class separability. The almost daily availability of MODIS satellite images since the year 2000 enables recording landscape dynamics in a very high temporal resolution. Ground reference data for classification of satellite images were collected during field surveys in the study area in 2007, 2008 and 2009 in accordance to the FAO 15
LCCS (Land Cover Classification System), whereas 650 ground reference points were collected, including photos of the sampling sides, vegetation mapping and important soil characteristics. A quality assessment of the input data was performed, using the TiSeG software (Time Series Generator) (Colditz et al., 2008). Additional input infor-mation for the classification procedure was provided through the calculation of the NDVI 20
(Normalized Differentiated Vegetation Index) and several band ratios where tested and evaluated for their potential to improve discriminating salt affected areas. Besides data noise, time series exhibit significant temporal autocorrelation. In order to reduce the re-dundancy in feature space, metrics (basic statistics such as mean, standard deviation, minimum, maximum, and range) were calculated and further used as baseline dataset 25
BGD
8, 7525–7550, 2011Organohalogens from saline environments
K. Kotte et al.
Title Page
Abstract Introduction
Conclusions References
Tables Figures
◭ ◮
◭ ◮
Back Close
Full Screen / Esc
Printer-friendly Version Interactive Discussion
Discussion
P
a
per
|
Dis
cussion
P
a
per
|
Discussion
P
a
per
|
Discussio
n
P
a
per
|
with the QUEST algorithm (Quick Unbiased Efficient Statistical Tree) (Loh and Shih, 1997), which is implemented in the software add-on “RuleGEN 1.02” running in the standard image processing environment “ENVI” (ITT Visual Information Solutions).
The classification results were used to perform a post-classification change-detection analysis for the time steps 2000–2004, 2004–2008 and 2000–2008. The 5
approach used in this study provides “from-to” change information and the kind of landscape transformation that have occurred. The land-cover change areas between the different classes were then calculated. Validation was performed using an inde-pendent sample of validation points to assess classification accuracy. Validation points from 2008 were measured directly in the field, whereas for 2000 and 2004, validation 10
points were randomly generated and evaluated visually using Landsat TM imagery and NDVI temporal signatures. For further details of the method see L ¨ow et al. (2011).
2.3 Soil chemistry and VOX emission
Soil samples for VOX analysis have been taken in May 2009. After pre-screening cer-tain soil types in the study area using Landsat 5 TM classification based soil maps 15
(Dukhovny et al., 2008), specific sample sites have been selected during travelling several transects, focusing on unaffected natural topsoil. Three topsoil profiles were sampled for each site: 0–2 cm, 2–4 cm and 4–6 cm. Where available the soil/salt crusts were additionally sampled between 0–0.5 cm. The sampling scheme may not fulfil ge-ological requirements, but allows comparing sample sites around the globe. Sampling 20
sites were positioned by means of GPS measurements including photos of the sam-pling sites, soil surface characterization and geo-botanic mapping by a standardized form sheet based on LCCS.
Soil samples where kept cool and shipped to Heidelberg (Germany), then freeze dried and milled. XRD analyses have been performed applying a Bragg-25
BGD
8, 7525–7550, 2011Organohalogens from saline environments
K. Kotte et al.
Title Page
Abstract Introduction
Conclusions References
Tables Figures
◭ ◮
◭ ◮
Back Close
Full Screen / Esc
Printer-friendly Version Interactive Discussion
Discussion
P
a
per
|
Dis
cussion
P
a
per
|
Discussion
P
a
per
|
Discussio
n
P
a
per
|
Elementar/Germany), respectively a carbonate bomb (M ¨uller and Gastner, 1971). Determination of VOX production in topsoil samples followed the procedure de-scribed by Huber et al. (2009). In brief, dried and milled soil samples were transferred to 20 ml headspace glass vials and incubated for up to 24 h at 40◦C. After incubation
the VOX production has been determined using a custom made purge & trap system, 5
connected to a gas chromatograph with mass spectrometer (Varian STAR 3400 GC and Saturn 2000 ion trap MS). To discover the effect of soil humidity different assays have been performed, adding distilled water to selected soil samples or directly testing the dried soil.
3 Results
10
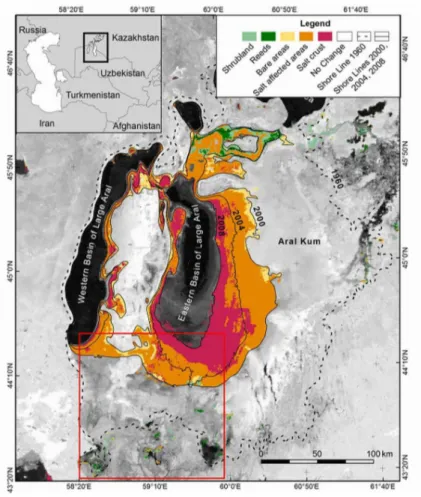
Using MODIS time series and supervised image classification, different stages of salin-ization were classified for the years 2000, 2004 and 2008, ranging from salt crusts within a narrow stripe adjacent to the see, to extensive Solonchaks an almost salt free sand sheets. Overall accuracies were consistently high with 82.8 %, 81.5 % and 79.5 %, and Kappa statistics of 78 %, 77 % and 73 %, respectively. It is shown that 15
the recession of the Aral Sea results in a quick build up of extensive salt crust directly adjacent to the sea. Almost all of these salt crusts converted into a series of different Solonchak types and then, in some parts of the area, further into almost sand free bare areas. This trend was found to occur within 8 years at some locations, demonstrating that a significant proportion of the former seabed features highly unstable surface types 20
BGD
8, 7525–7550, 2011Organohalogens from saline environments
K. Kotte et al.
Title Page
Abstract Introduction
Conclusions References
Tables Figures
◭ ◮
◭ ◮
Back Close
Full Screen / Esc
Printer-friendly Version Interactive Discussion
Discussion
P
a
per
|
Dis
cussion
P
a
per
|
Discussion
P
a
per
|
Discussio
n
P
a
per
|
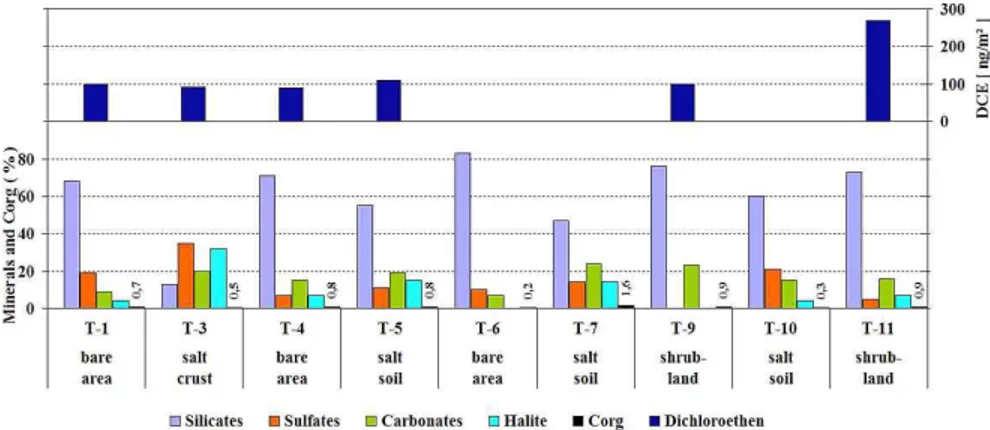
Mineral content of the 0–2 cm topsoil layer only, including salt crusts, have been de-termined for selected sites within the study area (compare to Fig. 3). The composition of main minerals, calculated through XRD semi-quantitative analysis is given in Fig. 4. All locations, except T3, are dominated by SiO2-Minerals (sand: 47–83 %). Location T3
itself is situated within the rapid developping salt crusts surrounding the residual water 5
body of Aral Sea and is dominated by precipitated salts (sulphates 35 %, halides 32 %, carbonates 20 %). Compared to that T6 represents typical sandy topsoils dominated by 83 % silicates with only 10 % sulfates and 7 % carbonates. The area surrounding T6 dried out very recently and is a region that’s influenced by accumulation of sand and aeolian dust. Locations T7 and T5 can be seen in an intermediate class with∼50 % 10
silicates, versus ∼20 % carbonates and∼15 % halide. Both sites are being flooded regularly (T7, storage lake Sudochie) or constantly influenced by increased soil humid-ity and elevated level of saline groundwater (T5, next to old, temporally flooded dam). Through capillary power these humid soil accumulates salt at the soil surface, forming distinct crusts of several mm thickness.
15
Soil organic content, mainly important for VOX production, only reached very limited amounts. The lower limits with 0.2 %, 0.3 % and 0.5 % were found for recently dry-fallen sandy soils T6 and T10, as well as the lately appeared salt crusts of T3. Highest Corg values were found in dry sediments of the water reservoir Sudochie, location T7. Accordingly T7 has to be compared carefully with other “salt soils” in the study area 20
– e.g. T5 and T10, which gave the similar RS-signal but provide different hydrological features.
VOX emission experiments were performed at each 0–2 cm level. As shown in Fig. 4 most soil samples produce dichloroethene (DCE) in the range of 100 ng m−2
within 24 h after humidification. DCE serves as proxy for further VOX such as halogenated 25
BGD
8, 7525–7550, 2011Organohalogens from saline environments
K. Kotte et al.
Title Page
Abstract Introduction
Conclusions References
Tables Figures
◭ ◮
◭ ◮
Back Close
Full Screen / Esc
Printer-friendly Version Interactive Discussion
Discussion
P
a
per
|
Dis
cussion
P
a
per
|
Discussion
P
a
per
|
Discussio
n
P
a
per
|
production process is still pending. DCE might also be produced through degradation of higher chlorinated precursors such as tri- and tetrachloroethene and trichloroethane, since recent research has revealed chemically-precipitated ferrous iron to act as an abiotic active reductant for VOX (e.g. Brown et al., 2009).
Regarding Fig. 4 the newly formed sandy soils of the locations T6 and T10 do not 5
show any DCE formation, which meets the findings of very low Corg content.
Surpris-ingly soil T7, which shows highest measured Corg contents and provides favourable high soil humidity did not display any DCE production as well. On the other hand T11, a rather sandy soil type, but several ten years matured after desiccation, reached high-est DCE values. T11 is situated southeast of Muynak and lies within the former Amu 10
Darya river delta. Desiccation after 1970–1980 and regularly flooding during spring time was followed by usage for live-stock feeding. However, the driver behind DCE production and possible counterproductive factors remains unclear.
Employing dichloroethene as agent for a rough estimation of regional VOX emis-sion potential, the land cover class data of Tabel 1 are combined with the DCE for-15
mation data of Fig. 4. Resulting calculated DCE emission data for the years 2000, 2004 and 2008 displays Table 2. Emission data refer to a 24 h production time under the favourable condition of a moist soil system (e.g. after flooding or rain events) and elevated summer temperatures of 25–35◦C air temperature, resulting in a topsoil
tem-perature of up to 50◦C. Due to di
fficult sampling conditions close to the remaining water 20
body, no samples could be taken for the land cover class “Water”. Land cover class “Reed” was not included as well. For class “Shrubland” and “Bare areas” more than one sample was taken. Their corresponding emission loads vary drastically between the different samples sites, but all of them have been classified to the same land cover class. Obviously there are limits in the applied land cover classifying method, since it 25
BGD
8, 7525–7550, 2011Organohalogens from saline environments
K. Kotte et al.
Title Page
Abstract Introduction
Conclusions References
Tables Figures
◭ ◮
◭ ◮
Back Close
Full Screen / Esc
Printer-friendly Version Interactive Discussion
Discussion
P
a
per
|
Dis
cussion
P
a
per
|
Discussion
P
a
per
|
Discussio
n
P
a
per
|
emission up to 23 t dichloroethene within the research area of 15 000 km2. This number will be increased when applying the method to the remaining salt affected soils of the 50 000 km2ranging Aralkum and the surrounding salt affected soils.
Expanding the production time to the whole spring season, with its high temperatures but still moist soil system, can theoretically end in production of several thousand tons 5
of DCE towards the beginning of wintertime.
Furthermore, referring to earlier findings of elevated VOX production in hyper-saline sediments of halite precipitating lake systems (Weissflog et al., 2005) the emission load may increase dramatically if the emission data for the remaining hyper-saline water body of the Aral Sea can be included.
10
Including emission data of the deeper soil layers will further top up the overall pro-duction.
Since DCE is only one agent for a range of chemical substances, the total VOX emission loads can easily increase exponentially when including other halogenated organic compounds.
15
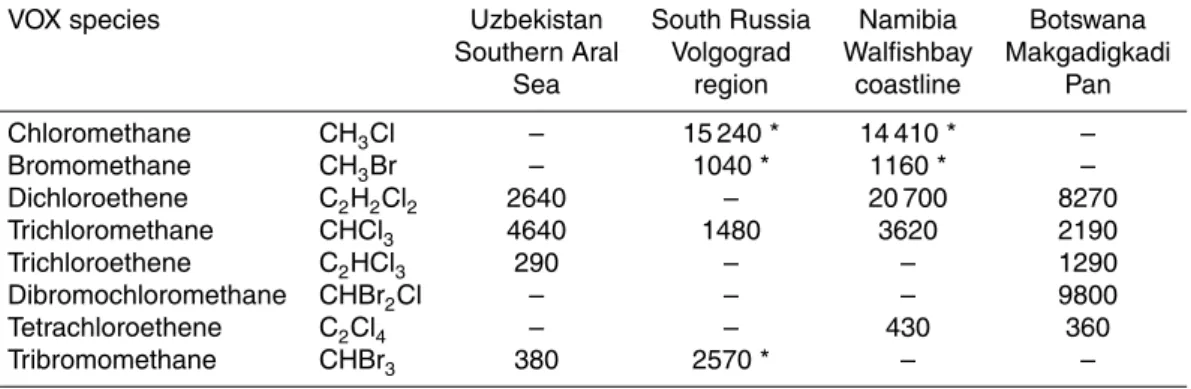
To stress the global relevance of hyper-saline environments as natural VOX sources typical emission data from saline sediments in southern and northern Africa, as well as southern Russia and middle Asia are combined in Table 3.
Saline sediments at the Namibian coastline as well as the Makgadikgadi salt flats in central Botswana outrange the DCE production of the former sediments of Aral 20
Sea. Halogenated C1-compounds like CHCl3 and CHBr3 occur consistently (also re-ported by Weissflog et al., 2005), whereas others seem to be specific to one location – e.g. CHBr2Cl for Botswana.
Interestingly VOX emissions such as CH3Cl and CH3Br were also found under dry condition. The underlying production scheme might have similarities to the pectin hy-25
BGD
8, 7525–7550, 2011Organohalogens from saline environments
K. Kotte et al.
Title Page
Abstract Introduction
Conclusions References
Tables Figures
◭ ◮
◭ ◮
Back Close
Full Screen / Esc
Printer-friendly Version Interactive Discussion
Discussion
P
a
per
|
Dis
cussion
P
a
per
|
Discussion
P
a
per
|
Discussio
n
P
a
per
|
Including these findings an efficient VOX production is no longer bound to rain events and flooding, in fact a VOX emission throughout the whole year becomes likely, particularly for southern African saline ecosystems.
4 Conclusions
The main question is: How can VOX emission be extrapolated from small-scale soil 5
measurements to landscape scale? Synergistic use of VOX emission data and remote sensing products have first been proven to be a suitable approach for estimating the VOX production in saline ecosystems as well as extrapolation of field measurements to larger scales. The applied setup reproduces a short-term change in climatic conditions starting from dried-out saline soil, instantly humidified during rain events or flooding. 10
Considering halide concentrations (Cl−
, Br−
) as one of the major driving forces to VOX emission, a future scenario of increased VOX emission becomes likely for Central Asia and particularly for the Aralkum.
But at this stage the applied method still contains large uncertainties regarding the accuracies of land cover classification with focus on salt composition and soil humidity. 15
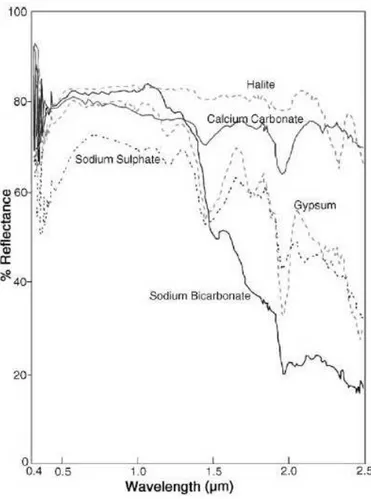
Several salt types show different spectral profiles (Fig. 5), which can be measured by means of remote sensing data (Ben-Dor et al., 2002; Hunt et al., 1972). Highly saline soils can be distinguished from low or even non-saline soils as reported by Metternich and Zinck, (2003 and 2009). But, since the emission of VOX is mainly connected to surface salt composition, a higher level of detail is needed to calculate the soil classes 20
with sufficient accuracy.
The future challenge is to detect rapid changes in surface composition and land cover of saline environments, with adequate precision and at different temporal and spatial scales (e.g. salt type, dissolving and re-crystallization following rain events). This in-cludes evaluating the capacity of hyper spectral data to discriminate saline ecosystem 25
BGD
8, 7525–7550, 2011Organohalogens from saline environments
K. Kotte et al.
Title Page
Abstract Introduction
Conclusions References
Tables Figures
◭ ◮
◭ ◮
Back Close
Full Screen / Esc
Printer-friendly Version Interactive Discussion
Discussion
P
a
per
|
Dis
cussion
P
a
per
|
Discussion
P
a
per
|
Discussio
n
P
a
per
|
rates, a multi-scale classification system has to be implemented, including sensors with different spatial and temporal resolution.
Future purposes are: (i) to quantify VOX emission from saline ecosystems and to de-termine their driving environmental parameters; (ii) spatial extrapolation of these envi-ronmental parameters through classification of different salt types (e.g. sulphate versus 5
halide) and of small-scale surface heterogeneities; (iii) to extrapolate these parameters to larger scales using remote sensing and to verify rapid changing climate condition; (iv) to assess spatial and temporal variability as baseline information for; (v) modelling of landscape evolution and VOX emission budgets.
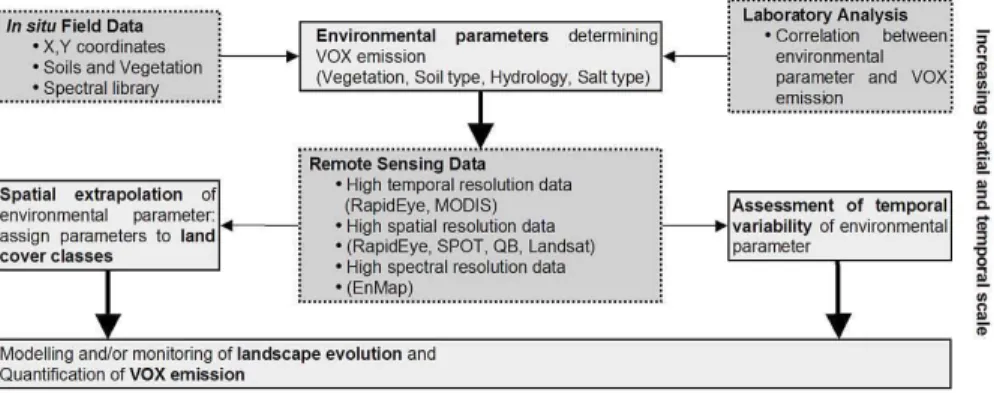
A combination of data from field surveying, laboratory analysis and remote sensing 10
has to be used in future studies. Information on VOX emission will be obtained from field surveys and subsequent laboratory analysis. Spectroscopic data will be obtained with a field spectrometer during field campaigns, whereas site-specific libraries will be created. The libraries will contain spectral information for the most representative surface components combined with soil sample analysis (e.g. pH and chemical compo-15
sition), vegetation classification, and topographic and meteorological data. A possible methodological procedure is summarized in Fig. 6.
Critical steps can be expected (i) when correlating environmental parameters with VOX emission and (ii) when assigning VOX emission to distinct land cover classes, which are directly or indirectly influenced by these parameters and distinguishable by 20
means of remote sensing. A final step would be monitoring of past and future land-scape evolution, including rapid change assessment, and modelling of VOX emission. This would allow for spatial and temporal quantification of VOX emitted from whole saline ecosystems e.g. the spreading Aralkum desert in Central Asia.
Acknowledgements. This study was carried out within the context of the HALOPROC project
25
BGD
8, 7525–7550, 2011Organohalogens from saline environments
K. Kotte et al.
Title Page
Abstract Introduction
Conclusions References
Tables Figures
◭ ◮
◭ ◮
Back Close
Full Screen / Esc
Printer-friendly Version Interactive Discussion
Discussion
P
a
per
|
Dis
cussion
P
a
per
|
Discussion
P
a
per
|
Discussio
n
P
a
per
|
References
Ben-Dor, E.: Quantitative remote sensing of soil properties, Adv. Agro. Academic Press, 75, 173–243, doi:10.1016/S0065-2113(02)75005-0, 2002.
Breckle, S.-W., Wucherer, W., Agachanjanz, O., Geldyer, B.: The Aral Sea crisis region, in: Sus-tainable Land Use in Deserts., edited by: Breckle, S.-W., Veste, M., Wucherer, W., Springer,
5
Berlin Heidelberg New York, 27–37, 2001.
Brown, R. A., Mueller, J. G., Seech, A. G., Henderson, J. K., Wilson, J. T.: Interactions Between Biological and Abiotic Pathways in the Reduction of Chlorinated Solvents, Remediation, Win-ter 2009.
Colditz, R. R., Conrad, C., Wehrmann, T., Schmidt, M., and Dech, S.: TiSeG: flexible Software
10
Tool for Time-Series Generation of MODIS Data Utilizing the Quality Assessment Science Data Set. – in: IEEE Transactions on Geoscience and Remote Sensing, 46(10), 3296–3308, 2008.
Dehaan, R. and Taylor, G. R.: Image-derived spectral endmemders as indicators of salinisation, Int. J. Remote Sens., 24, 775–794, 2002a.
15
Dehaan, R. L. and Taylor, G. R.: Field-derived spectra of salinized soils and vegetation as indicators of irrigation-induced soil salinization, Remote Sens. Environ., 80, 406–417, 2002b. Defries, R., Hansen, M., and Townshend, J. R. G.: Global discrimination of land cover types
from metrics derived from AVHRR pathfinder data, in: Remote Sens. Environ., 54. 209–222, 1995.
20
Drake, N. A.: Reflectance spectra of evaporite minerals (400–2500 nm). applications for remote sensing, Inter. J. Remote Sens., 16, 2555–2571, 1995.
Dukhovny, V. A., Navratil, P., Rusiev, I., Stulina, G., and Roshenko, Y. E.: Comprehensive remote sensing and ground based studies of the dried Aral Sea bed, Tashkent: Scientific-Information Center ICWC, 2008.
25
Gribble, G. W.: Naturally occurring organohalogen compounds – A comprehensive update, Springer Verlag, Wien New York., 2010.
Hansen, M. C., DeFries, R. S., Townshend, J. R. G., and Sohlberg, R. A.: Global land cover classification at 1 km spatial resolution using a classification tree approach, Inter. J. Remote Sens., 21(6–7), 1331–1364, 2000.
30
BGD
8, 7525–7550, 2011Organohalogens from saline environments
K. Kotte et al.
Title Page
Abstract Introduction
Conclusions References
Tables Figures
◭ ◮
◭ ◮
Back Close
Full Screen / Esc
Printer-friendly Version Interactive Discussion
Discussion
P
a
per
|
Dis
cussion
P
a
per
|
Discussion
P
a
per
|
Discussio
n
P
a
per
|
Tech., 43, 4934–4939, 2009.
Hunt, G. R., Salisbury, J. W., and Lenhoff, C. J.: Visible and Near-Infrared Spectra of Minerals and Rocks: V. Halides, Phosphates, Arsenates, Vanadates and Borates, Modern Geology 3, 121–132, 1972.
Keppler, F., Harper, D. B., Ro ¨ockmann, T., Moore, R. M., and Hamilton, J. T. G.: New insight into
5
the atmospheric chloromethane budget gained using stable carbon isotope ratios, Atmos. Chem. Phys., 5, 2403–2411, doi:10.5194/acp-5-2403-2005, 2005.
Lange, Ch. A., Weissflog, L., Strasser, R. J., Krueger, G., and Pfennigsdorff, A.: Phytotoxic Effects of Trichloroacetic Acid on Scots Pine and Birch Determined by Chlorophyll a Fluores-cence and the JIP-Test. S. A. J. Bot., 70(5), 683-694, 2004.
10
L ¨ow, F., Navratil, P., and Bubenzer, O.: Landscape Dynamics in the Southern Aralkum Desert – Using MODIS Time Series for Land Cover Change Analysis, in: Aralkum – A Man-made Desert, edited by: Breckle, S.-W., Wucherer, L., Dimeyeva, L., and Ogar, N .P., Ecological Studies, Springer, 2011.
Metternich, G. I. and Zinck, J. A.: Remote sensing of soil salinity: potentials and constraints,
15
Remote Sens. Environ., 85, 1–20, 2003.
Metternich, G. and Zinck, J. A.: Remote Sensing of Soil Salinization, CRC Press, 2009. Mees, F. and Singer, A.: Surface crusts on soils/sediments of the southern Aral Sea basin,
Uzbekistan, Geoderma, 136, 152–159, 2006.
M ¨uller, G. and Gastner, M.: The “Karbonat-Bombe”, a simple device fort he determination of
20
the carbonate content in sediments, soils and other materials, N. Jb. Miner. Mh., 466–469, 1971.
Micklin, P. P.: The Aral Sea Disaster, Annu. Rev. Earth Pl. Sc., 35, 47–72, 2007.
Orlovsky, N., Glantz, M., and Orlovsky, L.: Irrigation and Land Degradation in the Aral Sea Basin, in: Sustainable Land Use in Deserts, edited by: Breckle, S. W., Veste, M., and
25
Wucherer, W., Springer, 52–69, 2001.
Razakov, R. and Kosnazarov, K.: Dust and salt transfer from the exposed bed of the Aral Sea and measures to decrease its environmental impact, in: The Aral Sea Basin, edited by: Micklin, P. P. and Williams, W. D., NATO ASI Series, 2., Env., 12, 95–103, 1996.
Schmid, T., Koch, M., Gumuzzio, J., and Mather, P. M.: A spectral library for a semi-arid wetland
30
and its application to studies of wetland degradation using hyperspectral and multispectral data, Inter. J. Remote Sens., 25(13), 2485–2496, 2004.
BGD
8, 7525–7550, 2011Organohalogens from saline environments
K. Kotte et al.
Title Page
Abstract Introduction
Conclusions References
Tables Figures
◭ ◮
◭ ◮
Back Close
Full Screen / Esc
Printer-friendly Version Interactive Discussion
Discussion
P
a
per
|
Dis
cussion
P
a
per
|
Discussion
P
a
per
|
Discussio
n
P
a
per
|
characteristics in semiarid environments (Central Spain),d IEEE T. Geosci. Remote, 43, 11, 2005.
Schneider, J., Grosse, G., and Wagner, D.: Land cover classification of tundra environments in the Arctic Lena Delta based on Landsat 7 ETM+data and its application for upscaling of methane emissions, Remote Sens. Environ., 113, 380–391, 2009.
5
Singer, A., Zobeck, T., Poberrezky, L., Argaman, E.: The PM10 and PM2.5 dust generation potential of soils/sediments in the Southern Aral Sea Basin, Uzbekistan, J. Arid Envir., 54, 705–728, 2003.
Sivanpillai, R. and Latchininsky, V.: Mapping locust habitats in the Amudarya river delta, Uzbek-istan with multi-temporal MODIS imagery, Environ. Manage., 39, 876–886, 2007.
10
Weissflog, L., Lange, C. A., Pfennigsdorf, A., Kotte, K., Elansky, N., Lisitzyna, L., Putz, E., and Krueger, G.: Sediments of salt lakes as new source of volatile highly chlorinated C1/C2 hydrocarbons, Geophys. Res. Lett., 32(1), L01401, doi:10.1029/2004GL020807, 2005. Williams, W. D.: Environmental threats to salt lakes and the likely status of inland saline
ecosys-tems in 2025, Environ. Conserv., 29, 154–167, doi:10.1017/S0376892902000103, 2002.
15
Wishkerman, A., Gebhardt, S., McRoberts, C. W., Hamilton, J. T. G., Williams, J., and Kep-pler, F.: Abiotic methyl bromide formation from vegetation and its strong dependence on temperature, Environ. Sci. Technol., 42(18), 6837–6842, doi:10.1021/es800411j, 2008. Wucherer, W. and Breckle, S.-W.: Vegetation Dynamics on the Dry Sea Floor of the Aral Sea,
in: Sustainable land use in deserts, edited by: Breckle, S.-W., Veste, M., and Wucherer, W.,
20
BGD
8, 7525–7550, 2011Organohalogens from saline environments
K. Kotte et al.
Title Page
Abstract Introduction
Conclusions References
Tables Figures
◭ ◮
◭ ◮
Back Close
Full Screen / Esc
Printer-friendly Version Interactive Discussion
Discussion
P
a
per
|
Dis
cussion
P
a
per
|
Discussion
P
a
per
|
Discussio
n
P
a
per
|
Table 1. Matrix of land cover change derived from MODIS time series classification. Area statistics for 2000, 2004 and 2008.
Land cover class 2000 2004 2008
Typ Description [km2] [%] [km2] [%] [km2] [%]
Shrubland Mainly shrubs (e.g. Haloxylon
aphyllum, Tamarix sp.), vegetation
coverage>15 %
4493 30.1 3828 25.6 5649 37.8
Reed Reeds, mainly dominated by Phrag-mites sp., partly with other vegeta-tion (mostly shrubs)
2961 19.8 3891 26.0 1737 11.6
Bare Area Bare soils and unconsolidated ma-terials, sand sheets and dunes, soils with scattered vegetation, veg-etation coverage<15 %
2261 15.1 1974 13.2 3024 20.2
Salt Soil Salt affected soils (e.g. Solonchaks, Takyrs)
2014 13.5 3036 20.3 3707 24.8
Salt Crust Salt crusts surrounding Aral Sea shoreline
320 2.2 695 4.7 717 4.8
Water Shallow lakes, reservoirs and the Aral Sea
2888 19.3 1514 10.1 105 0.7
BGD
8, 7525–7550, 2011Organohalogens from saline environments
K. Kotte et al.
Title Page
Abstract Introduction
Conclusions References
Tables Figures
◭ ◮
◭ ◮
Back Close
Full Screen / Esc
Printer-friendly Version Interactive Discussion
Discussion
P
a
per
|
Dis
cussion
P
a
per
|
Discussion
P
a
per
|
Discussio
n
P
a
per
|
Table 2.Estimated dichloroethene production for the 15 000 km2ranging research area, based on 0–2 cm soil profile data. DCE production within 24 h under the favourable condition of a moist soil system and 25–35◦C air temperature. Concentrations are given for each land cover
class in kg DCE/covered area.
Land cover class and DCE Land cover area per class DCE production
corresponding site production [km2] [kg/land cover area]
[g km−2] 2000 2004 2008 2000 2004 2008
Shrubland T9T11 10042703 4493 3828 5649 4511*12 144∗∗ 3843*10 347∗∗ 5672*15 269∗∗
Reed no site n.d. 2961 3891 1737 n.d.∗∗∗ n.d.∗∗∗ n.d.∗∗∗
Bare Area
T1 991 2261 1974 3024 2241∗∗ 1956∗∗ 2997∗∗
T4 889 2010* 1755* 2688*
T6 n.d. n.d.∗∗∗ n.d.∗∗∗ n.d.∗∗∗
Salt Soil
T5 1090 2014 3036 3707 2196 3310 4042
T7 n.d. n.d.∗∗∗ n.d.∗∗∗ n.d.∗∗∗
T10 n.d. n.d.∗∗∗ n.d.∗∗∗ n.d.∗∗∗
Salt Crust T3 915 320 695 717 293 636 656
Water no site n.d. 2888 1514 105 n.d.∗∗∗ n.d.∗∗∗ n.d.∗∗∗
Sum high 16 873 16 249 22 963
Sum mid 9009 9544 13 057
Sum low 4803 4479 6327
BGD
8, 7525–7550, 2011Organohalogens from saline environments
K. Kotte et al.
Title Page
Abstract Introduction
Conclusions References
Tables Figures
◭ ◮
◭ ◮
Back Close
Full Screen / Esc
Printer-friendly Version Interactive Discussion
Discussion
P
a
per
|
Dis
cussion
P
a
per
|
Discussion
P
a
per
|
Discussio
n
P
a
per
|
Table 3.Typical VOX emission characteristic of saline soils sediments of different origin using purge-and-trap GC/MS analysis. 24 h incubation time; moist or dry sediments – ongoing study [g m−2].
VOX species Uzbekistan South Russia Namibia Botswana
Southern Aral Volgograd Walfishbay Makgadigkadi
Sea region coastline Pan
Chloromethane CH3Cl – 15 240 * 14 410 * –
Bromomethane CH3Br – 1040 * 1160 * –
Dichloroethene C2H2Cl2 2640 – 20 700 8270
Trichloromethane CHCl3 4640 1480 3620 2190
Trichloroethene C2HCl3 290 – – 1290
Dibromochloromethane CHBr2Cl – – – 9800
Tetrachloroethene C2Cl4 – – 430 360
Tribromomethane CHBr3 380 2570 * – –
BGD
8, 7525–7550, 2011Organohalogens from saline environments
K. Kotte et al.
Title Page
Abstract Introduction
Conclusions References
Tables Figures
◭ ◮
◭ ◮
Back Close
Full Screen / Esc
Printer-friendly Version Interactive Discussion
Discussion
P
a
per
|
Dis
cussion
P
a
per
|
Discussion
P
a
per
|
Discussio
n
P
a
per
|
Fig. 4. Mineral content and Corg versus dichloroethene (DCE) production. Samples of topsoil layer 0–2 cm (including crusts), incubated for 24 h after adding water. DCE determination by purge & trap headspace GC-MS. Concentrations given in [ng m−2]. Land cover classes of
BGD
8, 7525–7550, 2011Organohalogens from saline environments
K. Kotte et al.
Title Page
Abstract Introduction
Conclusions References
Tables Figures
◭ ◮
◭ ◮
Back Close
Full Screen / Esc
Printer-friendly Version Interactive Discussion
Discussion
P
a
per
|
Dis
cussion
P
a
per
|
Discussion
P
a
per
|
Discussio
n
P
a
per
|