Effect of particle size on nonlinear refractive index of Au nanoparticle in PVA solution
Esmaeil Shahriari, W.Mahmood Mat Yunus,∗ and Elias Saion
Department of Physics, Universiti Putra Malaysia, 43400UPM, Serdang
(Received on 24 March, 2010)
Nonlinear refractive index of Au nanoparticle suspended in PVA solution was measured using a single beam Z-scan technique. Measurements were carried out using a green CW laser beam operated at 532 nm as excitation source. Five nanoparticle samples with different particle sizes were prepared byγradiation method. The Au nano-fluid shows a good third order nonlinear response for particle sizes ranging from 7.0 nm to 18.7 nm. The sign of the nonlinear refractive index was found to be negative and the magnitude was in the order of 10−8 cm2/W. The results show that the nonlinear effect tends to be increased linearly with the increasing of particle sizes thus could be a good candidate for nonlinear optical devices.
Keywords: Nonlinear properties, Z-scan technique, nanoparticles.
1. INTRODUCTION
Nonlinear optical materials have increasing interest over the past twenty years, due to the numerous applications in various fields such as telecommunications, optical data storage and information processing [1]. Metal nanoparti-cles have been studied extensively because of their large third-order nonlinear susceptibilities and nonlinear optical response [2,3] and attractive for many applications such as electronic and optical devices [4], chemical and biological sensors [5–8], optical energy transport [9–12] and thermal therapy [13].
A single beam Z-scan technique developed by the Man-soor Sheik-Bahae et al. in 1990 [14] is a simple and effective tool for determining the nonlinear susceptibility. It has been used widely in material characterization because it provides not only the magnitudes of the real and imaginary parts of the nonlinear susceptibility, but also the sign of the real part [15-18]. This method utilizes a tightly focused laser beam that is intense enough to access nonlinearities in a sample. As the sample passes through the focal point of the beam, changes in its transmittance due to nonlinear absorption (NLA) and nonlinear refraction (NLR) are measured using an open aper-ture and closed aperaper-ture experimental set up, respectively. In the open aperture technique, after the beam passed through the sample, it is focused directly into a detector. As the sam-ple travels through the focus of the initial beam, the transmit-tance either increases or decreases (depending on the nonlin-earity of the sample) and the detector receives more or less light than the linear transmittance, yielding a hump or dip in the curve of transmittance as a function sample position. For NLR, after the beam passing through the sample, it is atten-uated by a semi-closed aperture that usually allows less than 30% of the initial beam to be detected by the detector. The converging and diverging of the beam (allowing more and less of the beam to pass through the aperture, respectively) due to the changes in the refractive index, a pre-focal valley and post-focal peak are observed for a positive change in re-fraction. While a pre-focal peak and a post-focal valley is observed for a negative change in refraction.
The effect of concentration on nonlinear refraction
coef-∗Electronic address:[email protected]
ficient of Au nano-fluid in PVP has been measured and re-ported in our previous work [19]. Since increasing theγ ra-diation dose decreases the particle size of metal nanofluid, it is of our interest to study the effect of particle size on the nonlinear refractive index of such material. Therefore in this paper we report the effect of particle size on nonlinear re-fraction coefficient of Au-PVA nanofluid measured using a single beam Z-scan technique.
2. EXPERIMENTAL
In the present work, hydrogen tetrachloroaurate (III) hy-drate, premion (metals basis), (HAuCl4.3H2O with 99.999% purity), 2.5 g polyvinyl alcohol, PVA (MW 29,000 Aldrish), and 1 ml isopropanol were used for preparing Au nano-fluid sample. The PVA and isopropanol were used as a colloidal stabilizer and hydroxyl radical scavenger, respectively. The PVA solution was made by dissolving PVA powder in 50 ml deionized water at room temperature. The solution was mag-netically stirred for 2 h and was bubbled with nitrogen gas (99.5%) to remove oxygen. Hydrogen tetrachloroaurate (III) hydrate, HAuCl4.3H2O at weight of 2 mg was added into PVA solution to produce Au nano-fluid sample at a concen-tration of 1.471×10⁻⁴M and was subsequently irradiated at different doses ofγ-radiation. Theγ-radiation (60Co-rays) was used as an effective tool for polymerization process and reducing agent. The radiation dose was varied from 10 to 70 kGy to obtain sample with various nanoparticle sizes as listed in Table 1. In this process,γ-irradiation produces hy-drated electrons that reduced the gold ions to gold atoms, which then aggregated to certain size in the solution depend-ing on the exposure time of radiation. The average diam-eters of Au nanoparticles were measured using Nanophox machine (Sympatec GmbH, D-38678) and the TEM mea-surements were carried out to confirm the particle size, shape and uniformity of the specimens. The average particles sizes of the samples are listed in Table 1.
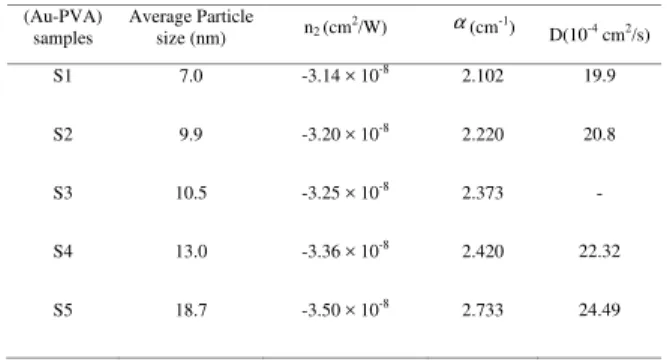
TABLE I: Nonlinear optical properties of Au nano-fluid measured at 532 nm laser beam
(Au-PVA) samples
Average Particle
size (nm) n2 (cm2/W) α(cm-1) D(10-4 cm2/s)
S1 7.0 -3.14 × 10⁻⁸ 2.102 19.9
S2 9.9 -3.20 × 10⁻⁸ 2.220 20.8
S3 10.5 -3.25 × 10⁻⁸ 2.373 -
S4 13.0 -3.36 × 10⁻⁸ 2.420 22.32
S5 18.7 -3.50 × 10⁻⁸ 2.733 24.49
transmitted light in the far field passed through the aperture and was recorded by a detector. All the measurements were carried out at room temperature for both closed aperture and open aperture configurations using a 2 mm sample cell. The linear absorption spectra and thermal diffusivity values of the present samples were measured using UV-Vis spectropho-tometer (Shimadzu-UV1650PC) and a double beam thermal lens method, respectively.
L
Motor track
D
Lock in Amplifier Computer
A S
Laser
FIG. 1: Schematic diagram of Z-scan experimental setup: L- Lens, S- Sample, A- Aperture, D-Detector.
Results and discussion
Figure 2 shows the absorption spectra of the Au nano-fluid prepared using γ-radiation. The measurements of absorp-tion spectra were carried out at room temperature for visible wavelength ranging from 360 nm to 800 nm. The spectra show that the surface plasmon absorption peak appeared at 524 is not affected by the particle size increasing from 7.0 nm to 18.7 nm. The particle size can be controlled by control-ling the doses ofγ-radiation, however in the present work the specimens were prepared at a concentration of 1.471×10⁻⁴ M and irradiated at different doses to produce various parti-cles sizes. Figure 3 displays a typical TEM image showing the particle with a uniform distribution and uniform shape. The average particle size obtained from TEM images was 18.7 nm which agrees very well with the particle size mea-sured using Nanophox machine.
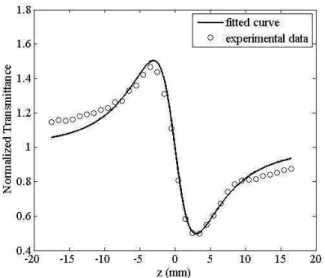
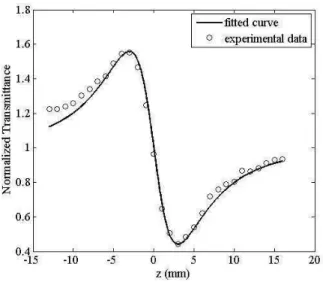
Figures 4-8 show the closed aperture Z-scan curves ob-tained for Au nano-fluid at same concentration but different in particle sizes. The squared symbols represent the exper-imental data while the solid lines are theoretical fits to the
FIG. 2: Absorption spectra of Au nano-particle solution at concen-tration of 1.471×10⁻⁴M and different sizes; S1- 7.0 nm; S2- 9.9 nm; S3- 10.5 nm; S4- 13 nm; S5- 18.7 nm.
FIG. 3: TEM image of Au particles with a nominal size of 18.7 nm.
closed aperture using standard equations given as [14] T(z,∆φ) =1+ 4∆φox
(x2+1) (x2+9) (1)
wherex=z/z0,z0is the Rayleigh length (3.52 mm),∆φ0= kn2I0Le f f, is the phase change due to the nonlinear
absorption coefficient is very small. This was confirmed that all the open aperture Z-scan curves for the present sample are linear (not shown).
FIG. 4: Closed aperture Z-scan experimental curve for (Au-PVA) nano-fluid measured for sample with particle size of 7.0 nm.
FIG. 5: Closed aperture Z-scan experimental curve for (Au-PVA) nano-fluid measured for sample with particle size of 9.9 nm.
The nonlinear refractive index, n2 was calculated from
(∆TP→V), where the value of peak to valley of data
trans-mittance from the closed aperture Z- scan measurement can be described as [14]
∆Tp−v≈0.406(1−s)0.25|∆φo| (2)
Here s is the linear transmittance of the aperture. The nonlin-ear refraction coefficientsn2(cm2/W) together with the val-ues of linear absorption and thermal diffusivity of all samples obtained in the present work are listed in Table 1 and clearly indicates the self-defocusing phenomenon. In Figure 9 we
FIG. 6: Closed aperture Z-scan experimental curve for (Au-PVA) nano-fluid measured for sample with particle size of 10.5 nm.
FIG. 7: Closed aperture Z-scan experimental curve for (Au-PVA) nano-fluid measured for sample with particle size of 13.0 nm.
show the variation of the nonlinear refraction index coeffi-cient as a function of particle sizes. We observed the nonlin-ear refraction coefficient tends to increase linnonlin-early with the increasing of particle sizes. This nonlinear refractive index particle size dependence is totally different with the one cently reported in the literature [19]. Thus the nonlinear re-fraction behaviour of Au-PVA nanofluid was affected by the sample synthesizing technique.
Since the effective thermal nonlinearity of the medium can be written as [20]
nth2 = (dn
dT)
ω2
0
4
α
k
(3) wherek=DρCp,Dis thermal diffusivity of the nanofluid.
FIG. 8: Closed aperture Z-scan experimental curve for (Au-PVA) nano-fluid measured for sample with particle size of 18.7 nm.
N
o
n
li
n
e
a
r R
e
fr
a
c
ti
o
n
C
o
e
ff
ic
ie
n
t
x
1
0
-8 (
c
m
2/W
)
FIG. 9: Nonlinear refractive index as a function of particle size
(Table 1) in which explains the variation of then2with par-ticle size of our experimental results.
3. CONCLUSION
The third order nonlinearity refractive index of Au nano-fluid prepared at different particles sizes has been successful measured using a single beam z scan method. The measure-ment was carried out at room temperature using a CW green laser beam at wavelength 532 nm. The Au nano-fluid showed a good third order nonlinear response. The sign of the non-linear refractive index was found to be negative and the mag-nitude was in the order of 10−8cm2/W. This nonlinear effect increases with the increasing of particles size ranging from 7.0 nm to 18.7 nm.
ACKNOWLEDGEMENTS
This work was supported by Fundamental research grant (01-11-08-664FR/5523664) of MOSTI, Ministry of Science, Technology and Innovation, Malaysia.
[1] Y. Shi, C. Zhang, H. Zhang, J.H. Bechtel, L.R. Dalton, B.H. Robinson, W.H. Steier, Low (Sub-1-Volt) Halfwave Voltage Polymeric Electro-optic Modulators Achieved by Controlling Chromophore Shape, Science. 288 (2000) 119-122.
[2] L.L. Beecroft, C.K. Ober, Nanocomposite Materials for Opti-cal Applications, Chem. Mater. 9 (1997) 1302-1305. [3] Y. Wang, Asymmetric crack problems calculated by the
boundary collocation method, Acc. Chem. Res. 24 (1991) 133-139.
[4] Y. Dirix,C. Bastiaansen, W. Caseri, P. Smith, Oriented pearl-necklace arrays of metallic nanoparticles in polymers: A new route toward polarization-dependent color filters, Adv. Mater. 11 (1999) 223-226.
[5] R. Elghanian, J.J. Storhoff, R.C. Mucic, R. L. Letsinger, C. A. Mirkin, Selective Colorimetric Detection of Polynucleotides Based on the Distance-Dependent Optical Properties of Gold
Nanoparticles, Science. 277 (1997) 1078-1081.
[6] T. Taton, C. Mirkin, R. Letsinger, Scanometric DNA Ar-ray Detection with Nanoparticle Probes, Science. 289 (2000) 1757-1760.
[7] C. Y. Cao, R. Jin, C. A. Mirkin, Nanoparticles with Raman Spectroscopic Fingerprints for DNA and RNA Detection, Sci-ence. 297 (2002) 1536-1540.
[8] C. Loo, A. Lin, L. Hirsch, M. Lee, J. Barton, N. Halas, J. West, R. Drezek, Nanoshell-Enabled Photonics-Based Imaging and Therapy of Cancer, Technol. Cancer. Res. T. 3 (2004) 33-40. [9] M. Quinten, A. Leitner, J. R. Krenn, F. R. Aussenegg,
Electro-magnetic energy transport via linear chains of silver nanopar-ticles, Opt. Lett. 23 (1998) 1331-1333.
820-822.
[11] T. Thio, H. F Ghaemi, H. J Lezec, P. A. Wolff, T. W. Ebbesen, Surface-plasmon-enhanced transmission through hole arrays in Cr films, J. Opt. Soc. Am. B. 16 (1999) 1743-1748. [12] M. L Brongersma, J. W.Hartman, H. A. Atwater,
Electro-magnetic energy transfer and switching in nanoparticle chain arrays below the diffraction limit, Phys. Rev. B. 62 (2000) R16356- 16359.
[13] L. R. Hirsch,R. J. Stafford,J. A. Bankson,S. R. Sershen,R. E. Price,J. D. Hazle, N. J. Halas, and J. L. West, Nanoshell-mediated near-infrared thermal therapy of tumors under mag-netic resonance guidance, Proceeding of the Academy of Sci-ences (USA), PNAS. 100 (2003) 13549- 13554.
[14] M. Sheik-Bahaei, A. A. Said, T. H. Wei, D.J. Hagan, E. W. Van Stryland, Sensitive measurement of optical nonlinearities using a single beam, IEEE. J. Quant. Electron. 26 (1990) 760-769.
[15] R. L. Sutherland, Handbook of Nonlinear Optics, Marcel Dekker, New York, 1996.
[16] H.B. Liao, R.F. Xiao, J.S. Fu, H. Wang, K.S. Wong, G.K.L. Wong, P. Sheng, Large third order optical nonlinear-ity in Au:Sio2 composite films near the percolation threshold, Appl. Phys. Lett. 70 (1997) 1-3.
[17] S.R. Marder, W.E. Torruellas, M. Blanchard-Desce, V. Ricci, G.I. Stegeman, S. Gilmour, J.L. Br´edas, J. Li, G.U. Bublitz and S.G. Boxer, Large Molecular Third-Order Optical Nonlin-earities in Polarized Carotenoids, Science. 276 (1997) 1233-1236.
[18] G. S. He, L. X. Yuan, Y. P. Cui, P. N. Prasad, Studies two-photon pumped frequency unconverted lasing properties of a new dye material, Appl. Phys. 81 (1997) 2529-2537. [19] E. Shahriari, W.M.M. Yunus, K. Naghavi, Z.A. Talib,
Ef-fect of concentration and particle size on nonlinearity of Au nano-fluid prepared byγ(60Co) radiation, Opt. Commun. 283 (2010) 1929-1932.