Conductivity Fluctuations of Polycrystalline Ag-Doped YBa
2Cu
3O
7−δSuperconductor
Paula de Azambuja, Pedro Rodrigues J´unior, Alcione Roberto Jurelo,∗and Rosˆangela Menegotto Costa Departamento de F´ısica, Universidade Estadual de Ponta Grossa,
Av. Gen. Carlos Cavalcanti 4748, 84.030-000, Ponta Grossa, Paran´a, Brazil
(Received on 18 December, 2009)
Systematic conductivity measurements nearTC in granular Ag-doped YBa2Cu3O7−δ superconductors are
presented. Silver doped YBa2Cu3O7−δsamples were produced by different routes and characterized by X-ray diffraction,dcmagnetization and electrical resistivity. The results were analyzed in terms of the temperature derivative of the resistivity and of the logarithmic temperature derivative of the conductivity, that allowed iden-tifying power-law divergences in the conductivity. The results show that the resistive transition proceeds in two stages. In the normal phase, Gaussian and critical fluctuation conductivity regimes were identified. Close to the zero-resistance temperature, a coherence transition related to the connective nature of the granular samples was evidenced. It was not observed significant differences in critical and Gaussian fluctuations between pure and Ag-doped YBa2Cu3O7−δpolycrystalline samples.
Keywords: High-TCSuperconductor; Polycrystalline; Ag addition; Fluctuation Effects
1. INTRODUCTION
Numerous studies have shown that Ag-doping of YBa2Cu3O7−δ superconductors results in improved super-conducting properties in bulk samples [1-5], as for exam-ple, the mechanical properties of melt-textured YBCO [3,5]. Also, as Ag fills the intergranular spaces, it improves the elec-trical properties of the samples, enhancing the critical current density without changing the superconducting transition tem-peratureTC [6]. On the other hand, silver ions can also be encountered inside the YBCO grains [7]. In addition to its excellent chemical compatibility with YBCO, substitutional Ag produces small modifications in theaandblattice param-eters. Yet, as copper and silver are from the same group of the periodic table, Ag atoms can substitute Cu(1) in the YBCO, and consequently many physical properties can be affected by the presence of microscopic granularity. [8-10].
The aim of this work is to carefully study the resistive tran-sition of pure and Ag-doped YBCO polycrystalline samples. An important point to study is the influence of the Ag ion in the fluctuation regimes, especially in the critical regimes. The silver doped YBCO samples were produced by differ-ent routes and characterized by X-ray diffraction, dc mag-netization and electrical resistivity. More details of mate-rial preparation and their general characterization are given in Ref. [11]. The data were analyzed in terms of the tem-perature derivative of the resistivity (dρ/dT) and also us-ing the logarithmic temperature derivative of the conductivity (−dln(∆σ)/dT). The results provide information on the re-sistive transition and fluctuation conductivity of pure and Ag-doped YBCO samples, and show that the resistive transition proceeds in two steps as shown by the temperature derivative
of the resistivity nearTC. The analysis of the conductivity in the normal phase has shown contributions from Gaussian and critical fluctuations. In the regime of near zero resistance state, the occurrence of a coherence transition was evidenced.
2. EXPERIMENTAL DETAILS
A series of samples were prepared by a conventional solid-state reaction using high-purity powders of Y2O3, BaCO3, CuO, Ag2O and metallic Ag. We have prepared four different groups of samples. The group A (labeled by GA) consisted of pure YBCO samples prepared by solid-state reaction tech-nique, using starting materials of Y2O3, BaCO3, and CuO. Appropriate amounts were mixed and calcinated in air at 870, 900 and 9200C for 24 hours, and then slowly cooled through 7000C. Finally, the samples were heated in flowing oxygen at 4200C for 24 hours. In group B (GB), a fully oxygenated 1:2:3 compound was first prepared by the usual solid-state reaction method described above. Samples of composition Y Ba2Cu3O7−δ/Ag, with Ag2O 20 wt % were then prepared from Ag2O and 1:2:3 powders. The Ag2O and stoichimet-ric YBCO powders were well mixed, pressed into pellets and sintered at 9200C for 24 hours. The samples were heated in flowing oxygen at 4200C for 24 hours.
Y Ba2Cu3O7−δ+20wt%Ag2O→Y Ba2Cu3O7−δ/Ag(GB) Samples in group C (GC) were prepared with the same chemical formula as in group A, but instead of using the pre-reacted 1:2:3, we used Y2O3, BaCO3, CuO and Ag2O as pre-cursors.
1
2Y2O3+2BaCO3+3CuO+20wt%Ag2O→Y Ba2Cu3O7−δ/Ag(GC)
In group D (GD), samples of compositionY Ba2Cu3O7−δ/Ag with pure Ag (metallic) 20 wt % were prepared from Ag and the prereacted 1:2:3 powders. The Ag and
flowing oxygen at 4200C for 24 hours.
Y Ba2Cu3O7−δ+20wt%Ag→Y Ba2Cu3O7−δ/Ag(GD) The electrical resistivity as a function of temperature was measured by means of a four-probe AC technique at the fre-quency of 37 Hz. The measuring current was limited to 100 mA for bar-shaped samples which were approximately 8 x 4 x 3 mm3. The temperature was determined with an accuracy of 0.01 K by precisely measuring the resistance of a Pt-100 sensor. The X-ray diffraction patterns were collected from 200to 800in the 2θrange with 0.020step and 4 s counting time. The measurements were performed using a Shimadzu X-ray diffractometer withCuKα radiation andλ=1.542 ˚A, and the crystal structure analyses were performed using the GSAS program [12] with the EXPGUI interface [13] and the Le Bail method. The magnetic measurements were obtained by a superconducting quantum interference device MPMS-XL magnetometer from Quantum Design. The critical cur-rent density (JC) was determined byM−Hhysteresis loops and using the Bean [14] model from the magnetization curves at 15 K.
3. RESULTS AND DISCUSSION
3.1. Characterization
The X-ray powder diffraction patterns of the pure and Ag-doped YBCO polycrystalline samples are displayed in Figure 1. The patterns almost completely matches the orthorhombic YBCO structure (compared with JCPDS files) and belongs to the YBCO orthorhombic unit cell with symmetryPmmm. Also, all samples are found to be nearly single-phase. For the doped samples we could clearly identify three silver peaks, namely theAg(111),Ag(200)andAg(220)reflections, which indicates the presence of silver as a separate (metal) phase [15]. The values of the lattice parametersaandbare approx-imately the same for all samples. On the other hand, the lat-tice parametercdecrease from 11.695 (4) ˚A for pure sample to 11.683 (2) ˚A for GB, 11.680 (2) ˚A for GC and to 11.650 (3) ˚A for GD sample. The change ofclattice parameter with Ag addition suggests the presence of silver inside the grains [16]. The obtained lattice parameters are in agreement with published results [8-10].
Fig. 2 shows the temperature dependence of the electri-cal resistivity of the silver doped YBCO samples GB, GC and GD. The curves are normalized to unity at 95 K. The measured values for ρ(T =300K) are within the range of the reported values for the YBCO/Ag and all samples exhibit metallic behavior in the normal state. The transition width, ∆T, defined between 5 % and 95 % of the transition height, is approximately 1.5 K for GB, 1 K for GC and 1.2 K for GD. On the other hand, the zero-resistance temperature was approximatelyTCO∼=91.5 K for GB, 91.2 K for GC and 91.4 K for GD.
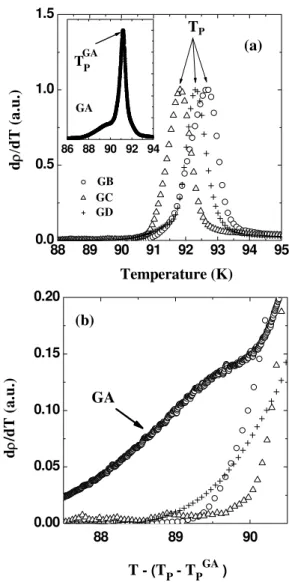
In Fig. 3(a) we show a plot of the derivativedρ/dT ver-sus temperature for all samples. The maximum of dρ/dT, denoted byTP, corresponds approximately to the bulk criti-cal temperature [17]. For our samples,TP is approximately 91.2 K for sample GA, 92.7 K for GB, 91.8 K for GC and
20 30 40 50 60 70 80
(a)
(13
0)
(206
)
(2
20)
(21
3)
(1
23)
(2
00)
(00
6)
(02
0)
(113
)
(005
)
(014
)
(103
)
(110
)
(013
)
(0
10
)
(00
3)
2θ (degree)
GA
(d)
Ag (11
1)
Ag
(1
11)
Inte
nsity (a. u.
)
GC
Ag
(
220
)
Ag (111
)
Ag
(2
00)
Ag (22
0)
Ag (20
0)
GD (c)
(b)
Ag
(2
00)
Ag (
220
) GB
FIG. 1: Representative X-ray diffraction patterns for the pure YBCO (GA) and for the silver doped YBCO samples (GB, GC and GD)
90 91 92 93 94 95
0.0 0.5 1.0
J = 80 mA/cm2
ρ
(
a.
u
.
)
Temperature (K)
GC GB
GD
FIG. 2: Temperature dependence of the electrical resistivity for sil-ver doped YBCO samples (GB, GC and GD).
small peak or an asymmetry indρ/dT, at the temperature re-gion belowTP, occurs systematically in polycrystalline sam-ples, indicating that the transition is a two-step process [17]. As the temperature decreases, it is first observed a pairing transition and then a coherence transition. At the pairing transition, the superconductivity stabilizes in homogeneous regions within the grains at a temperature which virtually co-incides with the critical temperature of the bulk, TC. At a lower temperature,TCO, the phase of the order parameter in individual grains becomes long-range ordered. This is the co-herence transition, where a long-range superconducting state is achieved through a percolation-like process which controls the activation of weak links between grains. In Fig. 3(b) we show a plot ofdρ
dT×Tin the temperature range where re-sistance approaches to zero for all samples. To compare the width of the coherence transition among all studied samples we adjusted the temperatures from the TP value of the GA sample(TPGA)calculatingT− TP−TPGA
. From the figure 3(b) we can observe that the YBCO/Ag samples have small coherence transition width sinceTCO, in these samples, are significantly larger.
Critical currents densities JC for samples GA, GB, GC and GD are shown in Fig. 4. The critical current densities were calculated using the Bean model from the magnetiza-tion curves at 15 K. As illustrated in figure, the critical current densities can reach approximately 1450 mA/cm2(for samples GA and GD), 2000 mA/cm2(GB) and 1650 mA/cm2(GC) in H=0T. The figure also shows thatJCdecreases rapidly with increasing applied magnetic field and that the critical current density (for all applied magnetic field) is significantly higher for sample GB than for other samples.
3.2. Fluctuation Regimes
Thermal fluctuations create Cooper pairs in superconduc-tors above the critical temperature, giving rise to a conductiv-ity excess, also called paraconductivconductiv-ity. We analyze our data supposing that the fluctuation conductivity,∆σ, diverges as a power-law given by
∆σ=Aε−λ, (1)
where∆σ=σ−σR,Ais a constant,ε= (T−TC)/TC is the reduced temperature and λ is the critical exponent. σR is obtained by linear extrapolation of the resistivity data in the range between 150 K and the room temperature.
To obtain the values forλandTC, we numerically deter-mine the logarithmic derivative of∆σfrom experimental data and define
χσ=−
d
dTln(∆σ). (2)
Combining (1) and (2), we obtain 1
χσ=
1
λ(T−TC). (3)
From Eq. (3) is possible to determine simultaneouslyTCand λby plottingχ−σ1versusT [19].
In Figure 5 we show the resistive transition of GB sam-ple. The measurement was performed with a current den-sity of 800 mA/cm2. In panel (a) dρ/dT as a function of
88 89 90 91 92 93 94 95
0.0 0.5 1.0 1.5
88 89 90
0.00 0.05 0.10 0.15 0.20
86 88 90 92 94
Temperature (K)
GB GC GD
d
ρ/
dT
(
a
.u.)
TP
(a)
d
ρ
/d
T (a
.u.)
T - (T
P - TP GA
)
GA
(b)
GA
TGAP
FIG. 3: (a) Plot ofdρ/dT versus temperature (J=800 mA/cm2) for silver doped YBCO (GB, GC and GD). In the inset it is shown
dρ/dT versusT the pure sample (GA). (b) The plot ofdρ/dT × T− TP−TPGA
allows the comparison of the coherence transition’s width among all studied samples.
T results is plotted. The zero resistance temperature, TC0, is achieved at approximately 91 K, and we can observe that TP∼=93 K. Also, we can identify the temperature interval rel-evant for studying fluctuations in the normal phase (aboveTP) and the regime dominated by mesoscopic granularity (close to theρ=0 state) [19]. In panel (b), the transition is shown asχ−1
σ versusT in the same temperature interval. We can fit
χ−1
0 1 2 3 4 5 0
500 1000 1500 2000 2500
Jc
(A
/c
m
2)
H (T)
GA GB GC GD
FIG. 4: Critical current densities versus applied magnetic field for the studied samples. The measurements were performed atT =15 K.
Our exponent λ2≈0.85 corresponds to a crossover regime between 2D and 3D geometries, with ˜d∼=2.3. Decreasing the temperature, a second Gaussian power-law regime is charac-terized by the exponent λ1=0.50±0.03. As predicted by Aslamazov and Larkin [21], the Gaussian exponents depend on the dimensionality asλG=2−d/2, whereλGis the crit-ical exponent andd is the dimension of the fluctuations sys-tem. Then, the exponentλ1=0.50 is just the predicted one for homogeneous 3Dfluctuations. In the immediate vicinity aboveTP, a crossover occurs to a scaling given by exponent λcr=0.31±0.02. The critical exponent for fluctuation con-ductivity is given by
λcr=ν(2+z−d−η), (4)
whereνis the critical exponent for the coherence length,zis the dynamical exponent,d is the dimensionlaty andηis the exponent for the order-parameter correlation function [22]. The obtained value is consistent with predictions of the 3D−
XY model, whereν=0.67 andη=0.03 [23]. The dynam-ics is described by the model E of Hohenberg and Halperin [24], wherez=1.5. This regime was also observed in poly-crystalline and single-crystal samples [25-27]. BetweenTCO andTP,χ−σ1is well described by a power law regime, given by the equation∆σ ∝(T−TCO)−s, withs=3.2±0.2 (inset). This power-law behavior is suggestive of a phase transition phenomenon. Fors≈3.0 exponent, Rosenblatt proposed an interpretation based on a paracoherent-coherent transition of the artificially prepared granular arrays [28,29]. The power-law regime with exponent approximatelys=3 was also ob-served in granular samples of YBa2(Cu3−xZnx)O7−δ [30], GdBa2Cu3O7−δ[31] and Bi1.6Pb0.4Sr2Can−1CunOx(n=2 or n=3) [21] near the zero resistance state.
In Fig. 6, we showχ−1
σ as a function of temperature for sample GC.TPis signaled and the measurement was also per-formed with a current density of 800 mA/cm2. AboveT
P, we can fitχ−1
σ by three power-law regimes corresponding to dif-ferent exponents, labeled by the indicesλcr,λ1andλ2. It was
90 92 94 96 98
91 92
0.0 0.2 0.40.0
0.3 0.6 0.9
TCO
Temperature (K)
λcr = 0.31λ1 = 0.50 λ2= 0.85
GB
(b)
TP1 2 3
s = 3.2
χ
-1 (T) σ
d
ρ
/dT
(
a
.u.)
(a)
TP
FIG. 5: Representative results of the resistive transition for GB sam-ple. (a)dρ/dT and (b)χ−1σ as a function ofT. Straight lines are
fits to Eq. (3), and the corresponding exponents are given. Current density was 800 mA/cm2. In the inset of panel (b), an enlarged view of thesregime is shown.
not observed power-law regimes betweenTCOandTP. The regimesλ1=0.51±0.02 andλ2=1.1±0.1 are dominated by Gaussian fluctuations [20,23], corresponding to a homo-geneous 3Dand 2Dregimes, respectively. Also, closer and above toTPit is observed a third power-law regime, labeled by the exponentλcr=0.31±0.01, and that corresponds to genuine critical fluctuations consistent with predictions of the 3D−XY model [24].
Figure 7 shows the inverse of the logarithmic derivative of the conductivity, χ−1
88
90
92
94
96
98
0
2
4
6
8
10
χ
-1
(K
σ)
Temperature (K)
GC
J = 800 mA/cm
2λcr
= 0.31
λ1= 0.51
λ2
= 1.1
T
P
FIG. 6: Plot of the inverse of the logarithmic derivative of the con-ductivityχ−1σ as a function ofT for GC sample.
λ(cr1) regime might be precursor to a weak first-order pairing transition. A first-order transition occurs when the absolute minimum of the Ginzburg-Lanudau free-energy switches dis-continously from the high temperature position,|ψ|=0, to the one with nonzero|ψ|. One can expect that above but in close vicinity to TC, the system is allowed to fluctuate be-tween the two free-energy minima because of the low height of the barrier that separates them. This could affect the sys-tem dynamics, modifying the effective value of z. The value λ(cr1)∼=0.21 may be reproduced if z∼=1.34 in Eq. (4) [33]. It is not clear why only the GD sample presents a beyond 3D−XY regime. More studies are necessary to clarify this point. BetweenTCOandTPthe variation of χ−σ1 as a func-tion of temperature is again described by a power-law regime given by the exponents=3.3±0.1, and that corresponds to a phase transition from a paracoherent to a coherent state of the granular array [18,30].
From the results we observe that Ag doping does not mod-ify significantly the value of the critical exponents neither aboveTP(related with the pairing transition) neither belowTP (related with the coherence transition). On the other hand, we clearly note that silver addition decreases the coherence tran-sition width when compared with the pure sample. Among all the studied samples, the GB sample presented the highestTP, the highest critical current density and the smallest coherence transition width. When mixed to the YBCO, silver is mainly incorporated in the intergrain regions providing a better grain coupling. In our view, better grain coupling in the sample
GB is due to the fact that the grains in the Ag2O are smaller than the grains in the metallic Ag. Consequently, a more ef-ficient intergrain Ag diffusion occurs in route B. In route C, probably, a small quantity of silver atoms penetrate inside the grains. This effect enhances the intragrain granular character of sample GC.
88 93 98
0 5 10 15
χ
−1 σ(K
)
Temperature (K)
GD J = 800 mA/cm2s = 3.3 λ(1)
cr = 0.21 λ(2)
cr= 0.32 λ1 = 0.55
TP
FIG. 7: Plot of the inverse of the logarithmic derivative of the con-ductivityχ−1σ as a function ofT for GD sample.
4. CONCLUSION
In conclusion, we have studied fluctuations on the electri-cal conductivity in polycrystalline Ag-doped YBa2Cu3O7−δ superconductor. The Ag-doped YBa2Cu3O7−δ samples were produced by different routes and characterized by X-ray diffraction, dc magnetization and electrical resistivity. From the temperature derivative of the resistivity, the re-sults revealed the occurrence of a two-stage intragranular-intergranular transition. From of the logarithmic temperature derivative of the conductivity we could clearly observe above TCthe presence of Gaussian and critical regimes while in the regime of near zero resistance state, the occurrence of a co-herence transition was evidenced. The Ag doping does not modify expressively the value of the critical exponents, but causes a significant decrease of the coherence transition width when compared with the pure sample.
Acknowledgements
This work was partially financed by the CNPq Brazilian Agency under contract n0 474077/2007-1.
[1] E. Mogilko, Y. Schlesinger, Supercond. Sci. Technol. 10 (1997) 134.
[2] J. Joo, J.G. Kim, W. Nah, Supercond. Sci. Technol. 11 (1998)
1285.
2289.
[4] E. Mendonza, T. Puig, E. Varesi, A.E. Carrillo, J. Plain, X. Obradors, Physica C 334 (2001) 7.
[5] D. Behera, N C Mishra, Supercond. Sci. Technol. 15 (2002) 72. [6] A.P. Li, Q.N. Ni, Q.P. Kong, Phys. Status Solidi a 27 (1991)
187.
[7] C.R. Taylor, C. Greaves, Physica C 235-240 (1994) 853. [8] D. Cahen, Z. Moisi, M. Schwartz, Mater. Res. Bull. 22 (1987)
1581.
[9] A.K. Gangopadhyay, T.O. Mason, Physica C 178 (1991) 64. [10] J. Joo, J.P. Singh, R.B. Poeppel, A.K. Gangopaddhyay, T.O.
Mason, J. Appl. Phys. 71 (1992) 2351.
[11] Submitted paper “Effects of Ag Addition on Some Physical Properties of Granular YBa2Cu3O7−δSuperconductor” in the Brazilian Journal of Physics.
[12] A.C. Larson, R.B. Von Dreele, GSAS, Los Alamos National Laboratory (2004) Report LAUR 86-748.
[13] B.H. Toby, J. Appl. Cryst. 34 (2001) 210. [14] C. P. Bean, Rev. Mod. Phys. 36 (1964) 31.
[15] H. Salamati, A.A. Babaei-Brojeny, M. Safa, Supercond. Sci. Technol. 14 (2001) 816.
[16] O. Grr, C. Terzioglu, A Varilici, M Altunbas, Supercond. Sci. Technol. 18 (2005) 1.233.
[17] A.R. Jurelo, I.A. Castillo, J. Roa-Rojas, L.M. Ferreira, L. Ghivelder, P. Pureur, P. Rodrigues Jr., Physica C 311 (1999) 133.
[18] P. Pureur, R. Menegotto Costa, P. Rodrigues Jr., J. Schaf, J.V. Kunzler, Phys. Rev. B 47 (1993) 11.420.
[19] A.R. Jurelo, J.V. Kunzler, J. Schaf, P. Pureur, J. Rosenblatt, Phys. Rev. B 56 (1997) 14.815.
[20] K. Char and A. Kapitulnik, Z. Phys. B 72 (1988) 256. [21] L.G. Aslamazov, A.I. Larkin, Fiz. Tverd. Tela 10 (1968) 1104. [22] B. Oh, K. Char, A.D. Kent, M. Naito, M.R. Beasley, T.H. Geballe, R.H. Hammon, A. Kapitulnik, J. M. Graybeal, Phys. Rev. B 37 (1988) 7861.
[23] J.C. Le Guillou, J. Zinn-Justin, Phys. Rev. B 21 (1980) 3976. [24] P.C. Hohenberg, B.I. Halperin, Rev. Mod. Phys. 49 (1977) 435. [25] F.M. Barros, F.W. Fabris, P. Pureur, J. Schaf, V.N. Vieira, A.R.
Jurelo, M.P. Canto, Phys. Rev. B 73 (2006) 94.516.
[26] J. Roa-Rojas, A.R. Jurelo, R. Menegotto Costa, L.M. Ferreira, P. Pureur, M.T.D. Orlando, P. Prieto, G. Nieva, Physica C 341-348 (2000) 1911.
[27] R. Menegotto Costa, P. Pureur, L. Ghivelder, J.A. Camp, I. Rasines, Phys. Rev. B 56 (1997) 10.836.
[28] J. Rosenblatt, A. Raboutou, P. Peyral, C. Lebeau, Rev. Phys. Appl. 25 (1990) 73.
[29] J. Rosenblatt, in Percolation, Localization and Superconduc-tivity, Vol. 109 of NATO Advanced Study Institute, Series B-Physics, edited by A. M. Goldman and S. A. Wolf (Plenum, New York, 1984), p. 431.
[30] R. Menegotto Costa, L.M. Ferreira, V.N. Vieira, P. Pureur, J. Schaf, Eur. Phys. J. B 58 (2007) 107.
[31] J. Roa-Rojas, R. Menegotto Costa, P. Pureur, P. Prieto, Phys. Rev. B 61 (2000) 12.457.
[32] R. Menegotto Costa, P. Pureur, M. Gusmo, S. Senoussi, K. Behnia, Solid State Communications 113 (2000) 23.