Article
Printed in Brazil - ©2018 Sociedade Brasileira de Química
*e-mail: [email protected]
Development, Optimization and Validation of a GC Method by Polarity Phase
Constants and Statistical Design of Experiments for the Determination of
Monoterpenes in
Alpinia zerumbet
Essential Oil
Igor C. Cardoso,*,a,b Marcos J. Nakamura,b Virginia G. Correia,b Henrique M. G. Pereira,a Maria D. Behrensb and Marcelo R. R. Tappinb
aLaboratório de Apoio ao Desenvolvimento Tecnológico (Ladetec), Polo de Química,
Bloco C, Universidade Federal do Rio de Janeiro, Avenida Horácio Macedo, 1281, Cidade Universitária, 21941-598 Rio de Janeiro-RJ, Brazil
bInstituto de Tecnologia em Fármacos (Farmanguinhos), Fundação Oswaldo Cruz (Fiocruz),
Rua Sizenando Nabuco, 100, Manguinhos, 21041-250 Rio de Janeiro-RJ, Brazil
In this report, a rapid and selective analytical method for the determination of monoterpenes in Alpinia zerumbet essential oil (AZEO) by gas chromatography (GC) flame ionization detection
(FID) was developed, optimized and validated. The suitability of six different capillary columns was investigated by polarity phase constants calculated based on the methodology proposed by Rohrschneider and McReynolds. The most suitable column was then used in a central composite design applying the following GC factors to investigate responses based on peak resolutions and analysis time: initial oven temperature, heating rate and carrier gas flow rate. The optimized method has initial oven temperature of 60 oC, heating rate of 5.1 oC min-1 and flow rate of 1.0 mL min-1 using the DB-35 capillary column. The validation acceptance criteria were met in all cases. The method was successfully applied for the quantification of major monoterpenes found in AZEO in different samples of Alpinia zerumbet.
Keywords:Alpinia zerumbet, essential oils, gas chromatography, polarity phase constants,
central composite design
Introduction
The Alpinia genus includes a various number of
aromatic species that have extensive medicinal uses in various parts of Asia and the Americas. Alpinia zerumbet
(Pers.) Burtt. et Smith, also called Alpinia speciosa
K. Schum is abundant in Northeast Brazil, where it is commonly known as “colônia”.1 The medicinal properties
of this species are related to different parts of the plant, including leaves, flowers and rhizomes.2 A field research
conducted in Ibiúna, São Paulo, Brazil, revealed the use
of A. zerumbet volatile fraction in respiratory disorders.3
In the state of Pará, Brazil, “colônia” flowers tea was widely used as sedative,4 for chest pain and headache.5
Moreover, A. zerumbet is mostly recognized for its use as
anti-hypertensive, normally using infusions or decoctions of its leaves as traditional medicine.6,7
Bezerra et al.8 suggested that the hypotensive active
principle of A. zerumbet may be the essential oil of this
plant, either alone or in conjunction with other non-volatile agents present. A number of pre-clinical studies confirmed that the A. zerumbet essential oil (AZEO) is
very effective and potent in regulating arterial pressure, justifying the use of this plant in folk medicine for the treatment of hypertension.9-13 Those authors indicated
that the monoterpenes are the main class responsible for the antihypertensive activity of this oil. These substances are secondary metabolites belonging to the class of terpenes that consist of two isoprene units, responsible for several pharmacological properties of medicinal plants including antifungal, antibacterial, antioxidant, anticancer, antiarrhythmic, anti-aggregating, local anesthetic, antinociceptive, anti-inflammatory, antihistaminic and anti-spasmodic activities.14
hypotensive properties of this oil and terpinen-4-ol, both decreased blood pressure in conscious hypertensive rats. A similar study was carried out by Pinto et al.,12
using 1,8-cineole instead of terpinen-4-ol, both showed cardiovascular effects. Therefore, these substances may be directly related to the hypotensive activity of the AZEO, which justifies the development and validation of an analytical method for their determination, in order to correlate the antihypertensive activity with the amount of these substances in the volatile fraction and support studies of other pharmacological properties. Chemical studies found in the literature about AZEO are usually associated with pharmacological studies. In those reports chemical analysis were performed by gas chromatography (GC), mostly using capillary columns coated with 5% phenyl-methyl-polysiloxane and peaks were quantified by area normalization using analytical methods not validated but sufficient to fulfill their proposed objectives.9,10,13,15-19
GC is the analytical technique of choice for essential oil samples. The ability of a GC method to successfully separate volatiles in a shorter analysis time is determined by many factors. Statistical design of experiments has been successfully applied for the identification of the significant factors, for each analysis, resulting in better analytical methods. Zubair et al.20 optimized a faster GC
method for the analysis of total petroleum hydrocarbons in contaminated soils using a factorial design to identify the significant factors and a central composite design to optimize the best analysis conditions. Vallejo et al.21
applied experimental designs such as Plackett-Burman and central composite design to optimize factors related to the GC programmable temperature vaporization inlet and large volume injection in order to determine estrogenic compounds in environmental samples.
The aim of this paper is the development, optimization and validation of an analytical method for the determination of AZEO monoterpenes by GC with flame ionization detection (FID) using polarity phase constants and statistical design of experiments.
Experimental
Chemicals and reference
Chromatography-grade methylene chloride was purchased from Tedia (Fairfield, OH, USA) and was used to prepare the sample and standard solutions. The analytical standards γ-terpinene (97%), 1,8-cineole (99%), (+)-terpinen-4-ol (≥ 98.5%), thymol (≥ 98.5%), α-pinene (98%), (–)-β-pinene (99%), R-(+)-limonene
(97%), caryophyllene oxide (90%), β-caryophyllene
(≥ 80%) and the alkane standard solution (C8-C20) were
purchased from Sigma-Aldrich (St. Louis, MO, USA); linalool (97%) was purchased from Acros Organics (Geel, Belgium).
Plant material and extraction of essential oil
Fresh leaves were obtained (in August 2014) from five different specimens of A. zerumbet cultivated in two
campus of Fundação Oswaldo Cruz in Rio de Janeiro, Brazil: AZ1 (43o 24’ 12.54” W; 22o 56’ 26.22” S) and
AZ2 (43o 24’ 8.7” W; 22o 56’ 25.8” S) were collected
at Plataforma Agroecológica de Fitomedicamentos campus; AZ3 (43o 15’ 1.44’’ W; 22o 52’ 37.56’’ S),
AZ4 (43o 14’ 53.82’’ W; 22o 52’ 36.18’’ S) and
AZ5 (43o 14’ 43.14”W; 22o 52’ 33.72”S) were collected
at Manguinhos campus. All plants had the same genetic material, thus only a voucher specimen was deposited, No. RB452.719 (herbarium of Rio de Janeiro Botanical Garden). About 1.0 kg of the fresh leaves of each specimen were chopped and immersed in 6 L of distilled water contained in a 12 L flask. The essential oil was extracted for 3 h using a Clevenger apparatus. The temperature of water inside the condensers was maintained constant at 10 oC. The
essential oils obtained were weighed, transferred to sealed vials and stored in a freezer. Solutions of AZ1 essential oil were prepared at 3.0 mg mL-1 concentration and were used
to characterize the essential oil monoterpenes, select the capillary column and perform the experimental design for method development and optimization.
GC instruments
An Agilent Technologies GC system model 6890N equipped with a 7683 automatic liquid sampler and a 5973 network mass selective detector (Santa Clara, CA, USA) was used for characterizing the essential oil constituents.
An Agilent Technologies GC system model 7890N equipped with a 7693A automatic liquid sampler and FID was used for selecting the GC capillary column, to perform the experimental design for method optimization, validate the optimized method and determine the constituents with the validated method. For intermediate precision calculation an Agilent Technologies GC system model 6890N equipped with a 7683 automatic liquid sampler and FID was used.
Preliminary method
The preliminary method program was: 70 oC of initial
oven temperature raised to 250 oC by a heating rate of
(IBG, Rio de Janeiro, Brazil) was used as carrier gas at a flow rate of 2.0 mL min-1. The injected volume was 2.0 µL
and the injector temperature was 290 oC.
Characterization of essential oil constituents
The AZ1 essential oil constituents were characterized by GC-mass spectrometry (MS) using the preliminary method with 70 eV electron impact ionization energy. The MS transfer line and the ion source temperatures were set to 280 and 230 oC, respectively. Electron ionization mass
spectra were acquired with a mass range of 50-700 Da. Characterization of the constituents was carried out in a DB-5MS (5% phenyl-methyl-polysiloxane) capillary column, 30 m × 0.25 mm i.d. with 0.25 µm film thickness (Agilent J&W, Palo Alto, CA, USA). The characterization was performed by comparison of constituents’ mass spectra with those from Wiley’s MS library (7th edition)
and by co-injection with authentic standards. Comparisons between the compounds’ linear retention indices (LRI) obtained here and reported in the literature confirmed the results. A confirmation analysis was performed using DB-35 column (Agilent J&W) and the optimized method.
Capillary column selection
AZ1 essential oil and n-alkanes samples were analyzed
in six fused-silica capillary columns from Agilent J&W: DB-1 (100% dimethyl-polysiloxane), 30 m × 0.25 mm i.d. with 0.25 µm film thickness; DB-5 (5% phenyl-methyl-polysiloxane), 30 m × 0.25 mm i.d. with 0.25 µm film thickness; DB-1301 (6% cyanopropyl-phenyl-methyl-polysiloxane), 30 m × 0.25 mm i.d. with 0.25 µm film thickness; DB-1701 (14% cyanopropyl-phenyl-methyl-polysiloxane), 30 m × 0.25 mm i.d. with 0.25 µm film thickness; DB-35 (35% phenyl-methyl-polysiloxane), 30 m × 0.25 mm i.d. with 0.25 µm film thickness; and DB-17ht (50% phenyl-methyl-polysiloxane), 30 m × 0.25 mm i.d. with 0.25 µm film thickness. The samples were analyzed using the preliminary method described above with FID temperature set at 300 oC. The
LRI of all monoterpenes identified were calculated in each column from a standard solution of n-alkanes using
equation 1 as introduced by Van Den Dool and Kratz:22
(1)
where tc is the retention time of a monoterpene, tn is the
retention time of preceding n-alkane, tn + 1 is the retention
time of subsequent n-alkane and n is the carbon number
of preceding n-alkane.
The polarity phase constants (x’) for all monoterpenes identified were calculated by equation 2 based on the reports proposed by Rohrschneider23 and McReynolds:24
x’ = LRI(stationary phase) – LRI(DB-1) (2)
where LRI(stationary phase) is the LRI of a monoterpene
calculated for a stationary phase of interest and LRI(DB-1) is
the LRI of this monoterpene calculated for the stationary phase of DB-1 column.
Two polarity phase constants averages were calculated for each column, one for monoterpenes hydrocarbons and another for oxygenated monoterpenes. The columns with the larger polarity phase constants averages were selected for further testing by statistical design of experiments.
Statistical design of experiments
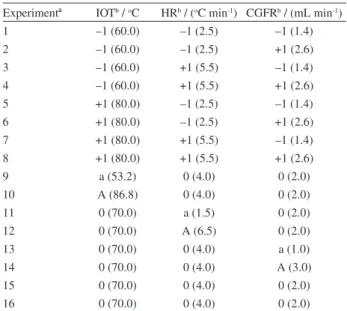
Two central composite designs were performed. The first was performed in the selected columns, DB-35 and DB-1701, and the second was performed only in DB-35 column. Three GC parameters were chosen as factors for these designs: initial oven temperature, oven heating rate and carrier gas flow rate. Tables 1 and 2 show the experiments performed.
The selected responses were: the resolution between myrcene and β-pinene peaks, the resolution between 1,8-cineole and p-cymene peaks and analysis time. The
resolutions were obtained from Agilent Technologies
Table 1. Experiments of first central composite design
Experimentª IOTb / oC HRb / (oC min-1) CGFRb / (mL min-1)
1 –1 (60.0) –1 (2.5) –1 (1.4)
2 –1 (60.0) –1 (2.5) +1 (2.6)
3 –1 (60.0) +1 (5.5) –1 (1.4)
4 –1 (60.0) +1 (5.5) +1 (2.6)
5 +1 (80.0) –1 (2.5) –1 (1.4)
6 +1 (80.0) –1 (2.5) +1 (2.6)
7 +1 (80.0) +1 (5.5) –1 (1.4)
8 +1 (80.0) +1 (5.5) +1 (2.6)
9 a (53.2) 0 (4.0) 0 (2.0)
10 A (86.8) 0 (4.0) 0 (2.0)
11 0 (70.0) a (1.5) 0 (2.0)
12 0 (70.0) A (6.5) 0 (2.0)
13 0 (70.0) 0 (4.0) a (1.0)
14 0 (70.0) 0 (4.0) A (3.0)
15 0 (70.0) 0 (4.0) 0 (2.0)
16 0 (70.0) 0 (4.0) 0 (2.0)
ªExperiments 15 and 16 are center point replicates; bcodified and original
ChemStation® software. The mathematical modeling using
the DB-35 column was performed by response surface methodology.25 For each response, a prediction model was
calculated such as:
ŷ = b0 + bIOT[IOT] + bHR[HR] + bCGFR[CGFR] +
bIOT-HR[IOT][HR] + bIOT-CGFR[IOT][CGFR] +
bHR-CGFR[HR][CGFR] + bIOT2[IOT]2 + bHR2[HR]2 +
bCGFR2[CGFR]2 (3)
where ŷ is the predicted response, b0 is the intercept, bIOT is the
linear coefficient of the initial oven temperature, [IOT] is the codified value of the initial oven temperature, bHR is the linear
coefficient of the heating rate, [HR] is the codified value of the heating rate, bCGFR is the linear coefficient of the carrier
gas flow rate, [CGFR] is the codified value of the carrier gas flow rate, bIOT-HR is the coefficient for the interaction between
IOT and HR, bIOT-CGFR is the coefficient for the interaction
between IOT and CGFR, bHR-CGFR is the coefficient for the
interaction between HR and CGFR, bIOT2 is the quadratic
coefficient of the IOT, bHR2 is the quadratic coefficient of
the HR and bCGFR2 is the quadratic coefficient of the CGFR.
JMP® statistical discovery software26 (version 8.0;
SAS Institute Inc., Cary, NC, USA) was used for designs creation and analysis.
Sample and standards preparation
For method validation and application, thymol was used as an internal standard. All samples and standards
were prepared and dissolved in a 500 µg mL-1 solution
of thymol in methylene chloride. For monoterpenes determination, essential oil samples of AZ1, AZ2, AZ3, AZ4 and AZ5 specimens were prepared at concentrations about 2.0 mg mL-1.
Method validation
The optimized method was validated using 1,8-cineole, γ-terpinene and terpinen-4-ol standards normalized by thymol internal standard. The validation procedure was performed based on the guidelines of the International Conference on Harmonization (ICH),27 in which the
following validation parameters were calculated: selectivity, linearity and linear range, precision (repeatability and intermediate precision), recovery, limit of detection (LOD), limit of quantitation (LOQ) and robustness. Method selectivity was determined by mass spectral peak purity analysis in the GC-MS system. Linearity was established by the analysis of six solutions with concentrations ranging from 64 to 640 µg mL-1 for 1,8-cineole, from 32
to 320 µg mL-1 for γ-terpinene and from 80 to 800 µg mL-1
for terpinen-4-ol. Repeatability was obtained from the analysis of six individual samples of AZ1 essential oil with similar concentrations in the middle of the linear range. Intermediate precision was performed on different days, by a different analyst, employing a different instrument. Recovery was determined by AZ1 samples spiked with standard solution at three concentration levels within the linear range: 605, 302 and 121 µg mL-1 for 1,8-cineole;
304, 152 and 61 µg mL-1 for γ-terpinene; and 789, 354
and 158 µg mL-1 for terpinen-4-ol. Unspiked samples
were also analyzed to estimate the blank concentration of monoterpenes. The recovery was determined in triplicate at each concentration level. The LODs and LOQs were calculated as described by the ICH guideline based on the standard deviation of the response and the slope.27
Robustness was investigated by factorial design of two levels. For the initial oven temperature the range was between 59 and 61 oC. For the heating rate the range was
between 4.1 and 6.1 oC min-1. For the carrier gas flow
rate the range was between 0.9 and 1.1 mL min-1. This
design was performed within a small range between the smallest and the largest condition of the factors, totaling 10 experiments (including one replicate at center point). The monoterpenes peak areas were chosen as responses.
Essential oil constituents’ determination
The optimized and validated method was applied to determine the content of major essential oil constituents
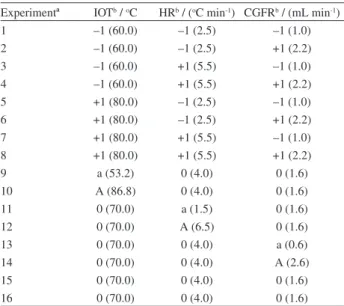
Table 2. Experiments of second central composite design
Experimentª IOTb / oC HRb / (oC min-1) CGFRb / (mL min-1)
1 –1 (60.0) –1 (2.5) –1 (1.0)
2 –1 (60.0) –1 (2.5) +1 (2.2)
3 –1 (60.0) +1 (5.5) –1 (1.0)
4 –1 (60.0) +1 (5.5) +1 (2.2)
5 +1 (80.0) –1 (2.5) –1 (1.0)
6 +1 (80.0) –1 (2.5) +1 (2.2)
7 +1 (80.0) +1 (5.5) –1 (1.0)
8 +1 (80.0) +1 (5.5) +1 (2.2)
9 a (53.2) 0 (4.0) 0 (1.6)
10 A (86.8) 0 (4.0) 0 (1.6)
11 0 (70.0) a (1.5) 0 (1.6)
12 0 (70.0) A (6.5) 0 (1.6)
13 0 (70.0) 0 (4.0) a (0.6)
14 0 (70.0) 0 (4.0) A (2.6)
15 0 (70.0) 0 (4.0) 0 (1.6)
16 0 (70.0) 0 (4.0) 0 (1.6)
ªExperiments 15 and 16 are center point replicates; bcodified and original
obtained from five samples of A. zerumbet specimens:
AZ1, AZ2, AZ3, AZ4 and AZ5. The absolute amount of 1,8-cineole, γ-terpinene and terpinen-4-ol was determined using the calibration curves described in the “Method validation” sub-section. The relative amount of sabinene was determined from γ-terpinene calibration curve. These amounts were expressed as content (in percentage) obtained from the mass of essential oil used in the sample preparation.
Results and Discussion
GC-MS preliminary analysis
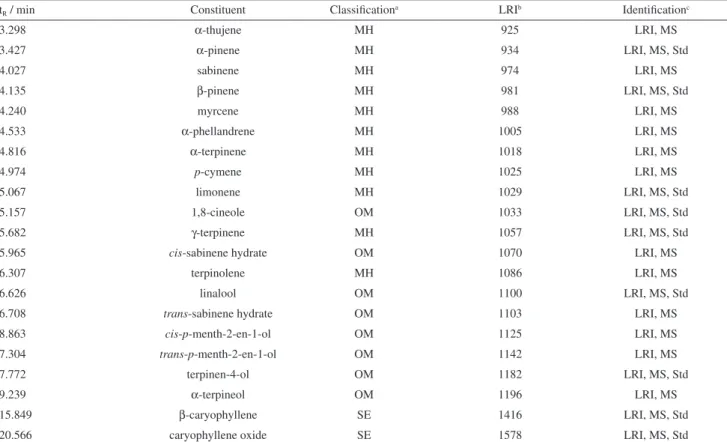
The identity obtained from mass spectral analysis and the calculated LRI of each AZ1 essential oil constituent are summarized in Table 3, and the components are reported according to the chromatography elution order in DB-5MS column. The GC-MS preliminary analysis of the essential oil provided the identification of 21 compounds using their LRI, their mass spectra and/or by co-injection with their authentic reference standards. The monoterpenes identified were classified as monoterpenes hydrocarbons and oxygenated monoterpenes.
Capillary column selection
The interaction of compounds with the stationary phase is an important factor for selecting the most suitable chromatographic column for GC method development and optimization. The system of constants introduced by Rohrschneider23 was the first approach employed
to measure the polarity and/or selectivity of the GC stationary phases. It is based on the difference between retention indices calculated for a constituent in two stationary phases: a phase of interest and a non-polar phase. The stationary phase chosen as reference is non-polar, thus, the difference between retention indices is equivalent to the contribution from polar interactions.28
The McReynolds constants were derived from the Rohrschneider method and were created to evaluate the phase constants numerically. Those constants allow expressing the polarity of the stationary phase using reference compounds. Both systems (Rohrschneider and McReynolds) are based on the Kovats retention indices and use squalane as reference stationary phase.29
Polarity phase constants were calculated in this report for determining the suitability of different capillary
Table 3. Constituents characterized in AZ1 essential oil
tR / min Constituent Classificationa LRIb Identificationc
3.298 α-thujene MH 925 LRI, MS
3.427 α-pinene MH 934 LRI, MS, Std
4.027 sabinene MH 974 LRI, MS
4.135 β-pinene MH 981 LRI, MS, Std
4.240 myrcene MH 988 LRI, MS
4.533 α-phellandrene MH 1005 LRI, MS
4.816 α-terpinene MH 1018 LRI, MS
4.974 p-cymene MH 1025 LRI, MS
5.067 limonene MH 1029 LRI, MS, Std
5.157 1,8-cineole OM 1033 LRI, MS, Std
5.682 γ-terpinene MH 1057 LRI, MS, Std
5.965 cis-sabinene hydrate OM 1070 LRI, MS
6.307 terpinolene MH 1086 LRI, MS
6.626 linalool OM 1100 LRI, MS, Std
6.708 trans-sabinene hydrate OM 1103 LRI, MS
8.863 cis-p-menth-2-en-1-ol OM 1125 LRI, MS
7.304 trans-p-menth-2-en-1-ol OM 1142 LRI, MS
7.772 terpinen-4-ol OM 1182 LRI, MS, Std
9.239 α-terpineol OM 1196 LRI, MS
15.849 β-caryophyllene SE 1416 LRI, MS, Std
20.566 caryophyllene oxide SE 1578 LRI, MS, Std
ªMH: monoterpenes hydrocarbon, OM: oxygenated monoterpenes, and SE: sesquiterpenes; bthe linear retention indices (LRI) were calculated from DB-5MS
column, employing the preliminary method; cmethod of identification: LRI, by comparison of LRI with those from the literature;15,17,19 MS, by comparison
columns for the analysis of monoterpenes. LRI were used instead of Kovats retention indices, since a temperature program was applied. Although there are other versions of retention index expression for methods with oven temperature programs, the LRI is more frequently used by the scientific community. The 100% dimethyl-polysiloxane (DB-1 column) was chosen as reference stationary phase because it interacts strictly through non-polar interactions. By definition, the polarity phase constants of DB-1 were considered 0 because it was the reference phase.
Monoterpenes interact with non-polar stationary phases (DB-1) by dispersive forces. However, most monoterpenes are unsaturated hydrocarbons or have an oxygen atom, as hydroxyl or carbonyl group, and the presence of phenyl and/or cyanopropyl groups on the stationary phase allows them to interact with the column by additional mechanisms, such as donor acceptor forces, induction forces and/or orientation forces, including hydrogen bonds.30 The addition of
interaction mechanisms could improve the elution of monoterpenes by improving the compound’s peak shape, resulting in better separations. This addition of interaction mechanisms could be reflected by the increase of polarity phase constants, therefore, these constants were calculated for five different columns using AZ1 monoterpenes. The polarity phase constants were expressed as average values for monoterpenes hydrocarbons and oxygenated monoterpenes of the AZ1 essential oil. Figure 1 shows charts with those results.
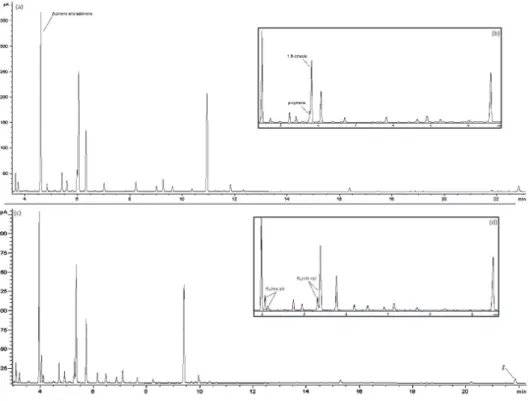
For monoterpenes hydrocarbons, as the amount of groups capable of interacting by polar forces increases, phase constants for this group also increase until a certain limit. After this limit phase constants fall as shown in Figure 1a. The same behavior was found for oxygenated monoterpenes, the only difference being that DB-1701 and DB-35 gave similar results as shown in Figure 1b. As proposed above, the polarity phase constants increased as the amount of phenyl or cyanopropyl groups in the stationary phase increases from DB-5 to DB-35 column and resulted in an improved separation of monoterpenes, as can be seen in Figure 2, comparing the analysis in 1701 and DB-35 using the same chromatographic conditions. However, DB-17ht column (50% phenyl groups) has a lower phase constant than DB-35 for both monoterpenes classes. This suggests that a balance must be reached between methyl and phenyl or cyanopropyl groups present in the stationary phase, since a large part of the monoterpenes chemical structure corresponds to saturated hydrocarbons. For
A. zerumbet monoterpenes, DB-1701 (14% cyanopropyl
groups) and DB-35 (35% phenyl groups) present the best balance between those groups. Consequently, both columns were selected for further testing by central composite design.
The other columns were not employed in the next steps of this report, since they presented poorer interactions with monoterpenes than DB-35 and DB-1701. In addition, DB-1 and DB-17ht presented asymmetric peaks with significant tailing (data not shown), confirming the poor interaction between these columns and monoterpenes shown by polarity phase constants.
Method optimization by central composite design
A first central composite design was performed, initially, with the goal of observing the monoterpenes separation in both DB-35 and DB-1701 in several chromatographic methods, and to help select the best column between them. The experimental factors selected were the initial oven temperature, the oven heating rate and the carrier gas flow rate based on the Zubair et al.20
report. Table 1 shows each experiment performed. The resulting chromatograms showed that DB-1701 was not able to resolve several peaks in most experiments. DB-35 chromatograms also presented unresolved peaks but in far less experiments (data not shown). This fact demonstrated that DB-1701 is less suitable for the analysis of this essential oil, therefore, DB-35 column was selected. Figure 2 shows chromatograms obtained by the AZ1
essential oil analysis in DB-1701 and DB-35 columns, in the center point condition, pointing out the main coelutions in DB-1701 (Figures 2a and 2b).
The second goal of this first design was to optimize chromatographic conditions to achieve the best separation and analysis time with DB-35 column. A mathematical modeling by response surface methodology was carried out using the results obtained. The retention time of the last peak (as a measure of the analysis time) and the resolutions between myrcene and β-pinene peaks (Rs(my-pi))and between
1,8-cineole and p-cymene peaks (Rs(cin-cy)) were chosen as
responses. These responses are indicated in Figures 2c and 2d. The prediction models (i), (ii) and (iii) were obtained
in codified values and are given below:
(i) Rs(my-pi) = 1.26 – 1.24[IOT] – 0.51[HR] + 0.21[CGFR] +
0.40[IOT][HR] – 0.06[IOT][CGFR] + 0.03[HR][CGFR] + 0.24[IOT]2 – 0.03[HR]2 – 0.18[CGFR]2
(ii) Rs(cin-cy) = 1.30 + 0.05[IOT] + 0.04[HR] – 0.10[CGFR]
– 0.06[IOT][HR] + 0.05[IOT][CGFR]+ 0.03[HR][CGFR] – 0.03[IOT]2 – 0.01[HR]2 – 0.01[CGFR]2
(iii) t = 22.7 – 2.05[IOT] – 7.02[HR] – 2.05[CGFR] +
2.16[IOT][HR] – 1.10[IOT][CGFR] – 0.68[HR][CGFR] + 0.11[IOT]2 + 2.95[HR]2 + 0.37[CGFR]2
where Rs(my-pi) is the resolution between myrcene and
β-pinene, Rs(cin-cy) is the resolution between 1,8-cineole and
p-cymene and t is the analysis time.
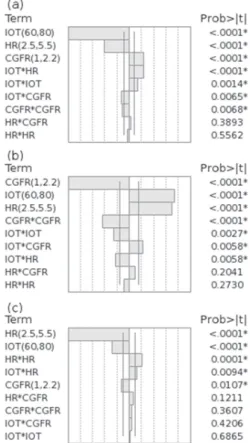
The bar charts with the individual significance of the factors and their interactions, presented in Figure 3, revealed that all three factors were significant for the three responses. As observed in the prediction profile presented in Figure 4, it was not possible to predict a baseline resolution between 1,8-cineole and p-cymene without impairing the
resolution between myrcene and β-pinene peaks.
A maximum resolution of 1.41 was predicted for Rs(cin-cy)
while still keeping Rs(my-pi) above 1.5. The best predicted
conditions were: 60 oC of initial oven temperature,
5.2 oC min-1 of heating rate and 1.4 mL min-1 of carrier gas
flow rate. In the experimental analysis with these conditions Rs(cin-cy) and Rs(my-pi) were 1.38 and 1.59, respectively, within
the prediction range (Figure 4). It was also observed that there is a tendency of Rs(cin-cy) to increase in flow rates
lower than 1.5 mL min-1. This observation suggested that
the desired separation could be obtained with a further central composite design. A reduction in the carrier gas flow rate could improve the resolution between 1,8-cineole and p-cymene peaks, without diminishing the resolution
between myrcene and β-pinene peaks. Therefore, a second central composite design was generated using the same ranges and values employed in the first design
Figure 2. Chromatograms of AZ1 essential oil analysis in DB-1701 and DB-35 columns at center point conditions: (a) complete chromatogram in DB-1701; (b) major monoterpenes region in DB-1701; coelutions in this column are indicated; (c) complete chromatogram in DB-35; and (d) major monoterpenes region in DB-35; the selected responses in this column are indicated. Rs(my-pi) stands for resolution between myrcene and β-pinene peaks, Rs(cin-cy) stands for
for the initial oven temperature (60-80 oC) and heating
rate (2.5-5.5 oC min-1). However, the maximum and the
minimum values for carrier gas flow rate were reduced to 2.2 and 1.0 mL min-1, respectively (Table 2). The prediction
models (iv), (v) and (vi) were generated for each response
and were obtained in codified values:
(iv) Rs(my-pi) = 1.37 – 1.30[IOT] – 0.54[HR] + 0.32[CGFR]
+ 0.40[IOT][HR] – 0.20[IOT][CGFR] + 0.06[HR][CGFR] + 0.23[IOT]2 – 0.04[HR]2 – 0.19[CGFR]2
(v) Rs(cin-cy) = 0.40 + 0.05[IOT] + 0.05[HR] – 0.07[CGFR]
– 0.02[IOT][HR] + 0.02[IOT][CGFR] + 0.09[HR][CGFR] – 0.02[IOT]2 – 0.01[HR]2 – 0.04[CGFR]2
(vi) t = 24.3 – 2.47[IOT] – 8.77[HR] – 1.13[CGFR] +
1.50[IOT][HR] + 0.43[IOT][CGFR] + 0.85[HR][CGFR] + 0.20[IOT]2 + 2.30[HR]2 + 0.46[CGFR]2
The results of this second central composite design are shown in Figures 5 and 6. All factors were significant for the three responses.
It was not possible to obtain a condition in which the resolution Rs(cin-cy) has value above 1.5, without decreasing
Figure 3. Bar charts of the first central composite design with the
significance of factors and interactions: (a) resolution between myrcene and β-pinene peaks (Rs(my-pi)); (b) resolution between 1,8-cineole and
p-cymene peaks (Rs(cin-cy)); and (c) analysis time. IOT stands for initial
oven temperature; HR stands for heating rate; CGFR stands for carrier gas flow rate.
Figure 4. Prediction profile of the first central composite design modeling: Rs(my-pi) is the resolution between myrcene and β-pinene peaks; Rs(cin-cy) is the
resolution between 1,8-cineole and p-cymene peaks; and t is the analysis time. IOT stands for initial oven temperature; HR stands for heating rate; CGFR stands for carrier gas flow rate.
Figure 5. Bar charts of the second central composite design with the
significance of factors and interactions: (a) resolution between myrcene and β-pinene peaks (Rs(my-pi)); (b) resolution between 1,8-cineole and
p-cymene peaks (Rs(cin-cy)); and (c) analysis time. IOT stands for initial
Rs(my-pi) below 1.5, since as described above, the factors that
improve Rs(cin-cy), diminish Rs(my-pi). Model evaluation led to
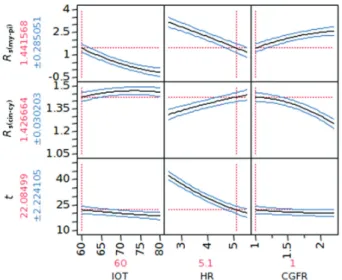
the proposal of a compromised condition in which both resolutions were above 1.4 as presented in Figure 6. The proposed conditions were: 60 oC of initial oven temperature,
5.1 oC min-1 of heating rate and 1.0 mL min-1 of carrier gas
flow rate. All responses fell within the predicted range after an experimental analysis demonstrating the good fit of the model (Table 4).
Finally, the conditions optimized were used in the final analytical method. Other conditions, not evaluated in experimental design, remained constant, such as: split ratio of 1:25, 2.0 µL of injection volume, injector temperature of 290 oC and oven final temperature of 180 oC.
A chromatogram of an AZ1 essential oil sample injected in
optimized method using the DB-35 column is represented in Figure 7.
Method validation
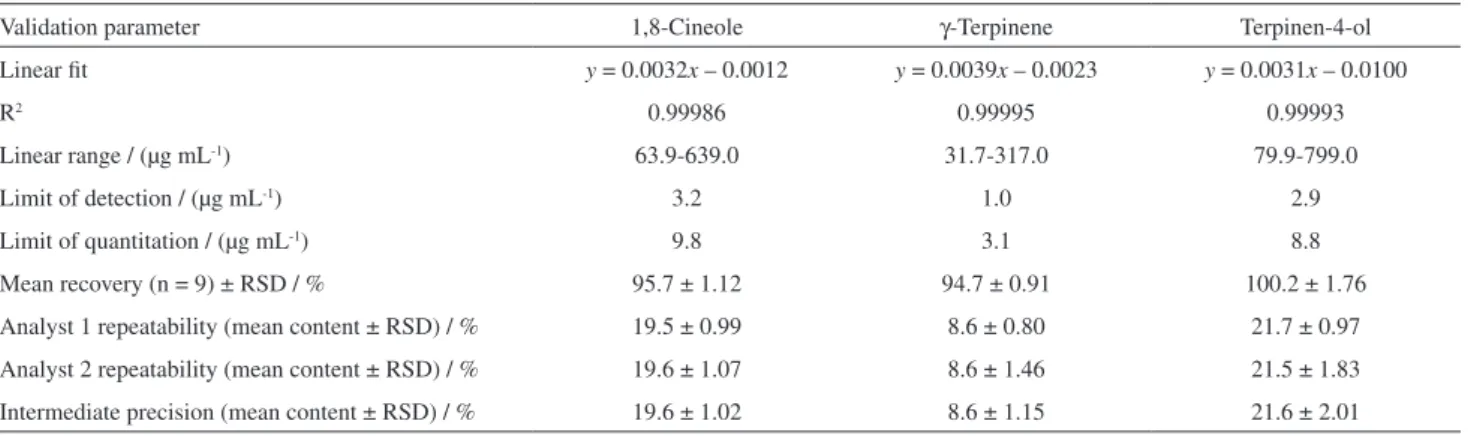
The linear regression equations, determination coefficients, linear range, LODs, LOQs, the mean recovery and the relative standard deviation (RSD) for repeatability and intermediate precision are shown in Table 5.
In all samples, selectivity evaluated by GC-MS peak purity analysis established the presence of just one compound in each peak. For linearity assessment the lack of fit test performed in each calibration curve was found to be non-significant and the residual plots showed homoscedasticity indicating good method linearity (data not shown). The linear range was corrected by the exact amount of weighted standard and the standard purity indicated by the manufacturer. The RSD for repeatability and intermediate precision were considered satisfactory. A t-test revealed that the monoterpenes content obtained
from analyst 1 and analyst 2 was found to be non-significant (p > 0.05). Accuracy was evaluated by recovery assays and
the results were considered satisfactory. Among the various
Figure 6. Prediction profile of the second central composite design modeling: Rs(my-pi) is the resolution between myrcene and β-pinene peaks;
Rs(cin-cy) is the resolution between 1,8-cineole and p-cymene peaks; t is
the analysis time. IOT stands for initial oven temperature; HR stands for heating rate; CGFR stands for carrier gas flow rate.
Table 4. Predicted and experimental responses of the second central composite design
Response
Rs(my-pi) Rs(cin-cy) t / min
Predicted value 1.44 1.42 22.1
Upper confidence limit 1.73 1.45 24.3
Lower confidence limit 1.16 1.40 19.9
Experimental result 1.52 1.44 21.7
Rs(my-pi): resolution between myrcene and β-pinene peaks; Rs(cin-cy): resolution
between 1,8-cineole and p-cymene peaks; t: analysis time.
Figure 7. Chromatogram of A. zerumbet essential oil in the optimized method. The following LRI were obtained from the constituents characterized:
approaches for LOD and LOQ measurement, the method based on the calibration curve linear regression was applied. For robustness, a factorial design with a small range was performed, the conditions of the optimized method being the center point. The objective of this design was to simulate small variations in the system that can affect the results. Figure 8 shows the bar charts with the significance of the main factors and the interactions effects. No factor was found to be significant and the method was considered robust.
Method application
In addition to the GC-MS preliminary analysis using DB-5MS column, a new GC-MS analysis was performed
using DB-35 column and the optimized method. All AZ1 essential oil constituents identified in this preliminary analysis were also identified. With exception of LRI, the other methods of identification shown in Table 3 were used to confirm the terpenes identity. In DB-35, the peaks of p-cymene and limonene inverted their positions when
compared to the DB-5MS analysis and an unknown peak appeared between them. The Wiley MS library suggested that this unknown peak is the monoterpene β-thujene (Figure 7). On the other hand, the elution order of the remaining peaks was the same between DB-35 and DB-5MS columns. The LRI were presented in Figure 5 for assisting future studies with AZEO using the DB-35 column. The other essential oils of AZ2, AZ3, AZ4 and AZ5 specimens presented the same peaks without changes in selectivity. Only the intensity of the peaks was different between these samples and AZ1 essential oil.
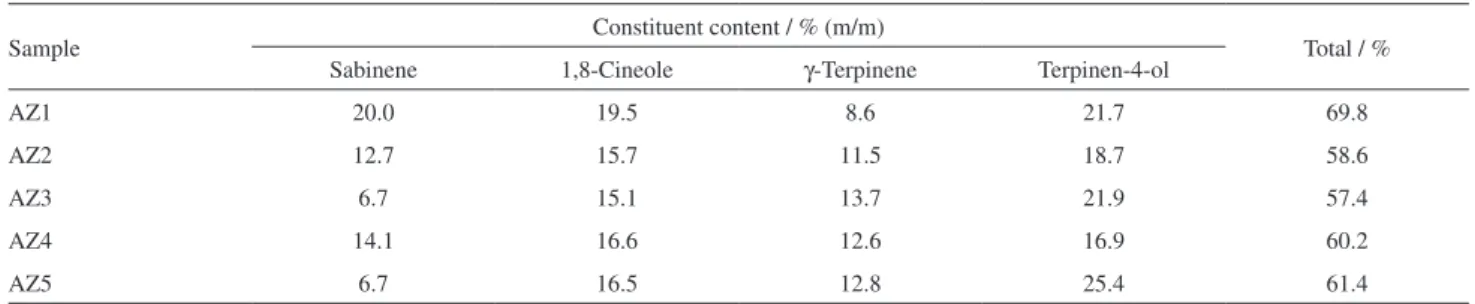
The optimized and validated method was applied to determine the content of sabinene, 1,8-cineole, γ-terpinene and terpinen-4-ol in five essential oil samples extracted from A. zerumbet leaves collected from specimens
cultivated in neighboring regions. These monoterpenes were chosen for determination because they were the major constituents of AZEO samples. In addition, 1,8-cineole and terpinen-4-ol were already related as antihypertensive compounds of this essential oil.10,12
The validation calibration curves performed by GC-FID allowed the determination of absolute content of three of these major monoterpenes, 1,8-cineole, γ-terpinene and terpinen-4-ol. However, since sabinene is also a major component, its relative content was also determined from γ-terpinene calibration curve. The amount of these monoterpenes in five samples of AZEO is shown in Table 6.
The four monoterpenes determined comprised at least 57% (m/m) of the samples investigated. With exception of sabinene, the other major monoterpenes are the same
Table 5. Results obtained from validation experiments
Validation parameter 1,8-Cineole γ-Terpinene Terpinen-4-ol
Linear fit y = 0.0032x – 0.0012 y = 0.0039x – 0.0023 y = 0.0031x – 0.0100
R2 0.99986 0.99995 0.99993
Linear range / (µg mL-1) 63.9-639.0 31.7-317.0 79.9-799.0
Limit of detection / (µg mL-1) 3.2 1.0 2.9
Limit of quantitation / (µg mL-1) 9.8 3.1 8.8
Mean recovery (n = 9) ± RSD / % 95.7 ± 1.12 94.7 ± 0.91 100.2 ± 1.76
Analyst 1 repeatability (mean content ± RSD) / % 19.5 ± 0.99 8.6 ± 0.80 21.7 ± 0.97
Analyst 2 repeatability (mean content ± RSD) / % 19.6 ± 1.07 8.6 ± 1.46 21.5 ± 1.83 Intermediate precision (mean content ± RSD) / % 19.6 ± 1.02 8.6 ± 1.15 21.6 ± 2.01 R2: coefficient of determination; RSD: relative standard deviation.
reported by other Brazilian studies.9,10,13,15 However, this
result does not agree with those from Asia, which indicate camphor,17 or p-cymene,18 as the major constituent.
Sabinene was reported in moderate amounts in some studies,9,10,16 but not in such large amounts as found in
this report. In addition, sabinene had the largest content variation among the samples. A study conducted by Murakami et al.18 about the composition and seasonal
variation of AZEO from Okinawa Island revealed that sabinene composition varied critically among the studied samples corroborating the results obtained here.
The great variation in the content of monoterpenes observed among essential oil samples obtained from plants of the same region, collected in the same climatic season, suggests that there are abiotic and biotic factors influencing the biosynthesis of these components. These results show the importance of performing a metabolomic study of AZEO to determine these factors and a suitable condition of cultivation for A. zerumbet that maximizes the
biosynthesis of bioactive compounds.
Conclusions
This investigation examined six capillary columns with different stationary phases of increasing polarity for the analysis of A. zerumbet essential oil. The polarity
phase constants calculated based on Rohrschneider and McReynolds reports proved to be an adequate tool for determining the suitability of the stationary phases, supporting column selection. This study also presented the development and optimization of a new analytical method applying statistical design of experiments for analysis of AZEO by GC-FID. DB-35 column proved to be the best column for this analysis. The use of central composite design allowed for the modeling of polynomial functions that were used to predict and optimize the GC-FID conditions. The optimized method obtained from DB-35 gave a total analysis time of 21.7 min and successfully separated the peaks of 1,8-cineole and p-cymene and the
peaks of myrcene and β-pinene, whereas the other columns
and conditions failed to resolve its coelutions. The method was further validated and was found to be selective, accurate, precise, linear across the analytical range and robust. The optimized and validated method was then applied and the content of sabinene, 1,8-cineole, γ-terpinene and terpinen-4-ol was determined in five samples of AZEO, comprising more than 57% of the oil.
References
1. Victório, C. P.; Braz. J. Pharmacog.2011, 21, 194.
2. Almeida, E. R.; Plantas Medicinais Brasileiras: Conhecimentos Populares e Científicos, 1a ed.; Hemus: São Paulo, 1993. 3. Camargo, M. T. L. A.; Plantas Medicinais e de Rituais
Afro-Brasileiros II: Estudo Etnofarmacobotânico, vol. 1; Editora
Ícone: São Paulo, 1998.
4. Van Den Berg, M. A.; Advances in Economic Botany Ethnobotany in the Neotropics, vol. 1; New York Botanical Garden: New York, 1984.
5. Furtado, L. G.; Souza, R. C.; Berg, M. E.; Bol. Mus. Para. Emílio Goeldi, sér. Antropologia1978, 70, 1.
6. Mendonça, V. L. M.; Oliveira, C. L. A.; Craveiro, A. A.; Rao, V. S.; Fonteles, M. C.; Mem. Inst. Oswaldo Cruz1991, 86, 93.
7. Mpalantinos, M. A.; Soares de Moura, R.; Parente, J. P.; Kuster, R. M.; Phytother. Res.1998, 12, 442.
8. Bezerra, M. A. C.; Leal-Cardoso, J. H.; Coelho-de-Souza, N. A.; Criddle, D. N.; Fonteles, M. C.; Phytother. Res.2000, 14,
549.
9. Lahlou, S.; Galindo, C. A. B.; Leal-Cardoso, J. H.; Fonteles, M. C.; Duarte, G. P.; Planta Med.2002, 68, 1097.
10. Lahlou, S.; Interaminense, L. F. L.; Leal-Cardoso, J. H.; Duarte, G. P.; Fundam. Clin. Pharmacol.2003, 17, 323.
11. Leal-Cardoso, J. H.; Moreira, M. R.; Pinto da Cruz, G. M.; de Morais, S. M.; Lahlou, M. S.; Coelho-de-Souza, M. A. S.;
Phytomedicine2004, 11, 549.
12. Pinto, N. V.; Assreuy, M. A. S.; Coelho-de-Souza, N. A.; Ceccatto, V. M.; Magalhães, P. J. C.; Lahlou, S.; Leal-Cardoso, J. H.; Phytomedicine2009, 16, 1151.
13. Santos, B. A.; Roman-Campos, D.; Carvalho, M. S.; Miranda, F. M. F.; Carneiro, D. C.; Cavalcante, P. H.; Cândido, E. A. F.;
Table 6. Content of sabinene, 1,8-cineole, γ-terpinene and terpinen-4-ol in five samples of AZEO
Sample Constituent content / % (m/m) Total / %
Sabinene 1,8-Cineole γ-Terpinene Terpinen-4-ol
AZ1 20.0 19.5 8.6 21.7 69.8
AZ2 12.7 15.7 11.5 18.7 58.6
AZ3 6.7 15.1 13.7 21.9 57.4
AZ4 14.1 16.6 12.6 16.9 60.2
Xavier Filho, L.; Cruz, J. S.; Gondim, A. N. S.; Phytomedicine
2011, 18, 539.
14. Kozioł, A.; Stryjewska, A.; Librowski, T.; Sałat, K.; Gaweł, M.; Moniczewski, A.; Lochyński, S.; Mini-Rev. Med. Chem. 2014,
14, 1156.
15. Mendes, F. R. S.; Silva, F. G. E.; Sousa, E. O.; Rodrigues, F. F. G.; Costa, J. G. M.; Monte, F. J. Q.; Lemos, T. L. G.; Assunção, J. C. C.; J. Essent. Oil Res.2015, 27, 259.
16. Victório, C. P.; Leitão, S. G.; Lage, C. L. S.; J. Essent. Oil Res.
2010, 22, 52.
17. Ho, J. C.; J. Chin. Chem. Soc.2010, 57, 758.
18. Murakami, S.; Li, W.; Matsuura, M.; Satou, T.; Hayashi, S.; Koike, K.; J. Nat. Med.2009, 63, 204.
19. Zoghbi, M. D. G. B.; Andrade, E. H. A.; Maia, J. G. S.; Flavour Fragrance J.1999, 14, 411.
20. Zubair, A.; Pappoe, M.; James, L. A.; Hawboldt, K.; J. Chromatogr. A2015, 1425, 240.
21. Vallejo, A.; Fernández, L. A.; Olivares, M.; Prieto, A.; Etxebarria, N.; Usobiaga, A.; Zuloaga, O.; J. Chromatogr. A
2010, 1217, 8327.
22. Van Den Dool, H.; Kratz, P.; J. Chromatogr. A1963, 11, 463.
23. Rohrschneider, L.; J. Chromatogr. A1966, 22, 6. 24. McReynolds, W. O.; J. Chromatogr. Sci.1970, 8, 685.
25. Bezerra, M.; Santelli, R. E.; Oliveira, E. P.; Villar, L. S.; Escaleira, L. A.; Talanta2008, 76, 965.
26. SAS Institute Inc.; JMP® Statistical Discovery Software, version 8.0; SAS Institute Inc., Cary, NC, USA, 2009.
27. International Conference on Harmonization (ICH) of Technical Requirements for Registration of Pharmaceuticals for Human Use; Validation of Analytical Procedures: Text and Methodology, Q2(R1); ICH: Geneva, 2005.
28. Zellner, B. A.; Bicchi, C.; Dugo, P.; Rubiolo, P.; Dugo, G.; Mondello, L.; Flavour Fragrance J.2008, 23, 297.
29. Mohd, M. A.; Advanced Gas Chromatography - Progress in Agricultural, Biomedical and Industrial Applications, 1st ed.; Intech: Shanghai, 2012.
30. Rotzsche, H.; Stationary Phases in Gas Chromatography, vol.
48; Elsevier: Amsterdam, 1991.
Submitted: November 1, 2017 Published online: May 29, 2018