0103 - 5053 $6.00+0.00
A
r
ti
c
le
* e-mail: quezia@dq.ufscar.br
Development of a HPLC Method to Follow the Degradation of Phenol
by Electrochemical or Photoelectrochemical Treatment
Leonardo S. Andrade, Edison A. Laurindo, Regina V. de Oliveira, Romeu C. Rocha-Filho and Quezia B. Cass*
Departamento de Química, Universidade Federal de São Carlos, CP 676, 13560-970 São Carlos - SP, Brazil
Descreve-se o desenvolvimento e validação de um método de CLAE para acompanhar a degradação de fenol por tratamento eletroquímico ou fotoeletroquímico. Este método, que permite a determinação das quantidades de fenol, p-benzoquinona e catecol em soluções
eletrolisadas ou fotoeletrolisadas, foi usado para análise dos intermediários de reação durante a eletroxidação ou fotoeletroxidação de fenol. Foram usados como eletrodos, Ti-Pt/PbO2 (obtido por método térmico-eletroquímico ou por eletrodeposição) ou Ti/TiO2 dopado com Ga3+ (obtido
por decomposição térmica de sais precursores).
The development and validation of a HPLC method to follow the degradation of phenol by electrochemical or photoelectrochemical treatment are described. This method, which allows determining amounts of phenol, p-benzoquinone and cathecol in electrolyzed or
photoelectrolyzed solutions, was used for analysis of reaction intermediates during electrooxidation or photoelectrooxidation of phenol using a Ti-Pt/PbO2 (obtained by thermal-electrochemicalor electrodeposition methods) or Ti/TiO2 doped with Ga3+ (obtained by thermal
decomposition of precursor salts) electrode.
Keywords: wastewater treatment, HPLC method, phenol degradation, PbO2 electrodes, Ti/TiO2 photoelectrodes
Introduction
In the recent past, problems involving water conta-mination have called the attention to the necessity of removing toxic organic compounds from industrial aqueous effluents. Phenolic compounds are found in high concen-trations in the residual waters of petrochemical, paint, paper and textile industries. These compounds are toxic to the environment; for example, phenol in concentrations higher than 2 mg L-1 is considered toxic to fish and, taking into account four days of exposure, concentrations between 10 mg L-1 and 100 mg L-1 are lethal to most aquatic life.1 Thus, phenolic compounds must be removed before disposition of the residual waters can be carried out.
For this removal, use of biological methods may be a satisfactory solution. However, there are many compounds for which these methods can be inefficient or require long-term treatment in order to open the aromatic ring; in some instances, this can take years to be accomplished.2 In such
cases, electrochemical and photoelectrochemical methods have been considered as a good alternative, since most aromatic compounds can thus be transformed into biodegradable substances or, better yet, depending on the electrode material used, complete oxidation (often referred as combustion) can be accomplished by electrochemical3 or photoelectrochemical4 methods.
As it is shown in Scheme 1, the first step in the anodic oxidation of phenol involves the formation of the phenoxy radical with the para and orto positions activated.5 After, the aromatic ring is hydroxylated to form hydroquinone and/or cathecol followed by p-benzoquinone and/or o-benzoquinone formation. Finally, the ring is opened to form
electro-oxidation of phenol using Ti-Pt/PbO2 electrodes (obtained by the thermal-electrochemical6 method or by electro-deposition7), or the photoelectrooxidation of phenol using a Ti/TiO2 doped with Ga3+ (10 cmol mol-1) electrode, obtained by thermal decomposition of precursor salts. Phenol and the intermediate compounds hydroquinone,
p-benzoquinone and cathecol were selected for the
development of this method. The validated method was used for the kinetic studies of the oxidation processes.
Experimental
Chemicals
Phenol (Merck®) and p-benzoquinone, hydroquinone, cathecol (Acros®) were used as standards. Methanol and tetra-hydrofurane – THF (HPLC grade) were obtained from Mallinckrodt® and J. T. Baker®, respectively. Water was purified using a Milli-Q system (Millipore). Buffer solutions used as part of the mobile phase were prepared using sodium monohydrogenphosphate (Merck®) and phosphoric acid (Merck®).
Equipment
A Shimatzu HPLC system, consisting of a SIL – 10AF auto-injector, a SPD – 10A UV detector operated at 254 nm, a SCL – 10A control system and a LC – 10AT pump, was used. The data acquisition was carried out using the Class LC10 software (Shimatzu).
Chromatographic conditions
The mobile phase used was a mixture of 0.01 mol L-1 potassium monohydrogenphosphate solution (pH adjusted to 3 with H3PO4), methanol and THF in the volumetric
proportion of 90:5:5. The flow rate used was 1.0 mL min-1 and detection was monitored at λ = 254 nm.
The analytical column (4.6 mm diameter and 150 mm length) used was packed with C18 nucleosil silica (5 µm, 100 Å; Macherey-Nagel, Germany) by the ascending slurry method, using methanol for the preparation of the slurry (50 mL) and also for the packing. This was carried out at a pressure of 7500 psi; after, the column was conditioned for about 4 h with methanol at a flow rate of 1.0 mL min-1.8
Stock solutions
Stock solutions of the mixture of compounds used (phenol, p-benzoquinone, hydroquinone and cathecol)
were prepared in a concentration of 2 g L-1 of each compound using the mobile phase as solvent. These solutions were used to prepare the calibration standards with the following nominal concentrations: 2.4 mg L-1, 4.8 mg L-1, 10 mg L-1, 20 mg L-1 and 30 mg L-1.
Method validation
The solutions were prepared in triplicate and trans-ferred to the autosampler vials and samples of 100 µL were injected into the column. Calibration curves were constructed by plotting the peak area against the nominal concentration of each compound.
Five samples of each compound were prepared at the quality control concentrations of 2.8 mg L-1, 15 mg L-1 and 25 mg L-1, in three different days, in order to determine intra- and inter-day precision and accuracy.
The acceptance criteria for the limit of quantification was that the accuracy for three analyzed samples presented less than 15% variability and the limit of detection was measured taking into account a signal-to-noise ratio of three.
Scheme 1. The degradation process of phenol. (a) hydroquinone, (b) cathecol, (c) p-benzoquinone, (d) o-benzoquinone, (e) maleic acid, (f) oxalic acid and
Kinetic study
The reaction solutions were prepared by dissolving 50 mg of phenol in 100 mL of a 1.0 mol L-1 H
2SO4 solution. Analyses of the samples were carried out at time zero and then at each hour for a period of seven hours. For the analysis, an aliquot (20 µL) of the reaction media was diluted with 380 µL of the mobile phase and 250 µL was transferred to the auto-sampler vials and samples of 100 µL were injected in the analytical column.
Results and Discussion
The main intermediates during the electrochemical/ photoelectrochemical degradation of phenol are hydroquinone, cathecol and 1,4-benzoquinone;5 thus these compounds were selected for the method development.
Reversed-phase elution mode, using a Nucleosil® C18 column, was investigated under isocratic conditions to achieve the necessary retention of the four compounds. Phosphate buffer (0.01 mol L-1) with pH adjusted to 3 with phosphoric acid, in methanol (80:20, v/v) was initially used. The low pH was necessary for increasing the retention time of the ionized compounds and improving peak shape. To control the selectivity, a wide range of mobile phases was investigated and the use of acetonitrile, THF and methanol (or a mixture of these solvents) as modifier was evaluated. Good selectivity and retention factors were obtained when a 0.01 mol L-1 phosphate buffer (pH adjusted to 3 with phosphoric acid) with methanol and THF (90:5:5, v/v) was used as the mobile phase at a flow rate of 1 mL min-1.
The chromatogram in Figure 1 illustrates the separation achieved under these conditions and shows also the elution order, which was identified by co-injection of the individual compounds.
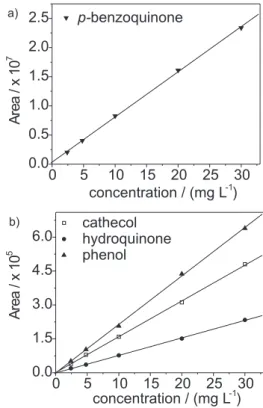
The response of the UV detector at 254 nm was linear for each compound, from 2.4 mg L-1 to 30 mg L-1. Least-squares regression analyses of the data for all four compounds resulted in excellent straight-line fits over the concentration examined, with R2 superior to 0.999. Figure 2 shows the calibration curves obtained.
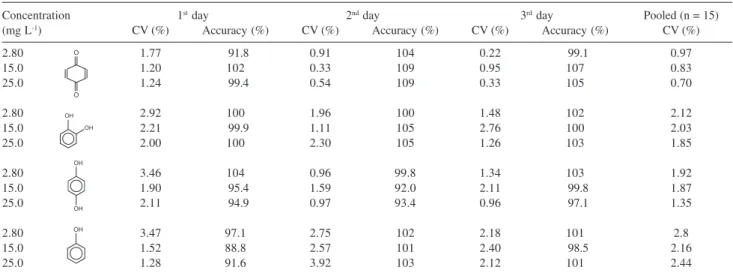
The intra and inter-day precision and accuracy of the method were determined by analyzing five replicates of three quality controls on three non-consecutive days. The precision was expressed as coefficients of variation (CV%) and the accuracy was evaluated by back-calculation and expressed as the percent deviation between amount found and amount added at the three concentrations examined. The obtained results, which led to satisfactory intra- and inter-assay precision and accuracy, are shown in Table 1. The limit of quantification found for all four compounds was of 1.2 mg L-1 while the calculated limits of detection were 0.075 mg L-1 for phenol, cathecol and hydroquinone, and 0.0003 mg L-1 for benzoquinone.
The developed method showed good linearity, sensitivity, selectivity, intra and inter-day precision and accuracy and, thus, was used to follow the electrochemical degradation of phenol under different experimental conditions. The intermediate compounds formed were quantified and the results obtained in these experiments are given in Tables 2 and 3. The chromatograms shown in
Figure 1. Chromatogram of the separation in a C18 column (150 mm × 4.6 mm I.D., 5 µm, 100 Å) of: 1) p-benzoquinone, 2) hydroquinone, 3)
cathecol and 4) phenol. The chromatographic conditions are given in the text.
Figure 2. Calibration curves for a) p-benzoquinone and b) cathecol,
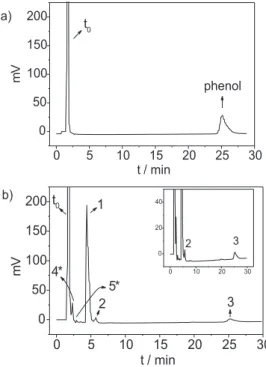
Figure 3 and 4 are representative of samples analyzed to evaluate the method applicability using the two Ti-Pt/PbO2 electrodes obtained by different methods. Tables 2 and 3 show the corresponding results for the degradation of phenol. Under photoelectrochemical conditions (using the Ti/TiO2 doped with Ga3+ electrode), out of the four compounds only benzoquinone was formed, but below quantification level; these results are shown in Table 4.
The different performances of the two PbO2 anodes, showed in the Tables 2 and 3, can be explained taking into account their electroactivity for the oxygen evolution reaction (OER). The electrode obtained by the thermal-electrochemical method (TM) has a lower OER overpotential than that obtained by the electrodeposition method. X-ray diffractograms allowed the characterization
Table 2. Values obtained from the chromatograms of the reaction media
(Figures 3a and 3b) during the electrochemical oxidation of phenol using a Ti-Pt/PbO2 electrode obtained by the thermal-electrochemical method
time of Concentration (mg L-1)
electrolysis (h) phenol p-benzoquinone hydroquinone cathecol
0 26.4 - -
-2 3.23 5.93 13.6 1.51
Table 3. Values obtained from the chromatograms of the reaction media
(Figures 4a and 4b) during the electrochemical oxidation of phenol using a Ti-Pt/PbO2 electrode obtained by the electrodeposition method
time of Concentration (mg L-1)
electrolysis (h) phenol p-benzoquinone hydroquinone cathecol
0 27.3 - -
-2 4.61 1.08 6.47 *
*not detected.
Table 4. Values obtained from the chromatograms (not shown) of the
reaction media during the photoelectrochemical oxidation of phenol using a Ti/TiO2 doped with Ga3+ (10 cmol mol-1) electrode
time of Concentration (mg L-1)
electrolysis (h) phenol p-benzoquinone hydroquinone cathecol
0 15.9 - -
-3 1.10 * ** **
* Below quantification level; **not detected.
Figure 3. Representative chromatograms of the kinetic studies. a)
reac-tion media before electrochemical oxidareac-tion of phenol using a Ti-Pt/PbO2 electrode (obtained by the thermal-electrochemical method); b) after 2 h of electrolysis: 1) p-benzoquinone, 2) hydroquinone, 3) cathecol, 4) phe-nol and ?) non-identified compounds.
Table 1. Accuracy and intra- (n = 5) and inter-day (n = 3) precisions for the assay of p-benzoquinone, cathecol, hydroquinone and phenol
Concentration 1st day 2nd day 3rd day Pooled (n = 15)
(mg L-1) CV (%) Accuracy (%) CV (%) Accuracy (%) CV (%) Accuracy (%) CV (%)
2.80 1.77 91.8 0.91 104 0.22 99.1 0.97
15.0 1.20 102 0.33 109 0.95 107 0.83
25.0 1.24 99.4 0.54 109 0.33 105 0.70
2.80 2.92 100 1.96 100 1.48 102 2.12
15.0 2.21 99.9 1.11 105 2.76 100 2.03
25.0 2.00 100 2.30 105 1.26 103 1.85
2.80 3.46 104 0.96 99.8 1.34 103 1.92
15.0 1.90 95.4 1.59 92.0 2.11 99.8 1.87
25.0 2.11 94.9 0.97 93.4 0.96 97.1 1.35
2.80 3.47 97.1 2.75 102 2.18 101 2.8
15.0 1.52 88.8 2.57 101 2.40 98.5 2.16
Figure 4. Representative chromatograms of the kinetics studies. a)
reac-tion media before electrochemical oxidareac-tion of phenol using a Ti-Pt/PbO2 electrode (obtained by the eletrodeposition method); b) after 2 h of elec-trolysis: 1) p-benzoquinone, 2) hydroquinone, 3) phenol, 4) maleic acid
and 5) fumaric acid. (*) only identified.
of the thermal-electrochemical oxide as α-PbO2 and of the electrodeposited oxide as β-PbO2. Electrodes with low OER overpotential favor selective oxidations (conversion) of organics compounds while those with a high overpotential favor the electrochemical combustion.9 Therefore, more reaction intermediate compounds are expected when using the PbO2 electrode obtained by TM and lower concentrations are expected when using the electrodeposited PbO2 electrode. It should be pointed out that ~67% (Figure 3) and 100% (Figure 4) of the reaction intermediate compounds were identified when using the PbO2 (TM) and PbO2 (electrodeposition) electrodes, respectively. Furthermore, in both cases CO2 was quantified using the Total Organic Carbon (TOC) technique.
Conclusions
The resolution obtained under isocratic elution allowed the accurate determination of the intermediate compounds in the phenol electrochemical degradation process. The validated method is simple and rapid, requiring a total analysis time of 26 min per sample and was efficiently
used in the kinetic study of these reactions.
Acknowledgments
The financial support (mainly scholarships) of CNPq and FAPESP is gratefully acknowledged.
References
1. Taken, R. L; Lewis, J., eds.; Registry of Toxic Effects of
Chemical Substances; NIOSH (publication no 83-107):
Washington, 1993, pp. 83-107.
2. Rajeshwar, K.; Ibanez, J. G.; Swain, G. M.; J. Appl.
Electrochem.1994, 24, 1077.
3. Comninellis, C.; Electrochim. Acta1994, 39, 1857.
4. Rajeshwar, K.; Ibanez, J. G.; Environmental Electrochemistry:
Fundamentals and Applications in Pollution Abatement,
Academic Press: S. Diego, 1997.
5. Gattrell, M.; Kirk, D. W.; J. Electrochem. Soc.1993, 140, 1534.
6. Laurindo, E. A.; Bocchi, N. ; Rocha-Filho, R. C.; J. Braz. Chem. Soc.2000, 11, 429.
7. Bemelmans, C.; O’Keef, T.; Colie, E.; Bull. Electrochem.1996,
12, 591.
8. Cass, Q. B.; Gomes, R. F.; Calafatti, S. A.; Pedrazolli Jr., J.; J.
Chromatogr., A2003, 987, 235.
9. Comninellis, C.; Electrochim. Acta1994, 39, 1857.
Received: May 2, 2005 Published on the web: February 17, 2006


