©Revista Brasileira de Fisioterapia
DO INDIVIDUALS WHO PRESENT A STATIC DIFFERENCE BETWEEN THE
KNEES ALSO PRESENT A DIFFERENCE DURING GAIT?
P
OLETTOPR
1, S
ATOTO
1, C
ARNAZL
1, L
OBODAC
OSTAPH
2& G
ILC
OURYHJC
11 Department of Physical Therapy, Federal University of São Carlos- UFSCar, São Carlos, SP - Brazil
2 Department of Physical Education, UFSCar, São Carlos, SP - Brazil
Correspondence to: Patrícia Rios Poletto, Departamento de Fisioterapia, Universidade Federal de São Carlos, Rodovia Washington Luís, km 235, CEP 13565–905, São Carlos, SP – Brazil, e-mail: [email protected]
Received: 14/02/2006 - Revised: 26/06/2006 - Accepted: 11/10/2006
ABSTRACT
Introduction: The knee joint stands out as a structure that is commonly affected by degenerative alterations, injuries and syndromes. Precise objective clinical evaluations are necessary for establishing appropriate diagnoses and, consequently, better results from both surgical procedures and rehabilitation programs. Objective: To investigate the existence of differences between the knees during gait and their relationship with the static difference in the sagittal and frontal planes. Method: Forty-five healthy subjects were included, of whom 21 were male and 24 were female. Knee joint range of motion was measured during gait by means of flexible electrogoniometry. The static posture of the knee was evaluated by means of photogrammetry. The data were analyzed descriptively and the Pearson correlation coefficient was applied. Results: The individuals presented mean values that were similar for right and left knees in static recordings of the sagittal and frontal planes (difference of approximately 0.5º). However, the standard deviation was large, thus indicating great variability between the subjects. For the dynamic recordings, the difference between the knees was 0.4º for the sagittal plane and 1º for the frontal plane. The variability found was also large, especially for the frontal plane. There was no correlation between the static and dynamic recordings in the two planes of motion evaluated (r = -0.003 and p = 0.492 for the sagittal plane; r = -0.014 and p = 0.465 for the frontal plane). Conclusion: Although no relationship was found between the static and dynamic recordings, this matter deserves investigation in future studies, with evaluations of broader groups with specific and more pronounced postural abnormalities.
Key words: knee joint, posture, gait, electrogoniometry.
INTRODUCTION
Among the lower limb joints, the knee stands out because its structure is commonly affected by degenerative alterations such as osteoarthritis, injuries such as rupture of the anterior cruciate ligament and syndromes such as femoropatellar dysfunction. Objective and precise clinical evaluations are necessary for establishing appropriate diagnoses, which may in turn promote better results from both surgical procedures and rehabilitation programs1. The physical examination of this joint involves static and dynamic evaluations.
In the clinical context, static evaluation is usually performed by observation. In this type of evaluation, the physical therapist visually estimates the alignment of the lower limb, and identifies postural and asymmetrical abnormalities between the sides of the body2. However, visual estimation is not an objective measurement and its reliability has been questioned, since there may be large differences between examiners3. Photogrammetry is a more precise form of static
evaluation. In this type of evaluation, a photographic record is made of the body segment to be evaluated, using demarcation of pertinent anatomical reference points4.
the wire is measured and converted into angles. The construction of biaxial electrogoniometers allows recording of the angles in two movement planes that are orthogonal to each other6,7.
Starting from the measurements obtained using these methods, it is possible to compare the sides of the body, to identify static and dynamic asymmetries. Differences between the lower limbs are commonly related to debilities, incapacities and dysfunctions, and similarity between the injured and uninjured limbs is one of the main objectives of rehabilitation programs8. However, this premise may be questioned, since it is unknown whether the individual was symmetric before the injury and also what importance this symmetry has for the individual’s functional capacity.
Some authors have found angular differences between the knees in healthy gait1,9-11. Using a flexible biaxial electrogoniometer, Maupas et al.10,11 found that 51.6% and 62.5% of the individuals were asymmetrical with regard to knee range of motion in the sagittal plane, in two studies performed at different times. From these results, it was affirmed that gait must not be considered to be a strictly symmetrical phenomenon. These authors sought to explain the difference between the knees using various factors such as lateral dominance, attention level during activities and muscle strength in the lower limbs. However, they did not find any significant correlations with any of these characteristics investigated.
One possible factor that could lead to a difference in knee range of motion during gait would be previous difference between individuals’ knees. In other words, if an individual had a static difference between his knees, this could affect dynamic records, thus leading to angular preponderance of one of the knees during gait.
In this light, the objectives of this study were to identify the presence of asymmetry between the knees during the gait of healthy individuals and to investigate whether there is any relationship between asymmetry in the gait and static asymmetry of the knees, for the sagittal and frontal planes.
METHODOLOGY
Subjects
Forty-five healthy individuals were evaluated, among whom there were 21 males and 24 females (22.1 ± 3.0 years; 62.2 ± 8.8 kg; 1.67 ± 0.1 m; BMI = 22.9 ± 2.4 kg/m2). These individuals were recruited after prior evaluation of a bigger group (N= 70). Initial clarifications about the general objectives of the study and the collection procedures were provided for these individuals, and they then signed a free and informed consent statement. The inclusion factors for study subjects were that 1) they had to present a body mass index (BMI) of between 18 and 24 kg/m², and 2) their height had to be between 1.60 and 1.80 m. The exclusion factors were the presence of injuries or diseases in the lower limbs, symptoms that had persisted for three or more days during
the preceding year, balance disorders, or real discrepancy in leg length greater than 1 cm. This study was developed in accordance with the ethical guidelines in Resolution 196/ 96 of the National Health Board and was approved by the Research Ethics Committee of the Federal University of São Carlos (report no. 035/04).
Material and Equipment
In this study, the equipment setup consisted of an electrogoniometer (XM 110 sensors) and data acquisition unit (Biometrics Ltd, Gwent, UK); a digital photographic camera (MVC – FFD91, Sony); an electronic treadmill (Explorer Action Fitness); dermographic pen; measurement tape; reflective markers; double-sided adhesive tape; tapeline; chronometer and other consumable materials.
Procedures
Subject preparation: The individuals first underwent skin shaving at the sensor attachment locations, to provide better adhesion of the terminals to the skin.
Measurement of knee angles using photogrammetry: The bone processes were identified by manual palpation (anterosuperior iliac spines (ASIS), greater trochanter, lateral malleolus, center of the patella and talus head). All the points were identified in accordance with the recommendations of Gross et al.12. At these anatomical points, spherical markers were attached. The knee joint interline was marked using a dermographic pen. The individuals were photographed in frontal and lateral (right and left) views; the AutoCAD 2000 software was used to measure the angles between the thigh and lower leg segments. In the frontal photos, varus/valgus angles of the knee were drawn using two straight lines: one joining the ASIS to the center of the patella, and the other joining the center of the patella to the talus head. From the lateral view photos, two straight lines were drawn to measure the flexor/extensor angle: one joining the greater trochanter of the femur to the joint interline, and the other joining the interline to the lateral malleolus (Figure 1).
valgus angle
flexion angle
Figure 1. Subject prepared for data collection and joint angle
Prior intra-examiner reliability analysis was performed in relation to drawing the angles, with a one-week interval between the measurements. The mean difference was 0.7º ± 0.5º (r= 0.99). The inter-examiner reliability was also evaluated, between two physical therapists who had undergone one week of training, and the mean difference was 1.0º ± 1.0º (r= 0.98). Each examiner had no access to the information obtained by the other examiner.
Placing of the electrogoniometer: The electrogoniometer sensors were coupled to the lateral face of the knees with the aid of a tapeline aligned with the center of the markers of the greater trochanter of the femur and the lateral malleolus. Two straight lines were drawn crossing the joint interline, which made it possible to place the sensor terminals on the thigh and lower leg in a reproducible way. The recommendations in the manufacturer’s manual were followed, aligning the lower terminal of the sensor to the axis of the lower leg and the upper terminal to the axis of the thigh. Although the manufacturer did not determine the lateral projection of the joint axis, it was considered in this study that this axis projection would be located at the intersection point of the joint interline with the line that joined the greater trochanter of the femur to the lateral malleolus, in accordance with Kadaba et al.13.
After attaching the sensors, the equipment was calibrated with the individual standing up with extended knees, and with his weight distributed equally between the two feet. Flexion and valgus movements were considered positive, and extension and varus, negative. The dynamic recording consisted of walking on the electric treadmill at a speed of 5.0 km/h for 90 seconds, with a previous familiarization period of 4 minutes. At the end of the data collection, the data was downloaded to the computer for immediate verification of the recording quality.
Data analysis
From the measurements obtained using the electrogoniometer, the total excursion of the knee was evaluated (range of motion, ROM) in the sagittal and frontal planes using a routine developed in the Matlab software (version 6.5). This routine enabled faster and more reliable data processing. It consisted of dividing the gait record into cycles (stride) and extracting the angular data of interest from these stride, such as movement peaks and amplitudes, times of event occurrence and duration of the phases and subphases of the cycle. To evaluate associations between the static and dynamic recordings in the movement planes evaluated, the Pearson correlation was used.
RESULTS
The mean and standard deviation for the right and left sides in the static recordings (photogrammetry) and dynamic recordings (electrogoniometry), in the sagittal and frontal
planes, can be seen in Table 1. This shows that, in the static recordings in the sagittal and frontal planes, the individuals presented similar mean values for the right and left sides, with a difference of approximately 0.5º. However, the standard deviation was high, thus indicating great variability between the individuals. In the dynamic recordings, the difference in ROM between the knees was 0.4º for the sagittal plane and 1º for the frontal plane. The difference between individuals was also high, particularly for the frontal plane. The difference between the knees for the means of the minimum and maximum peaks of movements in the sagittal and frontal planes ranged from 1.8º to 2.8º, with a standard deviation of between 3.5 and 7.6º.
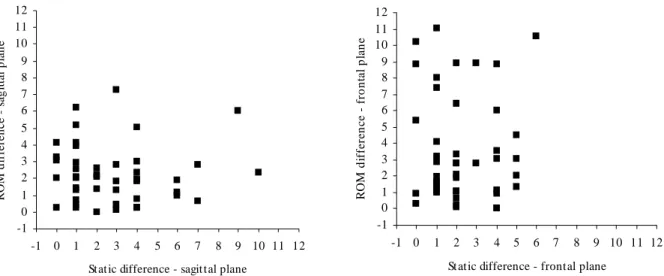
The differences between the right and left sides were calculated for the static recordings (photogrammetry) and dynamic recordings (electrogoniometry) for each individual. The results indicated that there was no linear relation between these differences (static recordings versus dynamic recordings), for either the sagittal plane or the frontal plane, as shown in Figure 2. The Pearson correlation also indicated that there was no significant relationship between the recordings. The p and r values found were: r= -0.003 and p= 0.492 for the sagittal plane and r= -0.014 and p= 0.465 for the frontal plane.
DISCUSSION
The results found indicated great interindividual variability in the static and dynamic recordings. Moreover, no correlation was found between the static and dynamic differences.
Figure 2. Dispersion graph showing the relationship between static differences (x-axis) and dynamic differences (y-axis) for the sagittal plane
(left) and frontal plane (right).
Table 1. Means, standard deviations and Extension peak and Flexion peak, in degrees (º) for right and left sides, in static and dynamic recordings
for the sagittal and frontal planes.
Recordings Sagittal Frontal
Min Max Mean ± SD Min Max Mean ± SD
Photogrammetry
Right knee -10 8 0.0 ± 3.9 169 180 174.2 ± 3.0
Left knee -9 9 -0.6 ± 4.0 168 180 173.6 ± 3.0
Electrogoniometry
ROM
Right knee 44.4 61.8 55.1 ± 4.3 5.9 30.8 13.4 ± 5.6
Left knee 43.2 64.8 55.5 ± 5.2 5.9 28.9 12.4 ± 5.6
Minimum value
Right knee -8.4 12.4 2.5 ± 4.3 -17 3.3 -4 ± 3.5
Left knee -10.2 9.1 0.5 ± 3.8 -18.8 0.4 -5.8 ± 4.7
Maximum value
Right knee 46.3 70.9 57.6 ± 5.9 -0.5 31.6 9.4 ± 7.3
Left knee 44.3 69.3 55.8 ± 6.3 -2.6 28.8 6.6 ± 7.6
Some methodological features may have been responsible for the difference in results between the study by Maupas et al.10,11 and the present study, such as the subject recruitment, positioning of sensors, reference position and equipment calibration, etc. Furthermore, the procedures adopted in this study were reproduced in the same way for all the individuals evaluated, and this may have filtered out some of the sources of variation. It must also be emphasized
that the criterion adopted by Maupas et al.10,11 to define asymmetry (difference of 5º in knee range of motion) was arbitrary and may not have been sufficiently sensitive to express significant variations from a functional point of view. Some points also deserve to be discussed in relation to photogrammetry. Although the placing of the markers at the anatomical points and the positioning of the individual and the camera were systematically controlled, other factors
-1 0 1 2 3 4 5 6 7 8 9 10 11 12
-1 0 1 2 3 4 5 6 7 8 9 10 11 12
Stat ic difference - sagit tal plane
R
O
M
d
if
fer
en
ce
s
ag
it
ta
l p
la
n
e
-1 0 1 2 3 4 5 6 7 8 9 10 11 12
-1 0 1 2 3 4 5 6 7 8 9 10 11 12
St atic difference - frontal plane
R
O
M
d
iffe
re
n
c
e
- fro
n
ta
l p
la
n
may have influenced the static measurements. The difference between the knees, from photos, appeared to be better identified in the frontal plane than in the sagittal plane. In the frontal plane, the measurements of both knees were obtained from the same photo; and for the sagittal plane, there was movement of the individual so that the other side of the body could be photographed. It is believed that there might have been differences between the knees in the sagittal plane caused by the positioning and repositioning of the individual and not necessarily to a structural asymmetry. Moreover, the sagittal plane has greater range of motion than the frontal plane does, and for this reason it is expected that the variation between photographs may also be greater. With regard to repositioning, new procedures for avoiding the occurrence of this possible source of variation should be considered in future studies. Intra and inter-examiner reliability and the repeatability of postural evaluations were investigated by Iunes et al.14. These authors investigated several postural parameters, including the angles of the knee in the sagittal and frontal planes. The inter-examiner reliability was considered to be excellent (ICC between 0.943 and 0.996), while the intra-examiner reliability was lower (ICC between 0.385 and 0.955) and the repeatability of the angles obtained by means of photos at one-week intervals was low (ICC between 0.575 and 0.782). These authors suggested that the method is not recommended for following up postural changes because of its low repeatability. The quality of the postural evaluation method may be improved with adequate training for the evaluators and reduction of the number of evaluators who perform the test, thereby increasing the intra and inter-examiner reliability. These procedures may minimize the differences between postural evaluations. However, postural variations between individuals cannot be totally controlled for, regardless of the evaluation method used.
Although the static differences did not show any relationship with the dynamic differences, postural configurations of valgus or varus cause unequal overload between the medial and lateral compartments of the knee, which may subsequently alter the functionality of the gait movement. Thus, this subject deserves to be better investigated in future studies, in which larger groups with accentuated postural abnormalities can be evaluated.
Support: CAPES and (FAPESP) – Procedure Nos. 2004/07207-0 and 04/ 15579-5.
REFERENCES
1. Sadegui H, Allard P, Prince F, Labelle H. Symmetry and limb dominance in able-bodied gait: a review. Gait Posture. 2000;12:34-45.
2. Watson AWS, Mac Donncha C. A reliable technique for the assessment of posture: assessment criteria for aspects of posture. J Sports Med Phys Fitness. 2000;40:260-70.
3. Watkins MA, Riddle DL, Lamb RL, Personius WJ. Reliability of goniometric measurements and visual estimates of knee range of motion obtained in a clinical setting. Phys Ther. 1991;71(2): 90-6.
4. Viton JM, Timsit M, Mesure S, Massion J, Franceschi JP, Delarque A. Asymmetry of gait initiation in patients with unilateral knee arthritis. Arch Phys Med Rehabil. 2000;81: 194-200.
5. Shiratsu A, Coury HJCG. Reliability and accuracy of different sensors of a flexible electrogoniometer. Clin Biomech. 2003; 18(7):682-4.
6. Biometrics Ltd. Goniometer and torsiometer operating manual. Gwent: UK; 1997.
7. Hansson GÅ, Balogh I, Ohlsson K, Skerfving S. Measurements of wrist and forearm positions and movements: effect of, and compensation for goniometer crosstalk. J Electromyogr Kinesiol. 2004;14(3):355-67.
8. Norkin CC, White DJ. Medida do movimento articular: manual de goniometria. 2ª ed. Porto Alegre (RS): Artes Médicas; 1997.
9. Sadegui H, Allard P, Duhaime M. Functional gait asymmetry in able-bodied subjects. Hum Mov Sci. 1997;16:243-58.
10. Maupas E, Paysant J, Martinet N, André JM. Asymmetry leg activity in healthy subjects during walking, detected by electrogoniometry. Clin Biomech. 1999;14:403-11.
11. Maupas E, Paysant J, Datie AM, Martinet N, André JM. Functional asymmetries of the lower limbs. A comparison between clinical assessment of laterality, isokinetic evaluation and electrogoniometric monitoring of knees during walking. Gait Posture. 2002;16:304-12.
12. Gross J, Fetto J, Rosen E. Exame musculoesquelético. 1ª ed. Porto Alegre (RS): Editora Artmed; 2000.
13. Kadaba MP, Ramakrishnan HK, Wootten ME, Gainey J, Gordron G, Cochran GVB. Repeatibility of kinematic, kinetic and electromyographic data in normal adult gait. J Ortop Res. 1989;7:849-60.