©Revista Brasileira de Fisioterapia
ANKLE MOVEMENTS DURING NORMAL GAIT EVALUATED BY FLEXIBLE
ELECTROGONIOMETER
M
ORIGUCHICS, S
ATOTO
EG
ILC
OURYHJC
Departamento de Fisioterapia, Centro de Ciências Biológicas e da Saúde, Universidade Federal de São Carlos, São Carlos, SP - Brasil
Correspondência para: Cristiane Shinohara Moriguchi, Departamento de Fisioterapia, Universidade Federal de São Carlos, Rodovia Washington Luís, km 235, CEP 13565–905, São Carlos, SP – Brasil,
e-mail: [email protected]
Recebido: 09/08/2006 - Revisado: 13/11/2006 - Aceito: 20/03/2007
ABSTRACT
Objective: To evaluate ankle movements of healthy individuals walking on a treadmill, by means of a flexible electrogoniometer. Method: Dorsiflexion and plantar flexion and eversion/inversion movements were recorded for 90 seconds at a velocity of 5.0 km/h. Ten healthy young men of mean age 21.4 ± 2.99 years and mean height 1.62 ± 0.22 meters took part in this study. The data were analyzed descriptively (mean, standard deviation, maximum and minimum). In the sagittal plane, the gait cycle was analyzed at three times, taking the movement peaks: foot flat (FF), midstance (M) and toe off (TO). The inversion and eversion angles corresponding to these phases were identified, as well as movement peaks during gait cycles. Inter and intra-subject coefficients of variability (CV) were calculated. Results: The mean values for the sagittal plane, for the left and right ankles were, respectively: 7º and 4º at FF, 2º and 7º at M, and 24º and 19º at TO. For the frontal plane, the results were inversion of 5º and 3º FF, 4º and 5º at M, and 15º and 16º at TO. The peak values were inversion of 17º and 18º and eversion of 1º. The maximum intra-subject CV was 0.39, and the maximum inter-intra-subject CV was 0.44. Conclusion: The results obtained from the electrogoniometer were relatively similar to data reported in the literature for the sagittal plane, but not for the frontal plane. The discrepancies between studies measuring ankle movements suggest the need for standardization of the recording procedures.
Key words: gait; ankle; kinematics; electrogoniometer.
RESUMO
Movimentos do tornozelo durante a marcha normal avaliados por eletrogoniometria flexível
Objetivo: Avaliar os movimentos do tornozelo de indivíduos saudáveis durante a marcha em esteira por eletrogoniometria flexível. Método: Os movimentos de dorsiflexão/flexão plantar e inversão/eversão foram registrados durante 90 segundos na velocidade de 5,0 km/h. Dez jovens saudáveis do gênero masculino, com idade média de 21,4 ± 2,99 anos, altura média de 1,62 ± 0,22 metros participaram do estudo. Os dados foram analisados descritivamente (média, desvio-padrão, valores mínimo e máximo). No plano sagital, o ciclo da marcha foi analisado em três momentos, considerando os picos de movimento: pé plano (PP), médio apoio (MA) e retirada dos dedos (RD). Foram identificados os ângulos de inversão/eversão correspondentes a essas fases, bem como os picos de movimento durante os ciclos da marcha. Foi calculado o coeficientes de variação (CV) inter e intra-sujeitos. Resultados: Os valores médios do plano sagital para o tornozelo esquerdo e direito foram respectivamente: 7º e 4º no PP, 2º e 7º no MA, 24º e 19º na RD. No plano frontal, os resultados foram: 5º e 3º de inversão no PP, 4º e 5º de inversão no MA, 15º e 16º de inversão na RD, valores picos foram 17º e 18º de inversão e 1º de eversão. O CV intra-sujeito máximo foi de 0,39 e o intersujeitos foi 0,44. Conclusão: Os resultados obtidos por meio do eletrogoniômetro são relativamente similares aos dados reportados pela literatura para o plano sagital, mas não para o plano frontal. As discrepâncias entre os estudos que avaliam movimentos do tornozelo sugerem a necessidade de padronização dos procedimentos de registro.
INTRODUCTION
The term “ankle joint complex” refers to the structure composed by the ankle and subtalar joints1. Movements of
the ankle are important for normal coordinated gait and smooth sinusoidal oscillation of the center of gravity2. The subtalar
joint is responsible for the greatest proportion of the inversion/ eversion of the foot. It allows the foot to accommodate to irregular terrain, provides shock absorption and also acts as a rigid segment for propulsion of the body during the toe-off phase of the gait3.
Measurements of human functional movements allow movement patterns for specific populations to be characterized and “normal or expected” patterns to be identified. These data are essential for identifying abnormal patterns and characterizing impairments, disabilities and handicaps. Through description of the mean values and the expected variation for normal subjects, it is possible to establish guidelines for making clinical decisions and determining the efficacy of treatment programs.
To evaluate dynamic activities such as gait, recordings of angular movement should be continuous and be obtained by precise equipment. Three-dimensional optoelectronic systems, fluoroscopy, accelerometers/gyroscopes, electro-magnetic and ultrasound tracking systems, potentiometric electrogoniometers and force platforms have been utilized for evaluating gait. Although optoelectronic systems have been considered precise, their calibration procedures and data analysis are also considered time-consuming. On the other hand, the precision of potentiometric electrogoniometers seems to be compromised due to their inability to follow the changes of the axis of joint rotation that take place during movements.
Flexible electrogoniometers have also been utilized for functional assessment of different joints, such as the wrist, knee and lumbar spine. Their advantages are that they are lightweight, portable, easily applicable, do not interfere in the activities performed, do not restrict movements and adapt well to body segments4,5. Moreover, such equipment presents
high reproducibility when utilized together with a suitable measurement protocol, with standardization of the position of the subject and the sensors6,7. According to Shiratsu and
Coury8 these electrogoniometers can be considered accurate,
with an error of less than 5º for large movements, and minimal error in movements between 0º and 10º. Although this equipment has been utilized in passive measurements of the ankle joint complex6,7, no studies on dynamic and functional
recording of ankle movements were found in the pertinent literature. Hence, there is a need for a database of gait recordings from healthy subjects, for use in clinical settings and research.
Thus, the objective of the present study was to evaluate the movements of dorsiflexion and plantar flexion and inversion/eversion of the ankle joint complex in healthy young
individuals walking on a treadmill at a controlled velocity (5.0 km/h), using a flexible biaxial electrogoniometer.
METHODS
Subjects
Ten healthy male individuals of mean age 21.4 ± 2.99 years, mean mass 64.7 ± 5.37 kilograms and mean height 1.62 ± 0.22 meters took part in this study. However data from only seven subjects were fully analyzed, since data from three right legs presented technical problems during data analysis. None of the individuals had presented any reports of pain in their knees, ankles or subtalar joints over the past year. They had no histories of leg injuries or equilibrium disorders, no real or apparent discrepancies in leg length, and no knee or foot postural alterations. To obtain this homogeneous sample, a much larger group of individuals (N= 70) went through a screening process.
The individuals selected were informed about the objectives of the study, and signed a form giving their informed consent to the procedures. The project had been approved by the Research Ethics Committee of the Federal University of São Carlos (Protocol number 035/04).
Material and Equipment
A specific ankle electrogoniometer sensor (model SG110/A, data logger DL1001, software version 3.2; Biometrics, Gwent, UK), an ergometric treadmill and a digital chronometer were utilized.
Procedures
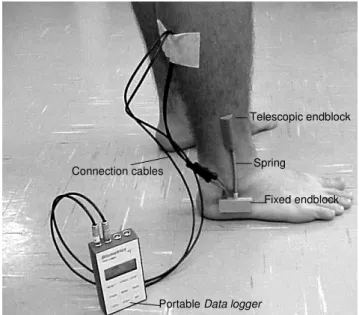
For the data collection, a lateral portion of the leg close to the ankle was shaved and cleaned. Telescopic and fixed electrogoniometer endblocks were attached to the ankle joint as shown in Figure 1. The fixed endblock was positioned parallel to the major axis of the foot, below the lateral malleolus, and the telescopic endblock was aligned with the major axis of the leg.
With the sensor attached, the data logger (data acquisi-tion unit) was calibrated with the subjects in a neutral posiacquisi-tion: standing in a relaxed posture, with body weight distributed equally between the two feet, in stationary equilibrium. Dorsiflexion and inversion were taken to be positive and the sampling rate adopted was 1000 Hz. After a two-minute familiarization period, 90 seconds of data were recorded on the treadmill at a velocity of 5.0 km/h.
malleolus. This was placed in the gauging device, which performed pure plantar flexion and dorsiflexion movements. This test showed that the mean values for frontal plane movements recorded while performing the pure dorsiflexion and plantar flexion movements were close to zero (mean error of 0.3º), and the maximum error found was 1.5º. These results showed that the lateral malleolus seemed not to alter the electrogoniometer recordings of inversion/eversion.
Data analysis
At the sagittal plane, each cycle was analyzed by means of three peaks: foot flat (FF), midstance (M) and toe off (TO). The corresponding inversion/eversion angles for these phases were identified. Inversion and eversion peaks were also assessed. The curves and analyzed peaks are shown in Figure 3. Mean values, standard deviation (SD) and maximum and minimum peaks achieved by the individuals while walking were calculated.
A pilot study was done using the same procedure described above, using foot switches at the heel and at the second metatarsal head, to determine heel strike (HS) and toe off (TO), consequent gait events and the gait cycle. Comparison of the peaks in the sagittal and frontal planes, with and without foot switches, did not reveal any difference. The coefficient of variation (CV) described by Winter9
was also calculated in order to measure variability for a single individual (between strides), and between different individuals. This was obtained by applying the following formula: Portable Data logger
Connection cables
Fixed endblock Telescopic endblock
Spring
Figure 1. Endblocks attached to subject and connected to data logger.
Figure 2. A. Gauging device with lateral malleolus cast and spring distension; B. Jig motion and spring gliding on the cast.
A B
Figure 3. Ankle movement peaks analyzed from data collection with and without foot switches at sagittal and frontal plane. -20 -15 -10 -5 0 5 10 15 20
1 11 21 31 41 51 61 71 81 91 101
gait cycle (%)
pl a nt a r/ dor s i f le x io n ( º)
no foot sw itches foot sw itches
-20 -15 -10 -5 0 5 10 15 20
1 11 21 31 41 51 61 71 81 91 101
gait cycle (%)
eve rsi o n /i n ver si o n ( º)
no foot sw itches foot sw itches -20 -15 -10 -5 0 5 10 15 20
1 11 21 31 41 51 61 71 81 91 101
gait cycle (%)
pl a nt a r/ dor s i f le x io n ( º)
no foot sw itches foot sw itches -20 -15 -10 -5 0 5 10 15 20
1 11 21 31 41 51 61 71 81 91 101
gait cycle (%)
pl a nt a r/ dor s i f le x io n ( º)
no foot sw itches foot sw itches
-20 -15 -10 -5 0 5 10 15 20
1 11 21 31 41 51 61 71 81 91 101
gait cycle (%)
eve rsi o n /i n ver si o n ( º)
no foot sw itches foot sw itches -20 -15 -10 -5 0 5 10 15 20
1 11 21 31 41 51 61 71 81 91 101
gait cycle (%)
eve rsi o n /i n ver si o n ( º)
no foot sw itches foot sw itches
RESULTS
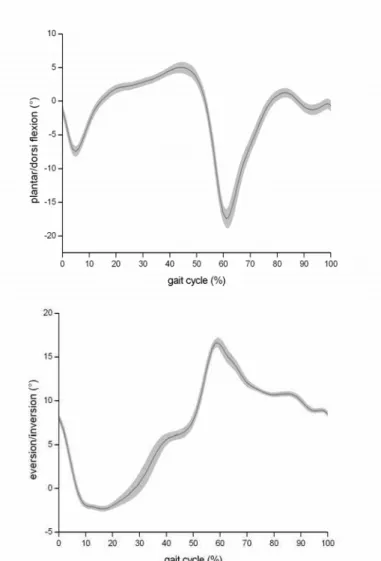
The angles obtained from different phases of the gait cycle for the sagittal and frontal plane, for a typical subject, are presented in Figure 4.
Table 1 shows the means, standard deviations and maximum and minimum values recorded for the sagittal and frontal planes, for the right and left sides. In the sagittal plane, the values are presented for each peak during the gait cycle and for the range of motion (ROM) between two consecutive gait events (FF to M and M to TO). In the frontal plane, the corresponding inversion and eversion movements at these gait events and the maximum and minimum values during the gait cycle are presented.
Figure 4. Mean (solid line) and standard deviation zone (gray band) of ankle at sagittal plane as function of gait cycle percentage of a representative subject. Positive values are dorsiflexion and negative are plantar flexion.
Table 1. Mean (X), standard deviation (SD), minimum (min) and maximum (max) values for ankle motion during the gait cycle in the sagittal and frontal planes for the right and left sides. For the sagittal plane, the range of motion between two consecutive gait events is presented. For the frontal plane, inversion and eversion peaks and frontal plane motion corresponding to sagittal plane events are also presented. Negative values correspond to plantar flexion and eversion.
SAGITTAL PLANE LEFT X ± SD (min/max)
RIGHT X ± SD (min/max) Foot flat (FF) -7.2º ± 3.33º
(1.1º/-10.8º)
-4.2º ± 2.29º (-0.7º/-8.2º) Midstance (M) 2.6º ± 2.51º
(0.2º/9.2º)
7.0º ± 1.69º (5.1º/9.5º) Toe Off (TO) -23.9º ± 6.81º
(-16.2º/-37.7º)
-19 º± 5.24º (-12.5º/-27.6º) ROM FF-M 9.8º ± 1.17º
(8º/11º)
11.3º ± 1.7º (9.4º/14.1º) ROM M-TO -26.5º ± 7.81º
(-17.5º/-40.8º)
-26º± 5.66º (-20.2º/-36.3º)
FRONTAL PLANE
Foot flat (FF) -5.4º ± 1.5º (-3.9º/-8.3º)
-3.4º ± 3.28º (-3.2º/-6.9º) Midstance (M) -4.2º ± 1.49º
(-1.6º/-6.6º)
-5º ± 3.48º (1.2º/-10.3º) Toe Off (TO) -15.4º ± 3.74º
(-12º/-24º)
-16.4 º± 7.04º (-3.6 º/-26.8º) Maximum inversion -16,8º ± 3.62º
(-12.8º/-24.7º)
-18.5º ± 5.42º (-9.60º/-26.9º) Maximum eversion 0.7º ± 1.05º
(0.8º/-1.9º)
1.2º ± 2.81º (7º/-1.7º)
The difference between the left and right sides in the sagittal plane ranged from 3º to 5º; by comparing amplitudes, the difference reduced to 1.5º and 0.5º. In the frontal plane, the foot was inverted during almost the entire gait cycle and the mean value for inversion was much greater than for eversion.
Table 2. Intra and inter-subject coefficients of variation (CV) for the sagittal and frontal planes.
Intra-subject CV Sagittal plane Frontal plane
Subjects Left Right Left Right
characteristics allow accurate clinical evaluations, thereby meeting the need presented by the lack of such sources, considering that physical therapy gait evaluation is usually performed by visual estimation, which has low reproducibility and accuracy in clinical settings. Other advantage is the possibility of analyzing a large quantity of data, bilaterally, which is not easily performed by most of the accurate equipment available.
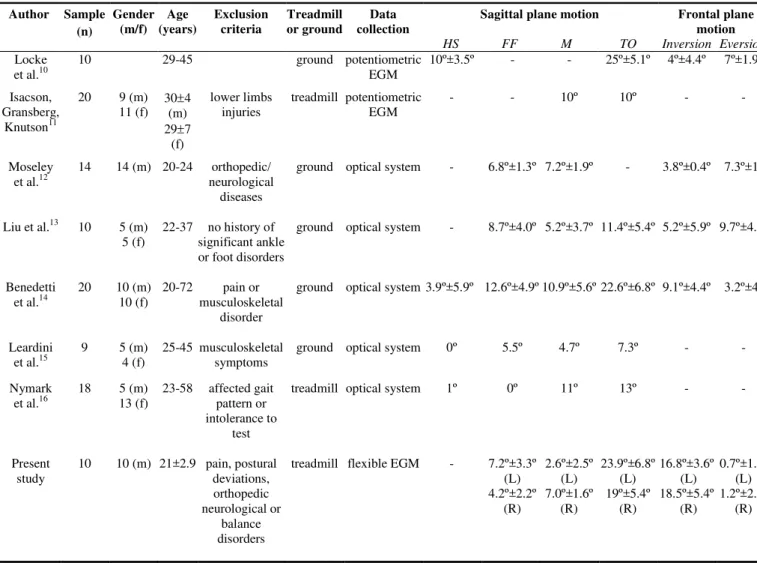
To facilitate comparisons between the present results and other studies already published, Table 3 is presented. The variability between the results from the reported studies suggests that there is a lack of standardized procedures for evaluating these joints.
The values found in the sagittal plane were close to the ranges reported in the literature. It was only in relation to the M peak that this did not occur. The latter finding can be explained by the data collection procedures, particularly by the treadmill gait recordings. According to Nymark et al.16,
dorsiflexion is reduced at M when comparing overground and treadmill gait. These authors found an ankle range of
Table 3. Results from previous studies and the present study, regarding mean values for ankle range of motion for the sagittal and frontal planes during gait, for healthy subjects.
Sagittal plane motion Frontal plane motion Author Sample
(n)
Gender (m/f)
Age (years)
Exclusion criteria
Treadmill or ground
Data collection
HS FF M TO Inversion Eversion
Locke
et al.10 10 29-45 ground potentiometric EGM 10º±3.5º - - 25º±5.1º 4º±4.4º 7º±1.9º Isacson,
Gransberg, Knutson11
20 9 (m) 11 (f) 30(m) ±4
29±7 (f)
lower limbs
injuries treadmill potentiometric EGM - - 10º 10º - -
Moseley
et al.12 14 14 (m) 20-24 orthopedic/ neurological diseases
ground optical system - 6.8º±1.3º 7.2º±1.9º - 3.8º±0.4º 7.3º±1º
Liu et al.13 10 5 (m)
5 (f) 22-37 no history of significant ankle or foot disorders
ground optical system - 8.7º±4.0º 5.2º±3.7º 11.4º±5.4º 5.2º±5.9º 9.7º±4.9º
Benedetti
et al.14 20 10 10 (f) (m) 20-72 pain musculoskeletal or disorder
ground optical system 3.9º±5.9º 12.6º±4.9º 10.9º±5.6º 22.6º±6.8º 9.1º±4.4º 3.2º±4º
Leardini
et al.15 9 5 4 (f) (m) 25-45 musculoskeletal symptoms ground optical system 0º 5.5º 4.7º 7.3º - - Nymark
et al.16 18 5 13 (f) (m) 23-58 affected pattern or gait intolerance to
test
treadmill optical system 1º 0º 11º 13º - -
Present
study 10 10 (m) 21±2.9 pain, postural deviations, orthopedic neurological or
balance disorders
treadmill flexible EGM - 7.2º±3.3º (L) 4.2º±2.2º
(R)
2.6º±2.5º (L) 7.0º±1.6º
(R)
23.9º±6.8º (L) 19º±5.4º
(R)
16.8º±3.6º (L) 18.5º±5.4º
(R)
0.7º±1.0º (L) 1.2º±2.8º
(R)
The intra-subject variability was smaller than the inter-subject variability for the movements occurring in both planes for almost all subjects. Only one subject presented intra-subject CV that was higher than the inter-subject CV (see Table 2). The intra-subject CV was smaller for the frontal than for the sagittal plane, while the inter-subject CV was similar for the two planes.
DISCUSSION
The results provided angular parameters for the gait of healthy young men on a treadmill at a velocity of 5.0 km/h, by means of a flexible electrogoniometer. Since no other studies utilizing a flexible electrogoniometer during gait were identified in the available literature, these results may be helpful for similar subjects, as a database on a healthy population.
motion of 30.9º ± 5.7º at natural speed on a treadmill, which was close to the value for the right ankle in the present study. On the other hand, for frontal plane movements, the results reported in the literature differed from those obtained in the present study. The mean values for inversion reached 19º in the present study, while other reports describe lower values (maximum of 9.1º). In general, the opposite occurred for eversion movements in the present study.
Measurement or crosstalk errors must always be taken into account when different measurements are identified. Moreover, determination of the exact planes around which the movement takes place is important for avoiding electrogoniometer crosstalk17. Another possible source of
error could be the presence of the malleolus under the spring. However, the pilot study carried out on the prototype showed that the sliding of the electrogoniometer spring over the malleolus did not interfere with the measurements of ankle inversion and eversion during the tests.
Determining the location of the axis around which the subtalar inversion and eversion movements take place is a matter of some controversy. The location of this axis seems to vary greatly between individuals. According to some authors, this axis presents a fixed oblique orientation (42º to the horizontal direction of the foot, and 23º to the medial direction)2. According to other authors, the subtalar joint has
several instantaneous movement axes, rather than a single fixed one18,19, and the existence of as many as 12 axes has
even been accepted20. Currently, no equipment is capable of
handling this complexity. Equipment of greater sensitivity for following the different instantaneous axes needs to be developed and more studies should be conducted in order to refine the data available.
Identification of the neutral position of the ankle is another important issue for standardization of gait measurement procedures6,12. Ball and Johnson6 utilized a
method involving manual palpation to identify the neutral position of the subtalar joint. According to Moseley et al.12,
this position should be identified when the subjects are seated and bearing no body weight. In the present study, the neutral posture was established when the individual was standing relaxed with his weight supported equally by the two legs. The same procedure was described by Nester et al.21. This
procedure was adopted in order to ensure reproducibility between individuals, and because this was closer to the functional situation measured than were the other procedures described.
In the present study, around 80 gait cycles from each individual were analyzed. Kaufman et al.22 stated that at least
22 cycles are needed for obtaining precise data. Therefore, the number of cycles analyzed can be considered to be representative of the movement pattern of each subject.
With regard to intra and inter-subject variability, the intra-subject variability between cycles was smaller than was the variability between different individuals. This occurred despite
the fact that the subjects analyzed were anthropometrically similar. Furthermore, this variable was systematically controlled for in the present study. This suggests that, for normal individuals who are relatively homogeneous, the pattern of movements taken as “normal” or expected may present a relatively wide range in studies of this type. Therefore, this suggests caution in analyzing the pattern of motion of these joints and reinforces the need for more accurate equipment and procedures.
Greater inter-individual than intra-individual variability in dorsiflexion and plantar flexion movements has also been described in the literature11,15. This suggests that a single
individual’s gait presents a regular pattern of movements, with little variation between cycles when the velocity is constant, but that individuals differ from each other. These results have clear clinical implications and should be taken into account in clinical gait analysis.
CONCLUSION
The large variations between the results obtained by different authors suggest that there is a need for greater standardization of measurement procedures, especially with regard to determining the neutral position of the ankle joint. In the sagittal plane, the values identified were relatively similar to those found in other studies that utilized video motion analysis systems or potentiometric electrogoniometers. On the other hand, in the frontal plane, higher inversion values were identified in the present study.
Relatively low intra-individual variability was identified. However, the higher inter-individual variability found suggests that the ankle movement pattern can vary greatly, even among anthropometrically similar individuals.
Acknowledgements: CNPq – Processo 114328/03-0, FAPESP - Processos
N. 2004/07207-0 e 04/15579-5.
REFERENCES
1. Wu G, Segler S, Allard P, Kirtley C, Leardini A, Rosenbaum D. ISB recommendation on definitions of joint coordinate system of various joints for the reporting of human joint motion. J Biomech. 2002;35:543-8.
2. Inman VT, Ralston HJ, Todd F. Human locomotion. In: Rose J, Gamble JG, editores. Human walking. 2ª ed. Baltimore: Williams
& Wilkins; 1994. p. 1-22.
3. Tiberio D. Evaluation of functional ankle dorsiflexion using subtalar neutral position: a clinical report. Phys Ther.1987;67: 955-7.
4. Tesio L, Monzani M, Gatti R, Franghignoni F. Flexible electro-goniometers: kinesiological advantages with respect to potentiometric goniometers. Clin Biomech. 1995;10:275-7. 5. Rowe PJ, Myles CM, Hillmann SJ, Hazlewood ME. Validation
6. Ball P, Johnson GR. Reliability of hindfoot goniometry when using a flexible electrogoniometer.Clin Biomech.1993;8:13-9. 7. Ball P, Johnson GR. Technique for the measurement of hindfoot inversion and eversion and its use to study a normal population. Clin Biomech. 1996;8:165-9.
8. Shiratsu A, Coury HJCG. Reliability and accuracy of different sensors of a flexible electrogoniometer. Clin Biomech. 2003;18:682-4.
9. Winter DA. Kinematic and kinetic patterns in human gait: variability and compensating effects. Hum Mov Sci. 1984;3: 51-76.
10. Locke M, Perry J, Campbell J, Thomas L. Ankle and subtalar motion during gait in arthritic patients. Phys Ther. 1984;64: 504-9.
11. Isacson J, Gransberg L, Knutsson E. Three-dimensional electrogoniometric gait recording. J Biomech. 1986;19:627-35. 12. Moseley L, Smith R, Hunt A, Gant R. Three-dimensional kinematics of the rearfoot during the stance phase of walking in normal young adult males. Clin Biomech.1996;11:39-45. 13. Liu W, Siegler S, Hillstrom H, Whitney K. Three-dimensional,
six-degrees-of-freedom kinematics of the human hindfoot during the stance phase of level walking. Hum Mov Sci. 1997;6: 283-98.
14. Benedetti MG, Catani F, Leardini A, Pignotti E, Giannini S. Data management in gait analysis for clinical applications. Clin Biomech. 1998;13:204-15.
15. Leardini A, Benedetti MG, Catani F, Simoncini L, Giannini S. An anatomically based protocol for the description of foot segment kinematics during gait. Clin Biomech. 1999;14:528-36. 16. Nymark JR, Balmer SJ, Melis EH, Lemaire ED, Millar S.
Electromyographic and kinematic nondisabled gait differences at extremely slow overgroung and treadmill walking speeds. J Rehab Res Dev. 2005;42:523-34.
17. Hansson G-Å, Balogh I, Ohlsson K, Skerfving S. Measurement of wrist and forearm positions and movements: effect of, and compensation for, goniometer crosstalk. J Electromyogr Kinesiol. 2004;14:355-67.
18. Zografos S, Chaminade B, Hobatho MC, Utheza G. Experimen-tal study of the subExperimen-talar joint axis preliminary investigation. Surg Radiol Anat. 2000;22:271-6.
19. Leardini A, Stagni R, O’Connor JJ. Mobility of the subtalar joint in the intact ankle complex. J Biomech. 2001;34:805-9. 20. American Medical Association. Range of motion assessment
-the practical guide to range of motion assessment. Chicago: American Medical Association; 2002.
21. Nester CJ, van der Linden ML, Bowker P. Effect of foot ortho-ses on the kinematics and kinetics of normal walking gait. Gait Posture 2003; 17: 180-7.