Nota Técnica
*e-mail: [email protected]
SIMULTANEOUS AND ACCURATE DETERMINATION OF WATER- AND FAT-SOLUBLE VITAMINS IN MULTIVITAMIN TABLETS BY USING AN RP-HPLC METHOD
Semahat Kucukkolbasi*
Selcuk University, Faculty of Science, Department of Chemistry, 42075, Campus-Konya/Turkey Onur Bilber
National Food Reference Laboratory, Fatih Sultan Mehmet Avenue, 70, 06170, Ankara/Turkey H. Filiz Ayyildiz and Huseyin Kara
Selcuk University, Faculty of Science, Department of Chemistry, 42075, Campus-Konya/Turkey
Recebido em 14/10/12; aceito em 22/2/13; publicado na web em 24/5/13
In the present study, a reversed-phase high-performance liquid chromatographic (RP-HPLC) procedure was developed and validated for the simultaneous determination of seven water-soluble vitamins (thiamine, riboflavin, niacin, cyanocobalamin, ascorbic acid, folic acid, and p-aminobenzoic acid) and four fat-soluble vitamins (retinol acetate, cholecalciferol, α-tocopherol, and phytonadione) in multivitamin tablets. The linearity of the method was excellent (R2 > 0.999) over the concentration range of 10–500 ng mL−1. The statistical evaluation of the method was carried out by performing the intra- and inter-day precision. The accuracy of the method was tested by measuring the average recovery; values ranged between 87.4% and 98.5% and were acceptable quantitative results that corresponded with the label claims.
Keywords:simultaneous determination; water-soluble and fat-soluble vitamins; RP-HPLC.
INTRODUCTION
Vitamins are a broad group of organic compounds that are mi-nor but essential constituents of food required for mi-normal growth, self-maintenance, and the functioning of human and animal bodies.1
In addition, the nutritional necessity of vitamins increases during pregnancy, lactation, and growth periods under the conditions of intensive work and when fighting diseases, particularly those that are infectious.2
Traditionally, vitamins have been classified as fat-soluble (A, D, E, and K) and water-soluble (C and the B complexes B1, B2, B3, B5, B6, B8, B9, and B12).3 Because these vitamins are not naturally
synthesized in the human body, a balanced diet is mandatory in order to maintain the quantity of vitamins at the required level. However, at times, dietary habits can create a deficiency of these vitamins. For these conditions, multivitamin tablets are available in the market for the adequate supply of vitamins. While most multivitamin tablets contain at least 10 vitamins with a wide range of doses, the content of each vitamin must conform to strict specifications established by nutritionists. Therefore, the quality control of multivitamin tablets is very important, and the widespread use of multivitamin preparations has stimulated research into the development of accurate, efficient, and easy methods for quality control.4,5
The standard6 and official analytical methods for vitamin analysis7
are tedious and involve a pre-treatment of the sample through com-plex chemical, physical, or biological reactions in order to eliminate interference of other constituents in the vitamin, which is typically followed by individual methods for each different vitamin. Many analytical methods, such as those based on UV-Vis spectrophotom-etry,8 fluorimetry,9 chemiluminiscence,10 capillary electrophoresis,11
microbiology,12 and high-performance liquid chromatography13-17
have been proposed only for the determination of water-soluble or fat-soluble vitamins and are tedious, sometimes nonspecific, and time-consuming.18 Among them, both normal and reversed-phase
HPLC19 techniques are most widely used and provide rapid,
sensi-tive, and accurate vitamin analysis and are often used with detection modes, including UV spectrometry with a diode array,fluorometry, and electrochemical detection.20-22
However, few methods using HPLC have been developed for the simultaneous determination of water- and fat-soluble vitamins. A rapid, reliable, and reproducible method based on microemulsion electro kinetic chromatography for the simultaneous determination of 13 types of water- and fat-soluble vitamins was developed.23 Separate methods
based on reversed-phase HPLC for the determination of eight water-soluble vitamins and seven fat-water-soluble vitamins were proposed.24 A
method for the simultaneous determination of 12 water- and fat-soluble vitamins using gradient HPLC with diode array detection (DAD) was also developed.13 This method can be applied to the determination of
vitamins in pharmaceutical preparations, food supplements, fortified drinks, and foods with relatively complicated matrices.
Herein, we report the development and optimization of a high-performance liquid chromatographic method using fluorescence detection (FLD) and DAD for the determination of four fat-soluble and seven water-soluble vitamins in a single run. The method was successfully applied to the determination of vitamins in multivita-min tablets, and the separation of the vitamultivita-mins was achieved on a reversed-phase Phenomenex Gemini C18 110A column. The method provides a high degree of chromatographic resolution, sensitivity, and reproducibility, and enables quantitative determination.
EXPERIMENTAL
Samples and chemicals
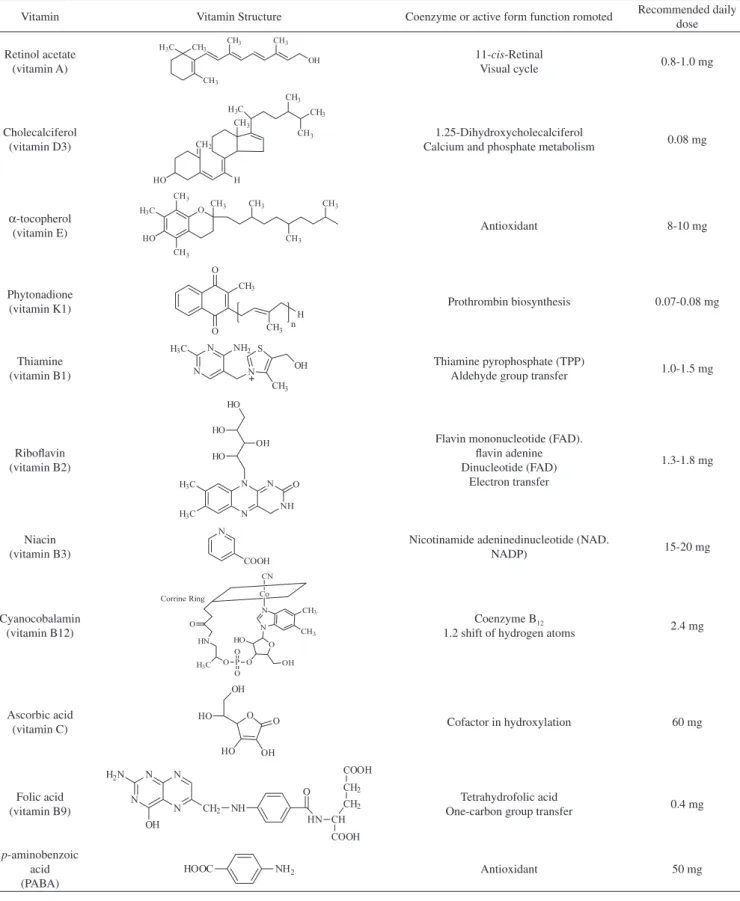
Retinol acetate, cholecalciferol, α-tocopherol, phytonadione, thiamine, riboflavin, niacin, cyanocobalamin, ascorbic acid, folic acid, and p-aminobenzoic acid vitamin standards were purchased from Sigma-Aldrich (purity > 99.0%), while α-tocopherol was supplied by Fluka (purity > 98.5%). The chemical structures, basic biological
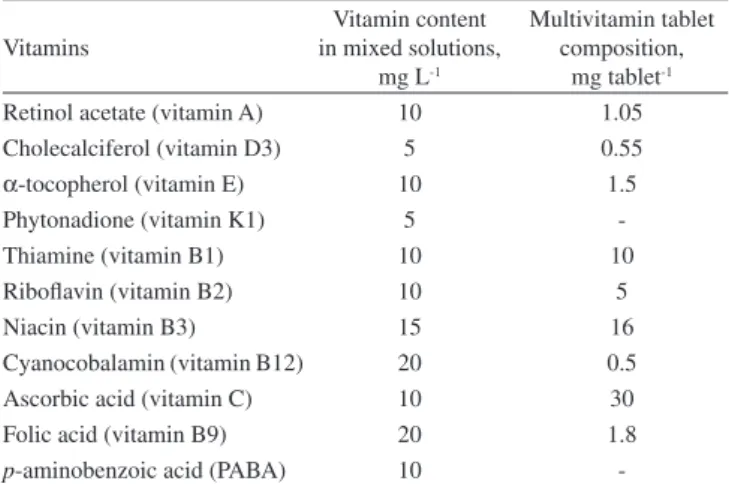
activities, and recommended daily doses of the water- and fat-soluble vitamins are shown in Figure 1. A multivitamin tablet including nine different vitamins was purchased from Şanlı Drug Company. The contents of the vitamins in the multivitamin tablet and the solution prepared for optimization studies are given in Table 1.
Vitamin Vitamin Structure Coenzyme or active form function romoted Recommended daily dose
Retinol acetate (vitamin A)
11-cis-Retinal
Visual cycle 0.8-1.0 mg
Cholecalciferol (vitamin D3)
1.25-Dihydroxycholecalciferol
Calcium and phosphate metabolism 0.08 mg
α-tocopherol
(vitamin E) Antioxidant 8-10 mg
Phytonadione
(vitamin K1) Prothrombin biosynthesis 0.07-0.08 mg
Thiamine (vitamin B1)
Thiamine pyrophosphate (TPP)
Aldehyde group transfer 1.0-1.5 mg
Riboflavin (vitamin B2)
Flavin mononucleotide (FAD). flavin adenine Dinucleotide (FAD)
Electron transfer
1.3-1.8 mg
Niacin (vitamin B3)
Nicotinamide adeninedinucleotide (NAD.
NADP) 15-20 mg
Cyanocobalamin (vitamin B12)
Coenzyme B12
1.2 shift of hydrogen atoms 2.4 mg
Ascorbic acid
(vitamin C) Cofactor in hydroxylation 60 mg
Folic acid (vitamin B9)
Tetrahydrofolic acid
One-carbon group transfer 0.4 mg
p-aminobenzoic acid (PABA)
Antioxidant 50 mg
Standard solutions
Water- and fat-soluble vitamin solutions
The water-soluble vitamins and the fat-soluble vitamins were diluted in deionized water and methanol, respectively, in order to ob-tain stock solutions (approximately 1000 mg L−1). Each solution was
freshly prepared before use and stored in the dark at 4 °C. Working standard solutions in the 0.05–20 mg L−1 range were daily prepared
by step-wise dilution with a water-methanol solution (50:50, v/v).
Mixed standard solution
A mixed standard solution containing the 11 vitamin standards at different concentrations was weekly prepared by using a water–me-thanol solution (50:50, v/v). The composition of the mixed solution is given in Table 1.
Instrumentation
The Agilent 1100/1200 HPLC system used throughout this study consisted of a quaternary pump (1100-G1310A), an auto-sampler (1200-G1329A), a degasser (1200-G1379B), a column thermostat (1200-G1316A), a diode array detector (1100-G1315B), and a fluo-rescence detector (1200-G1312A). Evaluation and quantification were achieved on a Chemstation 2001 data processor that controlled the whole liquid chromatographic system. A reversed-phase Phenomenex Gemini C18 110A column (150 × 4.6 mm, 3.0 µm particle size), purchased from Torrance, CA, was used. The column temperature was held at 30 °C. Chromatographic separations were performed under gradient conditions by using solvent A (0.01% TFA, pH = 4) and solvent B (100% methanol) at a flow rate of 0.7 mL min−1. A
35-min-gradient program was used in the study, beginning with 0.01% TFA and methanol (95:5, v/v) for 4 min, followed by ramping down to 5% TFA over 6.0 min, holding at that ratio for 20 min, and then ramping up to 95% TFA again. The results were monitored with two different detectors (DAD and FLD) and after optimization studies, it was determined which detector is suitable for each vitamin.
Optimization of the chromatographic conditions
In order to determine the most suitable absorption wavelength for the simultaneous detection of the vitamins, the spectra of standard solutions (10 mg L−1) were measured by using DAD for retinol acetate,
cholecalciferol, phytonadione, thiamine, niacin, cyanocobalamin, ascorbic acid, folic acid, and p-aminobenzoic acid, and an FLD de-tector was for α-tocopherol and riboflavin in the range of 190–600 nm. The wavelengths that had the highest intensity were accepted as the optimum values. Studies were then performed with two different columns in order to determine the best column for separation of the vitamins. The properties of the two columns are given in Table 2. To evaluate the separation, the resolution (Rs), symmetry value, and
S/N ratio were taken into account. After column selection, the most appropriate carrier phase composition and flow rate were optimized. The flow rate optimization studies were carried out using five differ-ent flow rates (0.3, 0.5, 0.7, 0.9, 1.1 mL min−1) and 0.01% TFA and
MeOH solutions were used to define the carrier phase composition. To determine the effect of temperature and pH on the separation of multivitamins, studies were performed at 20, 25, 30, 35, and 40 °C and pH values of 2, 3, 4, 5, and 6, respectively. In addition, the separation procedure was performed using the three different gradient profiles listed in Table 3, and the most suitable gradient elution program was chosen for all of further studies.
Selection of the extraction solution ratio
In order to extract the water- and fat-soluble vitamins from the multivitamin tablets, various extraction solutions containing 0.01% TFA and methanol in different ratios were used. During the extrac-tions, the samples were weighted according to the amount of active substance in the tablets, and the solution ratios used in the extraction treatment were as follows: 100:0, 80:20, 50:50, 20:80, and 0:100.
Simultaneous determination of the fat- and water-soluble vitamins in multivitamin tablets
Not less than 20 tablets were accurately weighed and then finely powdered. A portion of the powder equivalent to one average tablet weight was transferred into a beaker. After adding a 0.01% TFA-methanol (10 mL; 80:20, v/v) solution, the mixture was vortexed for 15 min and then centrifuged for 15 min at 5000 rpm. The supernatant was filtered through a 0.45 µm nylon membrane. Next, a 5 µL aliquot of the sample solution was injected into the HPLC system. The chro-matographic procedure was performed using the optimized conditions
Table 1. The amount of water- and fat- soluble vitamins in multivitamin
tablet and mixed solutions
Vitamins
Vitamin content in mixed solutions,
mg L-1
Multivitamin tablet composition,
mg tablet-1 Retinol acetate (vitamin A) 10 1.05 Cholecalciferol (vitamin D3) 5 0.55
α-tocopherol (vitamin E) 10 1.5
Phytonadione (vitamin K1) 5
-Thiamine (vitamin B1) 10 10
Riboflavin (vitamin B2) 10 5
Niacin (vitamin B3) 15 16
Cyanocobalamin (vitamin B12) 20 0.5 Ascorbic acid (vitamin C) 10 30
Folic acid (vitamin B9) 20 1.8
p-aminobenzoic acid (PABA) 10
-Table 2. Physico-chemical properties of two columns used for separation of
the fat- and water- soluble vitamins in a single run
Columns 150 x 4.6 mm x 5.0 µm Agilent Aclipse Plus 150 x 4.6 mm x 3.0 µmPhenomenex Gemini
Surface area (m2/g) 160 375
pH range 2-9 1-12
Pore diameter (Å) 95 110
Table 3. Three different gradient profiles for simultaneous vitamin separation by RP-HPLC
GRADIENT-1 GRADIENT-2 GRADIENT-3
Time (min) 0 5 15 30 35 40 0 5 10 30 35 40 0 4 10 30 35 40
% of mobile phase A (0.01% TFA, pH=4)
98 98 5 5 98 98 100 95 5 5 98 98 95 95 2 2 95 95
% of mobile phase B (100% MeOH)
2 2 95 95 2 2 0 5 95 95 2 2 5 5 98 98 5 5
for gradient elution program III. The retention time, symmetry, and resolution factors were used as criteria for the determination of the separation efficiency. The concentrations of the fat- and water-soluble vitamins were calculated from the integrated areas of the sample and the corresponding standards.
Method validation
Method validation studies were performed by measuring basic parameters such as precision, accuracy, linear region, limits of detec-tion (LOD) and quantificadetec-tion (LOQ), and recovery. The precision of the analytical method was estimated on the basis of the intra-day precision or repeatability and the inter-day precision or intermediate precision. The repeatability was evaluated on results from the same day for ten independent solutions. The intermediate precision was determined by evaluating the repeatability of the analytical method on three different days. The precision was calculated on the basis of the relative standard deviation (RSD %). For the accuracy determination, a triplicate analysis was performed for all of the samples in order to allow measurement of the average deviation. To evaluate the linearity, six standard solutions were prepared for each calibration level, and a linear equation was established for each vitamin by plotting the peak areas versus the concentrations. The LOD and LOQ were calculated for the same chromatographic conditions.25 For the recovery tests for
each vitamin, accurate amounts of the vitamins at high and low levels were added to approximately 1.0 g of powdered multivitamin tablet, and then the powder was extracted and analyzed. Recoveries for the spiked test samples were calculated by comparing the values to the measured recovery of the relevant control. The average recoveries were determined by using the formulas: recovery (%) = (amount found − ori-ginal amount)/amount spiked × 100%; RSD (%) = (SD/mean) × 100%.
RESULTS AND DISCUSSION
Selection of appropriate detector and wavelength
Because the spectral properties of individual vitamins significan-tly differ, it was necessary to select the most suitable wavelength for the simultaneous detection of the fat- and water- soluble vitamins.26
Therefore, the DAD and FLD detectors were tested at several wave-lengths by using 10 mg L−1 standards of the water-soluble vitamins
(thiamine, riboflavin, niacin, cyanocobalamin, ascorbic acid, folic acid, p-aminobenzoic acid) and the fat-soluble vitamins (retinol acetate, cholecalciferol, α-tocopherol, phytonadione). The DAD detector was found to be more appropriate for some of the vitamins, whereas the FLD detector was better suited for others. For this reason, different wavelengths were selected for subsequent experiments based on the theoretical values of the molar absorptivity coefficients of the individual vitamins and the most commonly used wavelengths for vitamin determination.27-29 The peak areas obtained at the maximum
wavelengths for each vitamin by using the two different detectors are summarized in Table 4.
Selection of the appropriate column
The type of chromatographic column has a significant influence on the separation of fat- and water-soluble vitamins. Therefore, two types of chromatographic columns were investigated: an Agilent Aclipse Plus C18-250A (150 mm × 4.6 mm × 5.0 µm) and a Phenomenex Gemini C18 110A column (150 mm × 4.6 mm × 3.0 µm). The performance of the two columns was evaluated by comparing the retention factors of closely neighboring vitamin peaks (thiamine and ascorbic acid and ascorbic acid and niacin) (see Figures 2a and
2b). The results of this comparison indicated that the Phenomenex Gemini C18 110A column was the most suitable one for the separa-tion of both the groups of vitamins in a single run, and this column was thus used for all of the remaining experiments.
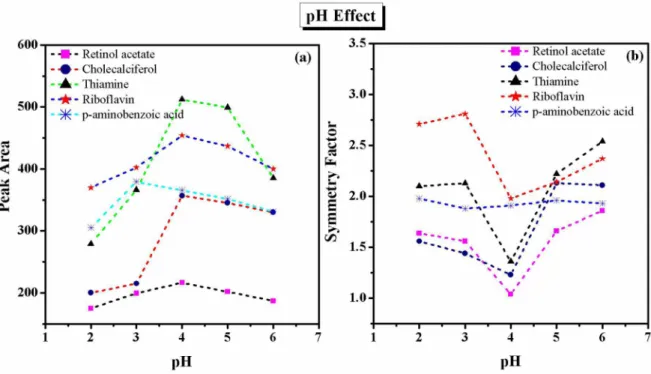
Investigation of pH and temperature effects
The pH value of the 0.01% trifluoroacetic acid in the mobile phase dramatically affects the chromatographic separation of fat- and water-soluble vitamins. The effect of five different pH values (2, 3, 4, 5, and 6) was thus investigated. In this evaluation, the peak area and peak symmetry were taken into account. The results were irreprodu-cible when the pH < 4, and the obtained peaks were broad and poorly resolved. When the pH > 4, low-intensity peaks were observed. On the basis of this analysis, a pH value of 4 was selected as the most suitable for the separation of the fat- and water-soluble vitamins. The results of the evaluation of the peak area and peak symmetry as a function of pH are shown in Figures 3a and 3b, respectively.
Column temperature also affects the efficiency of chromatogra-phic separations. Therefore, in this study, the effect of five different temperatures (20, 25, 30, 35, and 40 °C) was investigated using the retention factor, the symmetry factor, and the peak area as the basic Figure 2. Simultaneous HPLC chromatograms of fat- and water- soluble vita-mins in two different columns; Agilent Aclipse Plus C18-250A (a) Phenomenex Gemini C18 110A column (b). The wavelengths were changed for each vitamin
Table 4. Response values at maximum wavelength obtained from two detectors
Vitamins. 10 mg L-1
Diode Array Detector, DAD
Fluorescence Detector, FLD
λmax.nm Area λExt/λEm. nm Area
Retinol acetate 318 689.32 -
-Cholecalciferol 262 715.32 -
-α-tocopherol 292 165.25 210/335 815.65
Phytonadione 246 436.21 -
-Thiamine 246 687.5 -
-Riboflavin 268 315.42 360/530 335.23
Niacin 262 550.98 -
-Cyanocobalamin 364 315.25 -
-Ascorbic acid 246 521.01 -
-Folic acid 290 63.08 -
-criteria. The most efficient and effective separation was observed at 30 °C. The separation was markedly faster at higher temperature (40 °C) but co-elution gradually appeared. Thus, we selected 30 °C as the optimal temperature for the fast and very effective separation of the fat- and water-soluble vitamins, and this was used in all subsequent experiments. The results of the evaluation of the effect of temperature on the separation can be seen in Figures 4a and 4b.
Optimization of the extraction method
For more complicated matrices, sample preparation is one of the
most critical steps. Therefore, in this study, the sample matrix and the vitamins to be evaluated were considered when selecting an ap-propriate type of extraction method (direct extraction, liquid–liquid extraction (LLE), solid phase extraction (SPE), supercritical fluid extraction SFE, etc.). It is also important to optimize such parameters as the solvent used, the sample/solvent ratio, the extraction time, and the temperature for sample preparation, and if necessary, to assure protection from light and oxygen.30
Many of the studies developed for the quantification of vitamins in various matrices also include extraction procedures, and the solvents used differ according to the type of vitamin (fat-soluble or
Figure 3. pH effect on the simultaneous separation of fat- and water- soluble vitamins by taking into account of the peak area (a) and peak symmetry (b)
Figure 5. The effect of gradient elution on separation of fat- and water- soluble vitamins in a single run gradient program-1 (a) gradient program-2 (b) gradient program-3 (c)
water-soluble). For the separate extraction of fat- and water- soluble vitamins in various matrices, solvents such as methanol:water,31
met-hanol,32 ethanol:orthophosphoric acid:hexane,33 and ethanol:water34,35
have been used. In addition, for the extraction of all of the fat- and water- soluble vitamins, a mixture of TFA:methanol18 and a column
technique with SPE extraction24 have been used.
The present study focused on TFA and methanol as extraction solvents, and they were singly investigated as mixtures. When only TFA was used for the extraction of the vitamins, the disappear-ance of peaks belonging to the fat-soluble vitamins was observed. However, when using only methanol for the extraction, the peaks for the water-soluble vitamins disappeared. On the basis of these results, mixtures of 0.01% TFA at pH 4.0 and methanol in different ratios (100:0; 80:20; 50:50; 20:80 and 0:100) were tested in order to determine the most appropriate mixture for the extraction of vitamins from multivitamin tablets.
On the basis of evaluation of the resolution factors, symmetry factors, and peak areas of the individual analytical signals of the vitamins, it was concluded that a mixture of 0.01% TFA–methanol at an 80:20 v/v ratio was the most suitable solvent for achieving the best extraction and simultaneous baseline separation for all of the vitamins.
HPLC analysis of the vitamins in multivitamin tablets
Next, the optimal conditions for the identification and quantification of four fat-soluble and seven water-soluble vitamins in a formulated multivitamin were investigated and established. The tablet samples were prepared as described in Section 2.6, and then 5 µL aliquot of the sample solutions was injected into the HPLC system. Each assay sample was analyzed six times. Three different gradient elution programs were used to separate the vitamins, and it was found that the best results for the simultaneous determination of these vitamins were obtained with the gradient-3 program at pH 4 and 30 °C by using a mobile phase consisting of 0.01% TFA and methanol. This gradient profile began at 95:5 (TFA:methanol; (v/v)) and was held constant for the first 4 min, then decreased to 5% TFA during the next 6 min and maintained for 20 min at 5% TFA, and was finally linearly increased up to 95% TFA again. The chromatograms obtained using the three gradient profiles are presented in Figures 5a, 5b, and 5c.
Effective separation and quantification of the four fat-soluble
and seven water-soluble vitamins was achieved in less than 40 min. Assay chromatograms for the simultaneous quantification of the fat- and water-soluble vitamins in a commercial multivitamin are shown in Figure 6. Three basic chromatographic parameters (the retention factor, the symmetry factor, and the peak area) were evaluated in these experiments. The chromatograms of the standard sample containing the fat- and water-soluble vitamins and the representative test results exhibited identical retention times. Calibration curves were prepared by plotting the standard vitamin concentration versus the peak area for each vitamin, and the linearity of the calibration curves was ex-cellent (R2 > 0.999) for the concentration range of 10–500 ng mL−1.
These plotted curves were used for the calculation of the vitamin concentrations in the tablets.
Method validation
The validation procedure, one of the most important steps in chromatographic separation, is performed to ensure that the adopted analytical methodology is suitable for the system, is accurate, speci-fic, reproducible, and robust over the specified concentration range, and its performance can be demonstrated in laboratory experiments using samples or standards that are similar to the unknown samples to be analyzed.36
Therefore, this HPLC method, including consideration of the system suitability, was investigated in order to verify its performance under actual working conditions with a well-characterized analyte, column, and mobile phase.
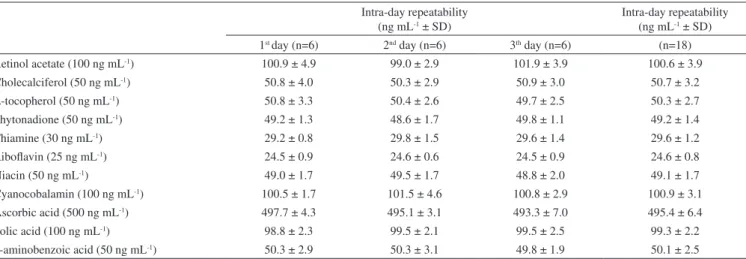
The chromatographic method was carefully evaluated on the basis of its analytical characteristics, the precision in the retention time, and the elution purity with respect to the qualitative analysis. The system suitability was confirmed because the RSD% of three injec-tions for each vitamin was <7% for all of the evaluated parameters (the retention time and the response). The validation of the method was confirmed on the basis of results for its accuracy, precision, linearity, LOD, LOQ, and percentage recovery. All of the validation data calculated for the determination of the fat- and water-soluble vitamins are summarized in Table 5.
Linearity, LOD, and LOQ
Table 5. Validation data for the determination of fat- and water- soluble vitamins (n= 6)
Vitamin tR (min)a Regression equation R2. b LOD (ng mL-1)c LOQ (ng mL-1)d RSD (%)e
Retinol acetate 16.48 y = 153.6x - 4.7516 0.9999 112.1 137.7 5.0
Cholecalciferol 22.55 y = 197.9x - 6.7161 0.9999 59.9 81.9 8.0
α-tocopherol 24.99 y = 303.42x - 0.2704 0.9999 58.2 76.7 6.5
Phytonadione 33.82 y = 471.04x + 4.4078 0.9999 53.6 64.3 2.6
Thiamine 2.47 y = 214.31x - 14.13 0.9992 33.4 42.1 2.9
Riboflavin 3.51 y = 282.51x + 2.9618 0.9999 27.0 32.6 3.8
Niacin 4.99 y = 215.63x - 4.4514 0.9999 54.6 67.0 3.5
Cyanocobalamin 9.77 y = 58.378x - 0.3068 0.9999 112.1 137.7 1.7
Ascorbic acid 10.46 y = 18.163x -0.5823 0.9999 515.6 561.8 0.9
Folic acid 11.11 y = 128.95x - 5.29 0.9999 57.8 75.5 2.3
p-aminobenzoic acid 9.99 y = 474.32x - 10.285 0.9999 105.8 120.9 5.8
a Retention times in min. b Regression coefficients. c Limits of detection (3S/N). d Limits of quantitation (10S/N). e Relative standard deviations.
Table 6. Intra- and inter-day precisions for determination of fat- and water- soluble vitamins by RP-HPLC
Intra-day repeatability (ng mL-1 ± SD)
Intra-day repeatability (ng mL-1 ± SD) 1st day (n=6) 2nd day (n=6) 3th day (n=6) (n=18) Retinol acetate (100 ng mL-1) 100.9 ± 4.9 99.0 ± 2.9 101.9 ± 3.9 100.6 ± 3.9 Cholecalciferol (50 ng mL-1) 50.8 ± 4.0 50.3 ± 2.9 50.9 ± 3.0 50.7 ± 3.2
α-tocopherol (50 ng mL-1) 50.8 ± 3.3 50.4 ± 2.6 49.7 ± 2.5 50.3 ± 2.7 Phytonadione (50 ng mL-1) 49.2 ± 1.3 48.6 ± 1.7 49.8 ± 1.1 49.2 ± 1.4
Thiamine (30 ng mL-1) 29.2 ± 0.8 29.8 ± 1.5 29.6 ± 1.4 29.6 ± 1.2
Riboflavin (25 ng mL-1) 24.5 ± 0.9 24.6 ± 0.6 24.5 ± 0.9 24.6 ± 0.8
Niacin (50 ng mL-1) 49.0 ± 1.7 49.5 ± 1.7 48.8 ± 2.0 49.1 ± 1.7
Cyanocobalamin (100 ng mL-1) 100.5 ± 1.7 101.5 ± 4.6 100.8 ± 2.9 100.9 ± 3.1 Ascorbic acid (500 ng mL-1) 497.7 ± 4.3 495.1 ± 3.1 493.3 ± 7.0 495.4 ± 6.4 Folic acid (100 ng mL-1) 98.8 ± 2.3 99.5 ± 2.1 99.5 ± 2.5 99.3 ± 2.2
p-aminobenzoic acid (50 ng mL-1) 50.3 ± 2.9 50.3 ± 3.1 49.8 ± 1.9 50.1 ± 2.5
consecutive days for a given concentration range prepared from di-fferent stock solutions. For this purpose, a series of vitamin solutions with concentrations ranging from 10–500 ng mL−1 were prepared
by diluting the stock solutions with the mobile phase; each of these standard solutions was injected three times into the analytical column, and the peak areas were calculated. Calibration curves were prepared by plotting the vitamin concentrations (ng mL−1) versus the area of the
peaks obtained for each vitamin. The linearity of the calibration curves was excellent (R2 > 0.999) for the specified concentration range. In
addition, the lowest qualitative and quantitative concentrations (LOD and LOQ) for the tested linearity range were calculated for all of the vitamins. For example, the LOD and LOQ for retinol acetate (vitamin A) were found to be 112.1 and 137.7 ng mL−1, respectively. All of the
calculated LOD and LOQ values are given in Table 5.
Accuracy and precision
The accuracy of the method was carefully evaluated by running six replicate analyses at three different concentration levels (within the working range). The mean measured values obtained from the studies were within ±5% of the actual value, thereby proving the ac-curacy of the method. The intra- and inter-day precision of the method was also evaluated from both peak areas and the calibration slopes at different time intervals and for diffferent operators by calculating the RSD% from measurements taken for six independent solutions on the same and three different days. The observed results for the intra- and inter-day precision for all of the vitamins are listed in Table 6.
Recovery
The accuracy and validity of the proposed method were also ascertained by performing recovery studies. Recovery tests were performed by adding the standards at two levels (low and high) to a multivitamin tablet; the percentage recoveries were determined by comparing the peak areas obtained for the standard to those of the spiked matrix. Each assay was analyzed six times, and the average calculated recoveries fell between 87.4% and 98.5% for the analyzed vitamins. The results of the recovery studies at the low and high concentration levels are shown in Table 7.
CONCLUSION
Table 7. Recovery studies with declared and found concentrations of vitamins in multivitamin tablets
Vitamins
Multivitamin (mg per ½ tablet) Declared
mg L-1
Added amount mg L-1
Founded mg L-1
Mean Recovery (%) ± SD*
LO
W
- CONCENTRA
TION
ADDING
Retinol acetate 0.5 0.3 0.8 91.6 ± 3.8 Cholecalciferol 0.3 0.2 0.4 93.8 ± 2.7
α-tocopherol 0.8 0.2 0.9 92.6 ± 4.0 Thiamine 5.0 0.2 5.1 98.5 ± 2.3 Riboflavin 2.5 0.2 2.5 93.3 ± 3.8
Niacin 8.0 0.2 7.9 96.0± 4.3
Cyanocobalamin 0.8 0.3 0.9 86.7 ± 5.6 Ascorbic acid 15.0 1.5 14.7 88.9 ± 5.7 Folic acid 0.9 0.3 1.1 88.3 ± 4.4
HIGH CONCENTRA
TION
ADDING
Retinol acetate 0.5 0.5 1.0 94.1 ± 2.7 Cholecalciferol 0.3 0.5 0.8 96.1 ± 3.0
α-tocopherol 0.8 0.8 1.4 94.0 ± 3.8 Thiamine 5.0 5.0 9.8 97.7 ± 2.4 Riboflavin 2.5 2.5 4.8 94.6 ± 3.6 Niacin 8.0 5.0 12.6 97.3 ± 3.7 Cyanocobalamin 0.8 0.8 1.4 92.0 ± 5.9 Ascorbic acid 15.0 5.0 17.7 88.6 ± 5.0 Folic acid 0.9 1.0 1.7 87.4 ± 5.1 *Recovery values represent the mean of six replication (n= 6) with standard deviation.
vitamins in various food materials.
ACKNOWLEDGEMENT
This study, as part of an M.Sc. Thesis, was supported by the Selcuk University Coordinators of Scientific Research with project number SU-BAP 09201147. The authors wish to thank the principal coordinator of the Selcuk University and Scientific Research Project.
The authors declare no conflict of interest.
REFERENCES
1. Poongothai, S.; Ilavarasan, R.; Karrunakaran C.M.; Int. J. Pharm. Pharm. Sci. 2010, 2, 133.
2.Andreoli, R.; Manini, P.; Poli, D.; Bergamaschi, E.; Mutti, A.; Niessen, W.A.; Anal. Bioanal. Chem. 2004, 378, 987.
3.Kienen, V.; Costa, W.F.; Visentainer, J.V.; Souza, N.E.; Oliveira, C.C.; Talanta 2008, 75, 14.
4.Chen, Z.; Chen, B.; Yao, S.; Anal. Chim. Acta 2006, 569, 169. 5.Okamoto, H.; Nakajima, T.; Ito, Y.; J. Chromatogr. A 2003, 986, 153. 6.Strohecker, R.; Henning, H.M.; Vitamin Assay Tested Methods,
Weinheim: Verlag Chemie, 1965.
7. United States Pharmacopeia 29 th Revision, US Pharmacopeial Conven-tion, Rockville, Md.1990.
8. Monferrer-Pons, L.; Capella-Peirỏ, M.E.; Gil-Agustĭ, M.; Esteve-Romero, J.; J. Chromatogr. A 2003, 984, 223.
9. Garcìa, L.; Blázquez, S.; San Andrés, M.P.; Vera, S.; Anal. Chim. Acta 2001, 434, 193.
10. Song, Z.; Hou, S.; Anal. Chim. Acta 2003, 488, 71.
11. Delgado-Zamarreno, M.M.; Gonzalez-Maza, I.; Sanchez-Perez, A.; Carabias-Martinez, R.; J. Chromatogr. A 2002, 953, 257.
12. Han, J.Y.; Tyler, R.T.; J. Agric. Food. Chem. 2003,51, 5315. 13. Li, H.B.; Chen, F.; Chromatographia 2001, 54, 270.
14. Agostini-Costa, T.D.; Scherer, R.; Kowalski, C.H.; Prado, M.A.; Godoy, H.T.; Quim. Nova 2008, 31, 546.
15. Gonçalves Rios M.D.; Penteado M.D.C.; Quim. Nova, 2003, 26, 10. 16. Campos, F.M.; Ribeiro, S.M.R.; Della Lucia, .M.; Pinheiro-Sant’Ana,
H.M.; Stringheta, P.C.; Quim. Nova 2009, 32, 87.
17. Vinas, P.; Erroz-Lopez, C.; Balsalobre, N.; Cordoba-Hernandez, M.; J. Chromatogr. A 2003, 1007, 77.
18. Klejdus, B.; Petrlová, J.; Potěšil, D.; Adam, V.; Mikelová, R.; Vacek, J.; Kizek, R.; Kubáň, V.; Anal. Chim. Acta 2004, 520, 57.
19. Ivanovic, D.; Popovic, A.; Radulovic, D.; Medenica, M.; J. Pharm. Biomed. Anal. 1999, 18, 999.
20. Heudi, O.; Kilinc, T.; Fontannaz, P.; J. Chromatogr. A 2005, 1070, 49. 21. Hermans, N.; Cos, P.; Berghe, D.V.; Vlietinck, A.J.; Bruyne, T.; J.
Chro-matogr. B 2005,822, 33.
22. Li, K.; Biomed. Chromatogr. 2002, 6, 504.
23. Yin, C.; Cao, Y.; Ding, S.; Wang, Y.; J. Chromatogr. A 2008, 1193, 172. 24. Moreno, P.; Salvadό, V.; J. Chromatogr. A 2000, 870, 207.
25. Ravansiddappa, H.D.; Manju, B.; J. Pharm. Biomed. Anal. 2001,25, 631.
26. Vinas, P.; Erroz-Lopez, C.; Balsalobre, N.; Cordoba-Hernandez, M.; J. Chromatogr. A 2003, 1007, 77.
27. Markopoulou, C.K.; Kagkadis, K.A.; Koundourellis, J.E.; J. Pharm. Biomed. Anal. 2002, 30, 1403.
28. Burri, J.B.; Nelson-Dopler, M.; Neidllinger, T.R.; J. Chromatogr. A 2003, 987, 359.
29. Holler, U.; Brodhag, C.; Knobel, A.; Hofmann, P.; Spitzer, V.; J. Pharm. Biomed. Anal. 2003, 31, 151.
30. Jedlička, A.; Klimeš, J.; Chem. Pap. 2005, 59, 202. 31. Wongyai, S.; J. Chromatogr. A 2000, 870, 217.
32. Amiszic, R.; Brboric, J.; Cudina, O.; Vladimirov, S.; J. Serb. Chem. Soc. 2005, 70, 1229.
33. Kłaczkow, G.; Anuszewska, E.L.; Acta Pol. Pharm. 2000, 57, 167. 34. Jonathan, W.D.; Karlene, R.S.; J. AOAC Int. 2002,85, 424.
35. Lee, H.M.; Kwak, B.M.; Ahn, J.H.; Jeong, S.H.; Shim, S.L.; Kim, K.S.; Yoon, T.; Leem, D.G.; Jeong, J.; Korean J. Food Sci. Ani. Resour. 2011, 31, 191.