Nota Técnica
*e-mail: [email protected]
DEVELOPMENT AND VALIDATION OF A NOVEL STABILITY INDICATING RP-UPLC METHOD FOR SIMULTANEOUS DETERMINATION OF NIZATIDINE, METHYLPARABEN AND PROPYLPARABEN IN ORAL LIQUID PHARMACEUTICAL FORMULATION
Navneet Kumar*, Bhupendrasinh Vaghela and P. Sunil Reddy
Dr. Reddy’s Laboratories Ltd., IPDO, Bachupally, Hyderabad-500072, A.P, India
D. Sangeetha
Department of Chemistry, S.A.S., V.I.T. University, Vellore - 632014, Tamilnadu, India
Recebido em 24/8/11; aceito em 12/10/11; publicado na web em 4/1/12
A selective and accurate stability-indicating gradient reverse phase ultra performance liquid chromatographic method has been developed and validated for the simultaneous determination of nizatidine, methylparaben and propylparaben in pharmaceutical oral liquid formulation. The separation was achieved on Acquity UPLCTM HSS T3 1.8 µm column by using mobile phase containing a gradient mixture of solvent A (0.02 Mol L-1 KH
2PO4, pH 7.5) and B (60:40 v/v mixture of methanol and acetonitrile) at flow rate of 0.4 mL min-1. Drug product was exposed to the stress conditions of oxidative, acid, base, hydrolytic, thermal and photolytic degradation. The developed method was validated as per international ICH guidelines with respect to specificity, linearity, accuracy, precision and robustness.
Keywords:nizatidine; stability-indicating; UPLC-UV.
INTRODUCTION
Nizatidine is a histamine H2-receptor anatagonist commonly used in the treatment of gastroesophageal reflux disease, duodenal and gas-tric ulceration. Its chemical designation is N-[2-[[[2-[(dimethylamino) methyl]-4-thiazoyl] thio]-N’-methyl-2-nitro-1,1-ethenediamine (Figure 1a).1 Nizatidine can be found in many pharmaceutical forms such as tablets, capsules, injections and oral liquids. Compared to tablet and capsule, liquid formulations favour a most rapid absorption of active substance. Liquid preparations are particularly suceptible to mocrobial growth because of the nature of their ingradtient. Such preparations require the presence of preservatives and antimicro-bial agents, to prevent chemical alteration and degradation of drug substance.
Paraben, a group of alkyl esters of p-hydroxybenzoic acid are widely used as antimicrobial preservatives in cosmetics, food and pharmaceutical products.2 The parabens are effective over a wide pH range and present a brod sprectrum of antimicobial activity, although they are most effective against yeast and molds. Methylparaben and
propylparaben have been used for the preservation of nizatidine oral solution (Figure 1b-c). The analysis of these preservatives in commer-cial pharmaceutical product is particularly important for both, quality assurance and consumer protection. Indian drugs and cosmetics act3 and International Conference on Harmonization (ICH)4 guidance recommends that release and stability testing for preservative con-tent should be performed and finished product self-life specification should also include identification test, preservative content and limits for antimicrobial preservative present. Therefore, the analysis of nizatidine into oral solution in combination with preservative is required and essential. Some liquid chromatography (LC) methods are available for the determination of nizatidine in biological fluids.5-8 Literature reported the HPLC analysis for famotidine, ranitidine, cimetidine and nizatidine in drug products and stability indicating LC method for nizatidine and its impurities.9,10 Nizatidine monograph is also listed in United States Pharmacopoiea (USP)11 and European Pharmacopoeia (Eur. Ph.).12 USP monograph describes a chromato-graphic assay method for nizatidine with a runtime of 40 min and Ph.Eur. describes assay method for nizatidine with a runtime of 25 min. No pharmacopoeial monograph is available for nizatidine oral solution. Several analytical procedures have been reported for the determination of methylparaben and propylparaben seperately or in combination with the other drugs by LC and other techniques.13-17 These methods may not be suitable for simultaneous determination of nizatidine, methylparaben and propylparaben together in one chromatographic run.
To the best of our knowledge, there is no stability indicating LC method reported for the estimation of nizatidine, methylparaben and propylparaben in oral liquid formulation. Therefore, attempts were made in this study to develop a fast, sensitive, selective, robust and stability indicating reverse phase ultra-performance liquid chromato-graphy (UPLC) method for the simultaneous determination of nizati-dine, methylpraben and propylparaben in oral liquid formulation. The developed LC method was validated with respect to specificity, line-arity, precision, accuracy and robustness. Force degradation studies were performed on the placebo and drug products. Developed method separates all degradation products from nizatidine, methylparaben and
Figure 1. Structures of (a) nizatidine, (b) methylparaben and (c)
propylpa-raben
N S N
S
N H
N+
O HN
O–
HO
O O
HO
O O (a)
propylparaben, and exhibits stability indicating nature. These studies were performed in accordance with established ICH guidelines.18,19 Developed method can be used for routine analysis of production samples and stability testing of the nizatidine oral solution to ensure the quality of the product.
EXPERIMENTAL
Reagents and chemicals
Nizatidine standard (99.6% pure) and oral solution was supplied by Dr. Reddy’s laboratories limited, Hyderabad, India. Methylparaben (99.9% pure) and propylparaben (100% pure) were procured from United State Pharmacopoeia (USP). The high performance liquid chromatography (HPLC) grade acetonitrile and methanol; and analytical grade potassium di-hydrogen ortho-phosphate and sodium hydroxide were purchased from Merck, Mumbai, India. High purity water was prepared by using Millipore Milli-Q Plus water purification system (Millipore, Milford, MA, USA).
Instrumentation and chromatographic conditions
The chromatography analysis was performed using Waters AcquityTM UPLC separation module (Waters Corporation, Milford, USA) equipped with photo diode array (PDA) detector, binary solvent manager and auto sampler system. The output signal was monitored and processed using Empower 2 software. The separa-tion was achieved on Acquity UPLCTM HSS T3 (100 x 2.1 mm) 1.8 µm column (Waters Corporation, Milford, USA) with mobile phase containing a gradient mixture of solvent A (0.02 Mol L-1 potassium dihydrogen ortho-phosphate, pH adjusted to 7.5 with sodium hydroxide solution) and B (60:40 v/v mixture of methanol and acetonitrile) at flow rate of 0.4 mL min-1. The gradient program (Time (min)/%B) was set 0/20, 1/25, 5/37, 7/55, 8/65, 8.5/65, 8.6/20 and 10/20. The column oven temperature was maintained at 35 °C and eluted compounds were monitored at the wavelength of 254 nm. The sample injection volume was 4 µL. Cintex digital water bath was used for hydrolysis studies. Photo-stability studies were carried out in photo-stability chamber (Sanyo, Leicestershire, UK). Thermal stability studies were performed in a dry air oven (Cintex, Mumbai, India). The pH of the solutions was measured by a pH meter (Mettler-Toledo, Switzerland).
Preparation of standard solution
Solvent A and methanol in the ratio of 80:20 v/v was used as diluent. A stock solution of nizatidine (0.6 mg mL-1) was prepared by dissolving an appropriate drug in diluent. The stock solutions of methylparaben (0.72 mg mL-1) and propylparaben (0.2 mg mL-1) were prepared in methanol, separately. A mixed stock solution con-taining 72 µg mL-1 methylparaben and 8 µg mL-1 of propylparaben was prepared from their respective stock solutions. Working standard solution was prepared in diluent from mixing above stock solutions of nizatidine, methylparaben and propylparaben with final concentration of 120, 14.4 and 1.6 µg mL-1, respectively.
Calibration curves were prepared by diluting stock solutions of nizatidine, methylparaben and propylparaben with diluent to get a series of solutions containing final concentrations of 0.34, 11.9, 59.6, 89.5, 119.3, 137.2 and 178.9 µg mL-1 for nizatidine; and 0.11, 1.45, 7.26, 10.9, 14.5, 16.7 and 21.8 µg mL-1 for methylparaben; and 0.07, 0.16, 0.82, 1.22, 1.63, 1.88 and 2.45 µg mL-1 for propylparaben. A graph was plotted as concentration of analyte versus peak area res-ponse and found to be linear for all three analytes.
Preparation of sample solution
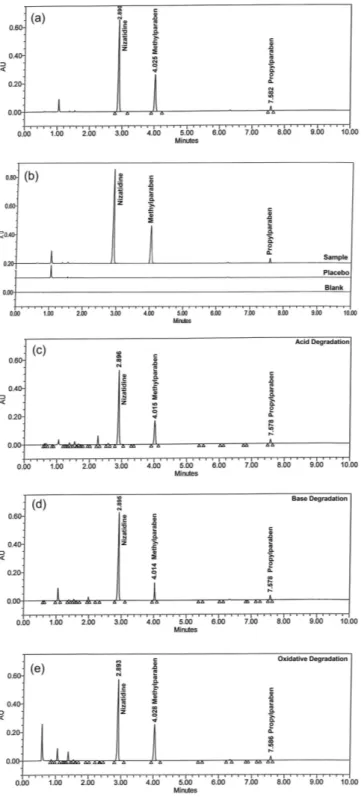
An amount (about 2 g) of oral solution equivalent to 30 mg ni-zatidine was transferred into 50 mL volumetric flask, added 35 mL of diluent and ultrasonicated for 10 min, and then diluted to volume with diluent. 5 mL of this solution was diluted to 25 mL with diluent, to give a solution containing 120 µg mL-1 of nizatidine, 14.4 µg mL-1 of methylparaben and 1.6 µg mL-1 of propylparaben (Figure 2a).
RESULTS AND DISCUSSION
Method development and optimization
The main objective of the chromatographic method was to sepa-rate and quantitate niziatidine, methylparaben and propylparaben in presence other placebo components like flavor agents and colors. An isocratic method employed using 0.02 Mol L-1 potassium dihydrogen ortho-phosphate (pH 3.0) and acetonitrile in the ratio of 70:30 as mobile phase, Acquity UPLC® BEH Shield (150 x 2.1 mm) 1.7 µm column with flow rate of 0.4 mL min-1 on UPLC equipped with photo diode array detector. Nizatidine peak was eluted too early along with place-bo peaks and propylparaben retained strongly. To retain and separate nizatidine from placebo peaks and reduce the run time an attempt was made with gradient elution with mobile phase 0.02 Mol L-1 potassium dihydrogen ortho-phosphate buffer (pH 3.5) as solvent-A and solvent-B (mixture of acetonitrile and water in the ratio of 80:20 v/v). Nizatidine was retained but many placebo peaks co-eluted with nizatidine. To resolve the nizatidine from placebo, solvent A modified to 0.15 Mol L-1 ammonium formate having pH 5.5 and Acquity UPLCTM HSS T3 (100 x 2.1 mm) 1.8 µm selected for separation. But satisfactory resolution was not achieved between nizatidine and placebo peaks. To achieve good separation, solvent A modified to 0.02 Mol L-1 potassium dihydrogen ortho-phosphate buffer (pH 7.5) and solvent B modified to a mixture of methanol and acetonitrile in the ratio of 60:40 (v/v), respectively. On the optimization of gradient program, nizatidine, methylparaben and propylparaben peaks ware well resolved form each other and placebo peaks with a shorter run time. Based on these experiments, the final optimized conditions are described below.
Acquity UPLCTM HSS T3 (100 x 2.1 mm) 1.8 µm was used as the stationary phase. The mobile phase A consist of 0.02 Mol L-1 potas-sium dihydrogen ortho-phosphate having pH 7.5 and mobile phase B contained a mixture of methanol and acetonitrile in the ratio of 60:40 (v/v). The flow rate was 0.4 mL min-1 with a gradient program of (time (min)/ %B) 0/20, 1/25, 5/37, 7/55, 8/65, 8.5/65, 8.6/20 and 10/20. The column temperature was maintained at 35°C and detec-tion was monitored at 254 nm. The injecdetec-tion volume was 4 µL. The typical relative retention time of methylparaben and propylparaben with respect to nizatidine were 1.38 and 2.58, respectively.
Validation of the method
The proposed method was validated by determining its perfor-mance characteristics regarding specificity, accuracy, precision, limit of detection and quantification, linearity, range and robustness.18,19
System suitability
deviation (RSD) for peak areas, USP tailing factor less than 2.0 for nizatidine, methylparaben and propylparaben peaks from standard solution. All critical parameters tested met the acceptance criteria (Table 1).
Specificity/stress studies
Specificity is the ability of the method to measure the analyte res-ponse in the presence of its potential degradants and placebo matrix. In the present study, injections of blank and placebo were performed to demonstrate the interference with the elution of nizatidine, methyl-paraben and propylmethyl-paraben. These results demonstrate that there was no interference from the other compounds and, therefore, confirms the specificity of the method (Figure 2b).
Force degradation studies of drug product were also perfor-med to evaluate the stability-indicating property and specificity of proposed method. The solutions of drug product and placebo were exposed to acid hydrolysis (1 Mol L-1 HCl at 60 °C for 2 h), base hydrolysis (1 Mol L-1 NaOH at 60 °C for 15 min), oxidation (3% H2O2 at room temperature for 5 min), hydrolytic (water at 60 °C for 24 h), thermal (105 °C for 2 h) and photolytic degradation (drug product exposed to visible light for 240 h resulting an overall illustration 1.2 million lux hours and UV light for 250 h resulting an overall illustration 200 w h/m2 at 25 °C). Significant degradation observed during acid, base hydrolysis and oxidative degradation (Figure 2c-e). Peak purity test was carried out for the nizatidine, methylparaben and propylparaben peaks by using PDA detector in stress samples. The purity of all three substances was unaffected by the presence of degradation products, and, thus confirms the stability-indicating power of the developed method. A summary data of stress study is shown in Table 2.
Limits of detection (LOD) and quantification (LOQ)
The LOD and LOQ were determined at a signal-to-noise ratio of 3:1 and 10:1, respectively, by injecting a series of dilute solutions with known concentrations. The limit of detection and limit of quan-tification values are reported in Table 3.
Linearity
Linearity test solutions were prepared by diluting the stock solutions to the required concentrations. The solutions were pre-pared at seven concentration levels from LOQ to 150% levels of test concentration (LOQ- 180 µg mL-1 for nizatidine, LOQ- 21.6 µg mL-1 for methylparaben and LOQ- 2.4 µg mL-1 for propylparaben). Calibration curves were plotted between the responses of peak versus analyte concentrations. The coefficient correlation, slope, y-intercept of the calibration curve and % bias at 100% response are reported (Table 3) and result shows that an excellent correlation existed between peak area and concentration of nizatidine, methylparaben and propylparaben.
Precision
The precision of method was verified by repeatability and
Figure 2.Typical chromatograms of (a) sample preparation, (b) overlay
chro-matograms of blank, placebo and sample (c) acid degradation sample treated with 1 Mol L-1 HCl at 60 °C for 2 h, (d) base degradation sample treated 1 Mol L-1 NaOH at 60 °C for 15 min and (e) oxidative degradation sample treated with 3% H2O2 at room temp for 5 min. Chromatographic conditions: Acquity UPLCTM HSS T3 (100 x 2.1 mm) 1.8 µm column at 35 °C; mobile phase A: 0.02 Mol L-1 KH
2PO4, pH 7.5 and mobile phase B: methanol and acetonitrile (60:40; v/v); 0.4 mL min-1 of flow rate; gradient program: (time (min)/ %B) 0/20, 1/25, 5/37, 7/55, 8/65, 8.5/65, 8.6/20 and 10/20; wavelength of 254 nm
Table 1. System suitability results of precision and intermediate precision
study
Compound
Precision Intermediate Precision USP Tailing
≤ 2.0
%RSD a
≤ 2.0
USP Tailing
≤ 2.0
% RSD a
≤ 2.0
Nizatidine 1.0 0.1 1.0 0.4
Methylparaben 1.0 0.1 1.0 0.4
Propylparaben 1.0 0.3 1.0 0.5
intermediate precision. Repeatability was checked by injecting six individual preparations of nizatidine oral solution containing nizatidine, methylparaben and propylparaben at 10, 100 and 125% level of test concentration (11.9, 119.3, 149.1 µg mL-1 for nizatidine, 1.45, 14.5, 18.1 µg mL-1 for methylparaben, 0.16, 1.6, 2.0 µg mL-1 for propylparaben). The intermediate precision of the method was also evaluated using different analyst and different instrument and perfor-ming the analysis on different days. The relative standard deviation of the areas of each peak was calculated and found to less than 0.9% in repeatability and less than 0.7 % in intermediate precision, which confirms the good precision of the method. The %RSD values are presented in Table 4.
Accuracy
Accuracy of the method for nizatidine, methylparaben and pro-pylparaben was evaluated in triplicate at 10, 50, 100 and 125% level of test concentration (11.9, 59.7, 119.3, 149.1 µg mL-1 for nizatidine, 1.45, 7.25, 14.5, 18.1 µg mL-1 for methylparaben, 0.16, 0.8, 1.6, 2.0 µg mL-1 for propylparaben). The percentage recoveries for all three components were calculated (Table 5). The percentage mean recovery
of nizatidine, methylparaben and propylparaben from the formulation varied from 98.8 to 101.2% indicating that the developed method was accurate for the determination of nizatidine, methylparaben and propylparaben in pharmaceutical formulation.
Robustness
The robustness of the method was evaluated during development by making small, but deliberate, changes to the method parameters. An experiment design was used to determine how changes in colu-mn temperature, flow rate and mobile phase composition affect the chromatography of nizatidine, methylparaben and propylparaben. As shown in Table 6, four factors were evaluated at two levels each. A solution containing 120, 14.4 and 1.6 µg mL-1 of nizatidine, methyl-paraben and propylmethyl-paraben, respectively, was assayed according to the experimental conditions listed in Table-5. All of the experimental conditions yielded acceptable results (Table 7).
Stability of analytical solution
The solution stability of nizatidine, methylparaben and propyl-paraben in the assay method was investigated by leaving sample test solutions in tightly capped volumetric flask at room temperature for 24 h. The same sample solutions were analysed at the end of the study period against freshly prepared standard solutions. The variability in
Table 2. Summary of forced degradation results
Stress Condition Nizatidine Methylparaben Propylparaben % Degradation
Purity angle Purity threshold Purity angle Purity threshold Purity angle Purity threshold Acid hydrolysis (1 Mol L-1 HCl at
60 °C, 2 h)
0.054 0.297 0.074 0.302 0.480 0.774 5.6
Base hydrolysis (1 Mol L-1 NaOH at 60 °C, 15 min)
0.075 0.344 0.058 0.288 0.453 0.819 4.3
Oxidation (3% H2O2 at room temp, 5 min)
0.058 0.315 0.057 0.296 0.479 0.851 3.2
Thermal (At 105 °C, 3 h) 0.075 0.337 0.065 0.295 0.432 0.792 2.5
Hydrolytic (Water at 60 °C, 24 h) 0.082 0.362 0.054 0.283 0.420 0.759 1.9 Photolytic (1.2 million lux h visible
light and 200 wh/m2 UV light)
0.078 0.366 0.065 0.284 0.405 0.718 2.0
Table 3. Evaluation of LOD, LOQ and linearity data
Parameter Nizatidine Methylparaben Propylparaben
LOD (µg/mL) 0.114 0.037 0.023
LOQ (µg/mL) 0.341 0.110 0.068
Correlation coefficient 0.999 0.999 0.999 Intercept (a) -2690.50 -1833.67 -1646.63 Slope (b) 13230.42 46662.43 38332.67 Bias at 100% response 0.0 0.0 -0.3
Table 4. Precision results determined during method validation
Parameter Amount spiked a
% RSD (n=6)
Nizatidine Methylparaben Propylparaben
Repeatability 10% 0.3 0.3 0.9
100% 0.1 0.1 0.7
125% 0.2 0.2 0.5
Intermediate Precision
10% 0.3 0.2 0.7
100% 0.1 0.1 0.2
125% 0.1 0.1 0.5
a Amount of all three analyte spiked with respect to target concentration.
Table 5. Recovery results determined during method validation
Amount spiked a
% Recovery b
Nizatidine Methylparaben Propylparaben 10% 99.1 ± 0.2 101.2 ± 0.1 99.5 ± 0.8 50% 98.9 ± 0.1 99.2 ± 0.1 100.1 ± 0.2 100% 99.7 ± 0.2 100.2 ± 0.2 99.1 ± 0.9 125% 100.4 ± 0.1 99.7 ± 0.2 98.8 ± 0.3 a Amount of all three analyte spiked with respect to target concentration. b Mean ± %RSD for three determinations
Table 6. Conditions for the robustness study
Factor Level
Low (-) Nominal High (+)
pH 7.3 7.5 7.7
MeOH (%) 57.5 60 62.3
Table 7. Robustness results of UPLC method Expt.
No. ABCD
a Nizatidine Methylparaben Propylparaben
tR
b Ac Td Ke t
R A T K tR A T K
1 Nominal 2.89 0.1 1.0 1.89 4.02 0.1 1.0 3.02 7.58 0.3 1.0 6.58
2 + + + + 2.71 0.1 1.1 1.72 3.24 0.2 1.1 2.26 6.99 1.3 1.0 6.01
3 - + - + 3.28 0.1 1.0 2.28 4.49 0.0 1.0 3.48 7.90 0.2 1.0 6.90
4 - - + - 3.08 0.4 1.0 2.05 4.75 0.5 1.0 3.72 7.93 0.8 1.0 6.93
5 - + + - 3.31 0.5 1.1 2.29 4.98 0.6 1.0 3.94 8.06 1.1 1.0 7.04
6 - + + + 2.99 0.1 1.1 2.00 4.20 0.1 1.1 3.21 7.66 0.2 1.1 6.67
7 - + - - 3.55 0.1 1.0 2.51 5.35 0.0 1.0 4.27 8.31 0.8 1.0 7.29
8 + + - - 4.40 1.6 0.9 3.11 5.82 1.5 0.9 4.51 8.50 1.3 0.9 7.40
9 - - - + 4.52 0.5 0.9 3.47 6.16 0.9 0.9 5.11 8.59 1.3 0.9 7.59
10 + - + + 2.69 0.1 1.0 1.69 3.30 0.1 1.0 2.30 7.01 0.3 1.0 6.01
11 + + - + 3.26 0.0 0.9 2.26 3.96 0.1 1.0 2.96 7.54 0.4 1.0 6.57
12 + - - + 3.11 0.1 0.9 2.11 3.84 0.1 1.0 2.84 7.47 0.5 1.0 6.48
13 + - - - 3.19 0.1 1.0 2.19 4.33 0.7 1.1 3.30 7.79 1.5 1.0 6.78
14 + + + - 2.90 0.1 1.1 1.91 3.83 0.1 1.4 2.82 7.42 0.3 1.3 6.42
15 - - + + 2.63 0.1 1.4 1.63 3.64 0.1 1.5 2.65 7.27 0.5 1.5 6.28
16 + - + - 3.42 0.2 1.3 2.40 5.06 0.1 1.4 4.00 8.11 0.8 1.3 7.09
17 - - - - 4.63 0.1 1.5 3.56 6.25 0.3 1.4 5.18 8.64 0.6 1.4 7.62
a A, pH; B, MeOH (%); C, Flow rate (mL min-1); D, Column Temperature (°C). bRetention time (min) of the analyte peak. c% RSD of the analyte peak areas from 5 injections. dTailing factor of the analyte peak. eCapacity factor of the analyte peak
the assay of all three substances was within + 3% during solution stability. The results from solution stability experiments confirmed that sample solution and standard solutions were stable up to 24 h.
CONCLUSIONS
A simple and efficient reverse-phase UPLC method was deve-loped and validated for quantitative analysis of nizatidine, methyl-paraben and propylmethyl-paraben in pharmaceutical dosage forms. The method found to be precise, accurate, linear, robust and rugged during validation. Satisfactory results were obtained from the validation of the method. The method is stability indicating and can be used for routine analysis of production samples and to check the stability of the nizatidine oral solution.
ACKNOWLEDGEMENT
The authors are thankful to the management of Dr. Reddy’s Laboratories Ltd., Hyderabad for providing facilities to carry out this work.
REFERENCES
1. http://www.rxlist.com/axid_oral_solution-drug.htm, accessed July 2011. 2. Rieger, M. M.; Handbook of pharmaceutical excipients, 2nd ed., The
pharmaceutical press: London, 1994.
3. Department of Health, Government of India; Appendix IX, Stability testing of new drugs, Drug and cosmetics act and rules, 1940, p. 540. 4. ICH Q6A; Specifications: Test procedures and acceptance criteria for
new drug substances and new drug products: Chemical substances, International Conference on Harmonization, 1999.
5. Yusuf, A.; Al Dgither, S.; Hammami, M. M.; Ther. Drug Monti.2006,
28, 232.
6. Tracqui, A.; Kintz, P.; Mangin, P.; J. Chromatogr. Biomed. Appl. 1990,
529, 369.
7. Imre, S.; Vlase, L.; Leucuta. S. E.; Rev. Roum. Chim.2007, 52, 261. 8. Ashiru, D. A. I.; Patel, R.; Basit, A. W.; J. Chromatogr., B: Anal Technol.
Biomed. Life Sci.2007, 860, 235.
9. Ho, C.; Huang, H. M.; Hus, S. Y.; Shaw, C. Y.; Chang, B. L.; Drug Dev. Ind. Pharm.1999, 25, 379.
10. Gomes, A. R.; Raghuram, P.; Sriramulu, J.; Srinivas, N.; Am. J. Anal. Chem.2011, 2, 314.
11. The United States Pharmacopoeia, 34th ed., The United States Pharmacopoeial Convention: Rockville, 2011.
12. European Pharmacopoeia 4.2, Council of Europe, 2002.
13. Hajkova, R.; Solich, P.; Dvoiak, J.; J. Pharm. Biomed. Anal.2003, 32, 921.
14. Seong, K.; Hasuck, K.; J. Pharm. Biomed. Anal. 1997, 15, 1359. 15. Diane, K.; Bela, K.; J. Chromatogr., B: Anal. Technol. Biomed. Life Sci.
1998, 707, 181.
16. Mangus, A.; Atemnkeng, E. M.; Jacqueline, P.; J. Pharm. Biomed. Anal.
2007, 43, 727.
17. Petruci, J. F. S.; Cardoso, A. A.; Pereira, E. A.; Quim. Nova2011, 34, 1177.
18. ICH Q2 (R1); Validation of Analytical Procedures: Text and Methodology, International Conference on Harmonization, 2005. 19. ICH Q1A (R2); Stability Testing of new Drug Substances and Products,