Multivariate analysis for the classification and differentiation
of Madeira wines according to main grape varieties
Jos´e S. Cˆamara
a,∗, M. Arminda Alves
b, Jos´e C. Marques
aaCentro de Qu´ımica da Madeira, Depto. de Qu´ımica da Universidade da Madeira, Campus Universit´ario da Penteada, 9000-390 Funchal, Portugal bDepto. de Enga Qu´ımica, Faculdade de Engenharia da Universidade do Porto, Rua Roberto Frias, 4099 Porto, Portugal
Received 9 March 2005; received in revised form 2 July 2005; accepted 4 August 2005 Available online 9 September 2005
Abstract
In order to differentiate and characterize Madeira wines according to main grape varieties, the volatile composition (higher alcohols,fatty acids,ethyl estersandcarbonyl compounds) was determined for 36 monovarietal Madeira wine samples elaborated fromBoal,Malvazia,
SercialandVerdelhowhite grape varieties. The study was carried out by headspace solid-phase microextraction technique (HS-SPME), in dynamic mode, coupled with gas chromatography–mass spectrometry (GC–MS). Corrected peak area data for 42 analytes from the above mentioned chemical groups was used for statistical purposes. Principal component analysis (PCA) was applied in order to determine the main sources of variability present in the data sets and to establish the relation between samples (objects) and volatile compounds (variables). The data obtained by GC–MS shows that the most important contributions to the differentiation ofBoalwines are benzyl alcohol and (E )-hex-3-en-1-ol. Ethyl octadecanoate, (Z)-hex-3-en-1-ol and benzoic acid are the major contributions inMalvaziawines and 2-methylpropan-1-ol is associated toSercialwines.Verdelhowines are most correlated with 5-(ethoxymethyl)-furfural, nonanone andcis-9-ethyldecenoate. A 96.4% of prediction ability was obtained by the application of stepwise linear discriminant analysis (SLDA) using the 19 variables that maximise the variance of the initial data set.
© 2005 Elsevier B.V. All rights reserved.
Keywords: Wine; Volatile compounds; HS-SPME/GC–MS analysis; PCA; SLDA
1. Introduction
Madeira wines are characterized by a typical vinification and ageing procedures, including fortification in order to obtain an ethanol content of about 18% (v/v), followed by a baking process known as “estufagem” during which the wine is submitted to rather high temperatures (45–50◦C) for about three months. The four basic types of Madeira wines are named according the main grape varieties from which they are prepared.Malvaziais fortified in an early stage of fermentation in order to produce a distinctive sweet wine with a sugar content of approximately 110 g l−1.Boalis fortified in order to obtain a medium sweet wine (90 g l−1) and the
Verdelhoferments still further to produce a medium dry wine
∗Corresponding author. Tel.: +351 291705112; fax: +351 291705149. E-mail address:[email protected] (J.S. Cˆamara).
(65 g l−1of sugar).Sercialis allowed to complete fermenta-tion and originates dry wines with less than 25 g l−1of sugar content. The baking process plays an important role in the definition of thebouquet, as the temperature can change the chemical profile and, consequently, the organoleptic charac-ter of the wines, by the increase of the kinetics of chemical and enzymatic reactions occurring during wine conservation, such as it happens with other foods and beverages[1–5]. In addition, it must be noted that old Madeira wines are main-tained for long periods of aging, frequently more than 20 years, in cellars which temperatures as high as 30–35◦C and humidity levels of 70–75%. The quality and value of the wine is closely related with the characteristic aroma developed dur-ing this long maturation period.
The aroma is one of the most important factors in the deter-mination of wine character and quality. The volatile fraction of a wine can be composed by over 800 different compounds
[6,7]but only some tens are odour-active[8,9]and must be considered for differentiation purposes. These compounds belong to very heterogeneous groups such asmonoterpenes,
higher alcohols,aldehydes, ketones, ethyl esters andfatty
acids. Some of these compounds come from the grapes and
are typical of the variety, but most of them are formed dur-ing fermentation process and wine agedur-ing. This great variety of volatile compounds, with different polarities, volatilities and a wide range of concentrations, is responsible for the complexity of winebouquetand ensures the specificity and character.
The wine aroma composition is influenced by many fac-tors such as grape variety, edafoclimatic conditions and wine-making process but also depends on yeast strain used, pH of the medium, content and type of nitrogen available, sugars, fermentation temperature and aeration. Each one of these parameters has a significant influence on the quality of the wine and affects the characterisation and differentiation of different wines.
Wine production is actually spread all over the world and brand names and processes are sometimes subject of adul-teration or reproduction, increasing the demand for quality studies and authenticity investigation[10]. Identification of wine aroma components and the relationships between their relative content may be a useful tool in differentiating the wines from different varieties and establishing criteria of gen-uineness to improve the quality of the wines, prevent fraud and guarantee their origin. In general, analysis of volatile compounds can be used to characterise different varieties such as the contribution of ethyl esters of fatty acids and acetates of higher alcohols, from neutral grape varieties[11]. Moreover, volatile wine compounds can be used to differen-tiate wines with different geographic origins[12]. Kwan and Kowalski[13]performed a good differentiation of samples from French and AmericanPinot Noiron the basis of hexan-1-ol and cyclo-hexane. Garc´ıa-Jares et al.[14]differentiate white wines from Rias Baixas (Spain) using 19 volatile com-pounds. Sugars, organic acids and amino acids were used by Arminda Alves[15]in the differentiation of Porto wines and Guedes de Pinho used the multivariate technique for charac-terisation and differentiation varieties from different regions
[16]). Trace elements were used by Day et al.[17]for the identification of the geographical origin of wines using step-wise discriminant analysis. Despite the work carried out on this area, the performance achieved is always dependent on the data set available as some components are present in high concentration (hundreds of mg l−1) and can be easily anal-ysed by GC but the majority is found at the low ng l−1level and need to be extracted and concentrated before analysis. In addition, major compounds from the complex wine matrix can cause interference increasing the difficulty of analysis of trace compounds.
Several classical analytical methods such as liquid–liquid extraction[18,19], simultaneous distillation–solvent extrac-tion[20], solid-phase extraction[21,22], supercritical fluid extraction[23], microwave extraction [24] and ultrasound
extraction[25], have been developed for the analysis of the minor volatile compounds in wines. These classical analyti-cal methods have some drawbacks such as the relatively low reproducibility, possibility of solvent cross-contamination, insufficient selectivity and time consuming procedures. At the beginning of the 1990s a new technique, solid-phase micro-extraction (SPME), was proposed by Pawliszyn and coworkers[26,27]offering two main advantages: no extrac-tion solvent required and combinaextrac-tion of extracextrac-tion and pre-concentration in a single step without pre-treatment of samples. Moreover, the procedure showed to be fast, inex-pensive, requiring low sample volumes and good automation. This technique has been successfully used in wine samples
[28–31]to characterise a wide range of aroma compounds, including monoterpenes and C13norisoprenoids[32], esters [33]and sulphides[34].
Grape variety, vintage year and winery procedures are the three main sources of variation in the chemical com-position of wine. Although the main purpose of this study was to determine which components could differentiate Madeira wines according variety, an attempt was made to determine whether the variables selected for this purpose could also reveal other sources of differentiation such as the harvesting year. To achieve this objective, the content of higher alcohols, acetates, fatty acids, ethyl esters and
carbonyl compounds of 36 monovarietal Madeira wines
samples produced from the four white grape varietiesBoal,
Malvazia,SercialandVerdelho, was determined over three consecutive harvests (1998–2000). Multivariate techniques of data analysis – principal component analysis (PCA) and stepwise linear discriminant analysis (SLDA) – were employed in order to establish differentiation criteria as a function of the varieties used in the preparation of these wines.
The analytes were extracted by HS-SPME using a poly-acrylate fibre (PA-85m) and analysed by GC–MS. The influence of climatic conditions and winemaking techniques on the differentiation of wine varieties was not considered in the study as grapes had been harvested in the same site and the same technology was applied for all wines.
2. Materials and methods
2.1. Sample wines
Grapes ofVitis viniferacultivarsBoal,Malvazia,Sercial
and Verdelho, supplied for theInstituto do Vinho Madeira
(IVM), collected at the final stage of ripening were used. Production techniques were similar to all wines studied, with the exception of the fermentation period before fortification. The musts were treated with SO2(50 mg l−1) and
and storage at−28◦C until use. The HS-SPME extraction was always carried out in triplicate.
2.2. Sample extraction conditions
Volatile wine compounds were extracted by headspace solid-phase micro-extraction (HS-SPME) after optimisation of the major parameters with influence in the extraction pro-cess[32,35]: fibre type, time and temperature of adsorption, ionic strength and pH. Optimal conditions of extraction were obtained using the following procedure: 2.4 ml of wine were transferred to a 4 ml vial (headspace volume was 1.6 ml, according to the phase ratio 1/β= 0.6)[36], the ionic strength was adjusted to 30% with NaCl and the pH was maintained at 3.3–3.5 (pH of the wine). The samples (50 ml) were spiked with 0.422g l−1 of octan-3-ol (Sigma–Aldrich) as inter-nal standard, by addition of 50l of alcoholic solution at 422 mg l−1. The vial was sealed and headspace extraction was performed for 120 min at 40◦C with a 85m PA fibre, keeping the sample under continuous stirring (1200 rpm). The fibre was maintained in the GC injector for 5 min for complete desorption.
2.3. GC–MS conditions
The wine extracts were analysed by gas chromatography coupled with mass spectrometry (GC–MS) using a Varian STAR 3400Cx series II gas chromatograph, equipped with a 30 m×0.25 mm i.d., 0.25m film thickness, Stabilwax (JW Scientific) fused silica capillary column, connected to a Var-ian Saturn III mass selective detector and operated according to the method described by Cˆamara et al.[32]. Splitless injec-tion mode was used. The initial oven temperature was set to 40◦C for 1 min. The temperature was increased in three steps: 40–120◦C, at 1◦min−1; 120–180◦C at 1.7◦C min−1 and 180–220◦C, at 25◦C min−1. Each step was preceded by a small period at constant temperature of 2, 1 and 10 min, respectively. The injector temperature was 250◦C and the transfer line was held at 220◦C. Mass spectra were recorded after electronic impact (EI) ionisation at 70 eV. The mass-to-charge ratio range (m/z) used was 30–300 (1.9 spectra s−1). The ion source and mass ion trap temperatures were set to 180◦C.
2.4. Statistical analysis
Significant differences among the four Madeira wines varieties for each of the constituents were determined by one-way analysis of variance (Anova) using a SPSS Program, version 11.0 (SPSS Inc., 2003). Principal component analy-sis and stepwise linear discriminant analyanaly-sis were performed using the same SPSS program. These techniques were applied to the normalized relative amounts of the volatile compounds.
Principal component analysis is an unsupervised
tech-nique that reduces the dimensionality of the original data matrix retaining the maximum amount of variability [37],
allowing the visualisation of the different wines in a two dimensional space and identifying the directions in which most of the information is retained. It is therefore possible to explain the differences between various wines by means of factors obtained from the data sets and, at the same time, to determine which variables contribute the most for such differences.
Stepwise linear discriminant analysis is a supervised
method used for classification purposes. SLDA renders a number of orthogonal linear discriminant functions equal to the number of categories minus one. This method minimises the variance within categories and maximises the variance between categories[38]. The variables included in the anal-ysis are determined with a stepwise-LDA using a Wilk’s Lambda as a selection criterion and anF-statistic factor to establish the significance of the changes in Lambda when a new variable is tested. The prediction capacity of the dis-criminant models was studied by “cross validation” in order to determine the stability of the model.
3. Results and discussion
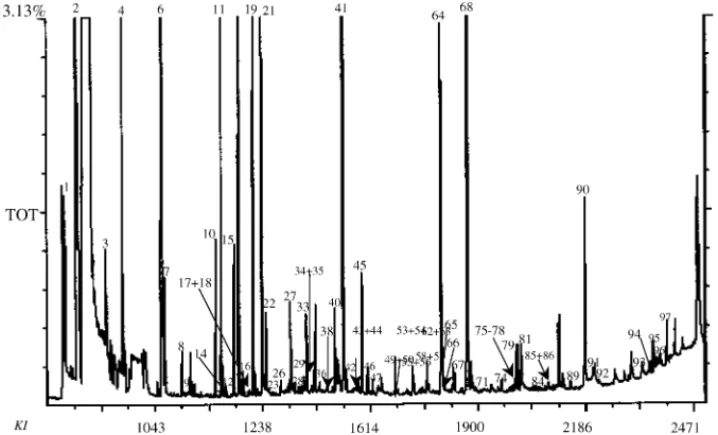
The HS-SPME/GC–MS method developed was found to be fully suitable for the analysis of volatile compounds in wine due to its selectivity and sensitivity. A total ion current (TIC) chromatogram obtained for aMalvaziawine sample with the 85m fibre at the optimal extraction conditions[31], can be seen inFig. 1. Careful analysis of the chromatograms allowed the assignment of clearly different mass spectra for about eighty peaks (Table 1). The compounds were identified by comparison with mass spectra obtained from the sam-ple with those from pure commercially available standards injected in the same conditions, by comparing the Kovats indexes and the mass spectra included in the NIST library.
The average values from three consecutive harvests showed that these wines have characteristic profiles. Higher alcohols, fatty acids and ethyl esters are the major groups in all studied varieties.Boalwines are characterised by the highest content of C13 norisoprenoids, higher alcohols and
carbonyl compounds.Malvaziawines show the highest con-centrations of monoterpenes.Sercialwines present important levels of acetates, fatty acids and ethyl esters and the highest content of fix acids and phenols whileVerdelhowines are characterised by the highest content of ethyl esters and furan compounds.Fig. 2shows the relative amount of total free fraction for each chemical group in the Madeira wines under study.
The compounds clearly identified were used for statisti-cal treatments. All statististatisti-cal treatments were performed on corrected peak area data (peak area/internal standard area).
3.1. Principal component analysis (PCA)
Fig. 1. Typical total ion current (TIC) chromatogram of aMalvaziawine sample obtained by HS-SPME/GC–MS using a 85m PA fibre. Identified analytes are listed inTable 1(KI: Kov´ats Indice).
alcohols,fatty acids,ethyl estersandcarbonyl compounds. Principal component analysis from data matrix was then per-formed in each one of the different groups in order to find the main sources of variability and to establish the relation between varieties and volatile compounds. Although the best procedure is to analyse all variables at the same time, we choose to subdivide the compounds into several groups of variables for the consistency of the results, maintaining the number of cases equal or higher than the number of variables.
3.2. Higher alcohols
When higher alcohols were analysed by PCA, a clear differentiation among varieties was found. No apparent dif-ferentiation was observed when considering the harvesting year.
Fig. 2. Total free fraction (Ac/Ais: compound area/internal standard area) for the chemical groups studied (Terp: monoterpenes; Nor: C13 noriso-prenoids; Alcohols: higher alcohols; Acet.: acetates; Carb comp.: carbonyl compounds).
Applying PCA to the normalized relative amounts of the 11 analytical variables (higher alcohols) and 36 objects (wines), two factors were extracted explaining 81.2% of the total variance of initial data set. The observation of the load-ing scores suggests that two variables, havload-ing coefficients magnitude <0.8 – propan-1-ol and 3-methylbutan-1-ol – are insufficient to adequately describe the samples according to variety, and were removed from the matrix. The new set (data matrix 36×9) account for 87.9% of the total variance in the data. The first principal component (PC1) explains 62.2% of the variance in the initial data set and the second principal component (PC2) explain 25.7%. The eigenvalues, percent-age of variance and the cumulative percentpercent-age explained by the two first principal components are showed inTable 3.
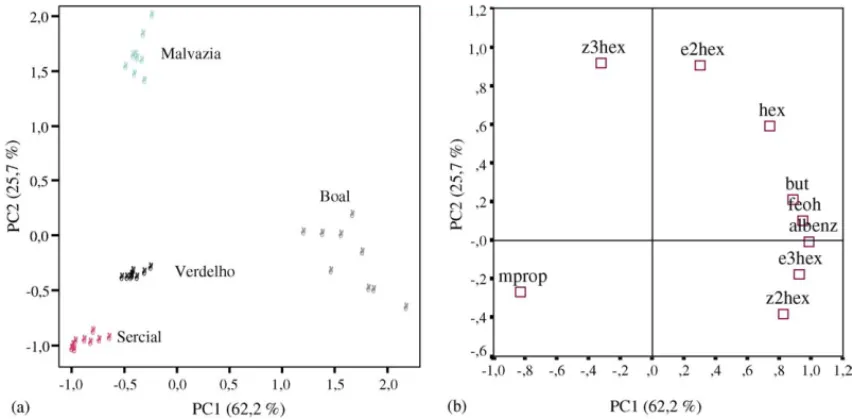
The projections of the samples along the directions identi-fied by the first two PC’s, is reported inFig. 3a where the first principal component (PC1) of wine samples is plotted against the second principal component (PC2). The separation of the different categories of wine samples from this PC1–PC2 scat-ter point plot is obvious. This figure shows that wines from
Malvazia,SercialandVerdelhovarieties were separated by the second principal component, while wines fromBoal vari-ety are most influenced by the variables related with the first PC.
Fig. 3. PC1 vs. PC2 scatter plot of the main sources of variability between the Madeira wines (a) distinction between the samples (scores) and (b) relation between the nine higher alcohols (loadings).
variable and it is therefore useful for the study of relations among the higher alcohols and between variables and wines. The wines from varietiesSercialandVerdelhoare located in the third quadrant (negative PC1 and PC2). Only 2-methylpropan-1-ol (−0.86) is in accordance with this req-uisite. These wines show low values of (Z)-hex-3-en-1-ol and (E)-hex-2-en-1-ol and very low values of hexan-1-ol and all other variables influencing positively the first PC.
Malvaziawines are located in the second quadrant
(nega-tive PC1 and posi(nega-tive PC2). (Z)-Hex-3-en-1-ol (−0.32; 0.92) and (E)-hex-2-en-1-ol (0.77; 0.49) are strongly associated with this quadrant.Boalwines are essentially represented in the fourth quadrant (positive PC1 and negative PC2). Ben-zyl alcohol (0.98; −0.12), 2-phenylethanol (0.95; −0.02), butan-1-ol (0.92; 0.09), (E)-hex-3-en-1-ol (0.92;−0.18) and
(Z)-hex-2-en-1-ol (0.83;−0.38) are the variables related with these wines (Fig. 3b). They are characterized by low values of 2-methylpropan-1-ol (−0.86;−0.20).
3.3. Fatty acids
The 13 variables from the initial data matrix of fatty acids (Table 2) explained 66.8% of the variance. The redundant variables not contributing to the explanation of total variance (coefficients magnitude <0.8) were removed from the data set. PCA showed a clear separation of wines according to varieties when a data matrix (36×6) with the fatty acids – propionic, hexanoic, octanoic, 2-hydroxybenzenepropionic, 2-ethyl-hexanoic and benzoic – is used. The first two princi-pal components accounted for 85.8% of the total variance of
Table 1
Volatile compounds identified inMalvaziawines
Terpenes
20 trans-Linalool oxide
23 cis-Linalool oxide
26 Unknown 1 (93 + 121 + 136)
33 Linalool
38 2,6-Dymethylocta-1,7-dien-3,6-diol
47 ␣-Terpineol
55 (+)-␦-Cadinene
57 Citronellol
59 Unknown 2 (93 + 121 + 136)
66 Geraniol
86 Nerolidol
91 Farnesol
C13norisoprenoids
288 Vitispirane I
29 Vitispirane II
48 Unknown 3 (177 + 192)
52 TDN
63 -Damascenone
Higher alcohols
3 Butan-1-ol
5 4-Methylpentan-2-ol
6 2-Methylbutan-1-ol
11 Hexan-1-ol
12 (E)-Hex-3-en-1-ol
15 (Z)-Hex-3-en-1-ol
16 (E)-Hex-2-en-1-ol
17 (Z)-Hex-2-en-1-ol
32 Butan-1,3-diol
34 Nonan-1-ol
50 3-Methyltio-propan-1-ol
67 Benzyl alcohol
68 2-Phenylethanol
84 2-Phenoxyethanol
Acetates
4 3-Methylbutyl acetate
8 Hexyl acetate
62 2-Phenylethyl acetate
Fatty acids
21 Acetic acid
31 Propionic acid
35 Dimethylmalonic acid
40 Butanoic acid
44 3-Methylbutanoic acid
49 2-Hydroxybenzenepropionic acid
65 Hexanoic acid
71 2-Ethyl-hexanoic acid
81 Octanoic acid
83 Nonanoic acid
91 Decanoic acid
93 Benzoic acid
95 Dodecanoic acid
99 Tetradecanoic acid
Ethyl esters
2 Ethyl acetate
7 Ethyl hexanoate
19 Ethyl octanoate
30 Ethyl nonanoate
41 Ethyl decanoate
42 Ethyl benzoate
46 Ethylcis-9-decenoate
58 Ethyl benzeneacetate
Table 1 (Continued)
64 Ethyl dodecanoate
79 Ethyl tetradecanoate
90 Ethyl hexadecanoate
97 Methyl-7,10-octadecadienoate
Ethyl esters of fix acids
9 Ethyl 2-oxopropanoate
10 Ethyl lactate
18 Ethyl 2-hydroxy-3-methylbutanoate 25 Ethyl 2-hydroxypropanoate
45 Diethyl succinate
76 Isopropyl miristate
78 Ethyl 3-hydroxyhexanoate
Carbonyl compounds
1 Acetaldehyde
27 Benzaldehyde
94 1-(2-Methylphenyil)ethanone
Phenols
56 Methyl salicilate
75 4-Ethyl-2-methoxyphenol 77 (1,1-Dimethylethyl)-2-methoxyphenol 88 Eugenol Furans 22 Furfural 87 5-(Acetoxymethyl)furfural 96 5-(Hydroxymethyl)furfural 69 pantolactone
53 ␥-Butyrolactone
Others
43 Non-1-ene
51 Non-3-ine
73 1,3-Dymethylnaphtalene
89 1,6-Dimethyl-4-(1-methylethyl)-naphtalene
the initial data set.Table 3present the eigenvalues, cumula-tive percentage and total variance explained by the two first principal components. The first component explains 51.9% of the variability in the initial data set and the second com-ponent explains 33.9%.
InFig. 4a, the first principal component (PC1) is plotted against the second principal component (PC2). The separa-tion among different categories of wine samples from this PC1–PC2 scatter point plot is obvious.Fig. 4b shows the cor-responding loadings plot that establishes the relative impor-tance of each variable and it is therefore useful for the study of relations among the acids compounds and relations between fatty acids and wines.
The variables with the highest contribution to the first component, explaining 51.9% of total variance of data set, are benzoic acid (0.91), octanoic acid (−0.89), 2-hydroxybenzenepropionic acid (0.85) and, in minor extent, hexanoic acid (−0.78). The second principal component (33.9% of total variability) is strongly correlated with pro-pionic acid (0.91) and 2-ethyl-hexanoic acid (0.85) (Fig. 4b). From the plot of the 36 wines on the plane defined by these first two principal components, the wines Malvazia
Table 2
Identification of the 42 variables used in the multivariate analysis
Variable Identification
Higher alcohols
prop Propan-1-ol
mprop 2-Methylpropan-1-ol
mbut 2 + 3-Methylbutan-1-ol
but Butan-1-ol
hex Hexan-1-ol
e3hex (E)-Hex-3-en-1-ol
z3hex (Z)-Hex-3-en-1-ol
e2hex (E)-Hex-2-en-1-ol
z2hex (Z)-Hex-2-en-1-ol
albenz Benzyl alcohol
feoh 2-Phenylethanol
Fatty acids
eta Etanoic acid
prop Propionic acid
mbut 3-Methylbutanoic acid
but Butanoic acid
dmm Dymethylmalonic acid
hexa Hexanoic acid
etilhexa 2-Ethylhexanoic acid
hbprop 2-Hydroxybenzenepropionic acid
octa Octanoic acid
nona Nonanoic acid
Deca Decanoic acid
dodeca Dodecanoic acid
Benz Benzoic acid
Ethyl esters
C6C2 Ethyl hexanoate
C8C2 Ethyl octanoate
C9C2 Ethyl nonaoate
C10C2 Ethyl decanoate
deceet cis-9-Ethyl decenoate
benzacet Ethyl benzeneacetate
C12C2 Ethyl dodecanoate
C14C2 Ethyl tetradecanoate
C16C2 Ethyl hexadecanoate
C18C2 Ethyl octadecanoate
sde Diethyl succinate
Carbonyl compounds
nona Nonanone
benzal Benzaldehyde
fur Furfural
emf 5-(Ethoxymethyl)furfural
hmf 5-(Hydroximethyl)furfural
butiro ␥-Butirolactone
pantol Pantolactone
The variables used in the SLDA are indicated in bold.
two first principal components being characterized, primar-ily, by benzoic acid (0.91; 0.33) and in minor extent by 2-hydroxybenzenepropionic acid (0.85; 0.43) and 2-ethyl-hexanoic acid (0.36; 0.85). Propionic acid (0.91; −0.10), octanoic acid (−0.89; 0.01) and hexanoic acid (−0.78; 0.43), are the characteristic variables forVerdelhowines (negative PC1 and positive PC2).
SercialandBoalsamples are represented in the third (neg-ative PC1 and PC2) and fourth (positive PC1 and neg(neg-ative PC2) quadrants, respectively. The first PC explains the sepa-ration fromSercialandVerdelhowines toBoalandMalvazia
wines, while the second PC separatedSercialandBoalwines fromVerdelhoandMalvaziawines (Fig. 4a).
3.4. Ethyl esters
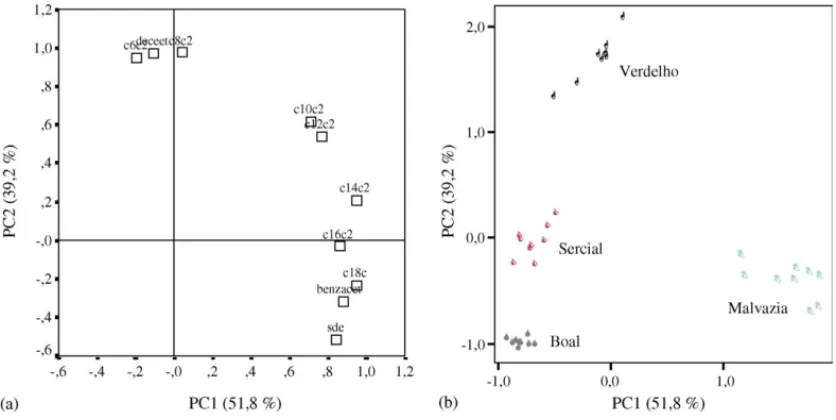
Principal component analysis from the data matrix (36×10) built with ethyl esters, was also performed. It was observed that 91.0% of the total variance of these pounds could be explained by the first two principal com-ponents (Table 3). The first principal component, explain-ing 51.8% of the variance, is mainly associated with ethyl octadecanoate (0.95), ethyl tetradecanoate (0.95) ethyl ben-zeneacetate (0.88), while ethyl octadecanoate (0.98),cis -9-ethyldecenoate (0.97) and ethyl hexanoate (0.95) contribute in great extent to the second principal component, explaining 39.2% of the total variance (Fig. 5a).
From the plot of the 36 wines on the plane defined by these first two principal components, theMalvaziawines appear on the right side of the plane, grouped by variety, while wines of varietiesBoal,SercialandVerdelhoare found on the left side of the plane (Fig. 5b).
Verdelhowines are characterized by the variables
con-tributing with positive values to PC2 and negative to PC1. Thuscis-9-ethyldecenoate (−0.11; 0.97) and ethyl hexanoate (−0.19; 0.95), are the major contributions to the differentia-tion ofVerdelhofrom other types of Madeira wines.Sercial
andBoalwines are contained in the third quadrant (nega-tive values for PC1 and PC2). Ethyl octadecanoate (0.95; 0.23), ethyl benzeneacetate (0.88; −0.32), ethyl hexade-canoate (0.86; 0.31) and diethyl succinate (0.84;−0.51), are strongly associated toMalvaziawines.
3.5. Carbonyl compounds
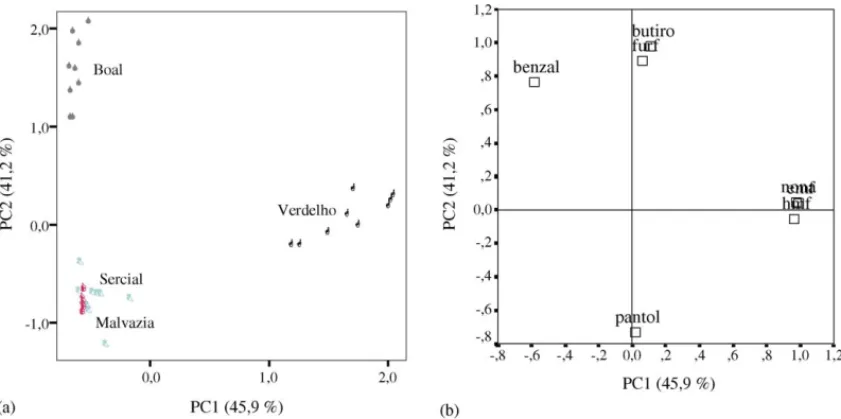
Applying the principal component analysis to the data matrix (36×7) built with the seven variables of car-bonyl compounds, two principal components were extracted explaining 87.1% of the total variability. The variables strongly associated with the first component, 5-(ethoxymeth-yl) furfural (0.99), nonanone (0.98) and 5-(hydroxymeth5-(ethoxymeth-yl) furfural (0.96), explain 45.9% of the variability in the ini-tial data set. The second component explained 41.2% and is mainly associated with ␥-butyrolactone (0.98) and fur-fural (0.89). The eigenvalues, percentage of variance and cumulative percentage explained by the two first principal components for carbonyl compounds are presented inTable 3.
Fig. 6a shows the scores scatter plot on the two first prin-cipal components, representing the differences among the 36 wine samples.Fig. 6b represents the corresponding loadings plot that establishes the relative importance of each carbonyl compounds, and is therefore useful for the study of relations among the carbonyl compounds and the relations between carbonyl compounds and samples.
benzalde-Table 3
Eigenvalues, percentage of variance and cumulative percentage explained by the two principal components for each chemical group under study
Group Principal component Eigenvalue Rotation sums of squared
Variance (%) Cumulative (%)
Higher alcohols 1 5.657 62.231 62.231
2 2.317 25.744 87.975
Fatty acids 1 3.112 51.859 51.859
2 2.038 33.969 85.828
Ethyl esters 1 5.179 51.787 51.787
2 3.921 39.214 91.001
Carbonyl compounds 1 3.212 45.881 45.881
2 2.886 41.230 87.111
The bold values are indicative of the total percentage explained by the two first principal components.
hyde (−0.41; 0.89). The third quadrant contains theMalvazia andSercialwines (negative PC1 and PC2). There is no car-bonyl compounds associated with this quadrant.
Verdelhosamples are represented in fourth quadrant (posi-tive PC1 and nega(posi-tive PC2). 5-(Ethoxymethyl) furfural (0.99; 0.04), nonanone (0.98; 0.05) and 5-(hydroxymethyl) furfural (0.96;−0.05) are the variables most related with this wine variety.
3.6. Stepwise linear discriminant analysis (LDA)
After PCA, a linear discriminant analysis was applied to look at the most useful variables in the differentiation between wines and to find discrimination functions for the classification of new samples in the correct group. This para-metric method is widely used for classification purposes. The classification was performed according to wine variety:Boal,
Malvazia,SercialandVerdelho. Two statistically significant discriminant functions were obtained, explaining 98.5% of
the variability. The variables: (Z)-hex-3-en-1-ol and diethyl succinate (first root—92.9%) and 5-(ethoxymethyl)furfural, ethyl octanoate and hexanoic acid (second root—5.6%), had the highest F-value, so they were the most important variables for the differentiation of the wines from these four varieties.
The prediction capacity of the SLDA model was evalu-ated by “leave-one-out” cross validation. During this cross validation test, ungrouped cases are removed from the ini-tial matrix of data. The classification model is rebuilt and the cases removed are classified in this new model.Table 4 sum-marises the results of the classification matrix of the obtained SLDA model, obtained for all the samples and separated for variety, showing an average classification of 96.4%, meaning that 7/8 of the objects were correctly classified (Table 4). All Madeira wines studied showed high percentage of correctly classified cases, almost 100% in the case of Malvaziaand
Verdelhowines. Then the results can be considered satisfac-tory and acceptable and the selected variables are useful to
Fig. 6. PC1 vs. PC2 scatter plot of the main sources of variability between the Madeira wines (a) distinction between the samples (scores); (b) relation between the seven carbonyl compounds (loadings).
classify and differentiate these wines by their variety. Due the great importance of Madeira wines in the Madeira Island economy, this is a good result to find possible adulterations and falsifications.
Table 4
Prediction capacity of Madeira wines discriminant model by cross validation according to wine variety
Classification resultsa,b Total
Casta 1 Predicted group membership
VB VM VS VV
Original
Count VB 7 0 0 0 7
VM 0 7 0 0 7
VS 0 0 7 0 7
VV 0 0 1 6 7
Ungrouped cases 2 2 2 2 8
Percent VB 100.0 0 0 0 100.0
VM 0 100.0 0 0 100.0
VS 0 0 100.0 0 100.0
VV 0 0 14.3 85.7 100.0
Ungrouped cases 25.0 25.0 25.0 25.0 100.0
Cross-validatedc
Count VB 7 0 0 0 7
VM 0 7 0 0 7
VS 1 0 6 0 7
VV 0 0 0 7 7
Percent VB 100.0 0 0 0 100.0
VM 0 100.0 0 0 100.0
VS 14.3 0 85.7 0 100.0
VV 0 0 0 100.0 100.0
VB:Boalwine; VM:Malvaziawine; VS:Sercialwine and VV:Verdelho wine.
a96.4% of original grouped cases correctly classified. b 96.4% of cross-validated grouped cases correctly classified.
cCross validation is done only for those cases in the analysis. In cross validation, each case is classified by the functions derived from all cases other than that case.
4. Summary and conclusions
HS-SPME/GC–MS is a fast and useful method for isola-tion and quantificaisola-tion volatile compounds in wines allowing a rapid screening of aroma compounds in wines of different varieties.
Data processing through univariate analysis of variance (Anova) and multivariate analysis (PCA and SLDA) allow good differentiation, classification and prediction models for Madeira wines according to grape varieties. All chemical groups investigated achieved a good separation according to variety, but higher alcohols and ethyl esters seem to be the most important groups for the characterization of Madeira wines.
The variables most correlated with Boal wines are: benzyl alcohol (0.98; −0.12), (E)-hex-3-en-1-ol (0.92; −0.18), benzaldehyde (−0.41; 0.89) and (Z )-hex-2-en-1-ol (0.83; −0.38). Ethyl octadecanoate (0.95; 0.23), (Z)-hex-3-en-1-ol (−0.32; 0.92), benzoic acid (0.91; 0.33), ethyl benzeneacetate (0.88; −0.32) and in minor extent ethyl hexadecanoate (0.86; 0.31), 2-hydroxybenzenepropionic acid (0.85; 0.43), 2-ethyl-hexanoic acid (0.36; 0.85) and diethyl succinate (0.84; −0.51) are strongly associated to Malvazia wines. 2-Methylpropan-1-ol (−0.83; −0.26) is the variable most related with Sercial wines. Verdelho wines are most associated with 5-(ethoxymethyl)furfural (0.99; 0.04), nonanone (0.98; 0.05), cis-9-ethyldecenoate (0.11; 0.97), 5-(hydroxymethyl)furfural (0.96; −0.05), ethyl hexanoate (0.19; 0.95), propionic acid (0.91; −0.10), octanoic acid (−0.89; 0.01) 2-methylpropan-1-ol (−0.83; −0.26) and hexanoic acid (−0.78; 0.43).
Acknowledgments
We gratefully acknowledge the Instituto do Vinho da
MadeiraandMadeira Wine Companyfor the supply of wine
samples, CQM (Madeira Research Chemistry Centre) for the technical support and PRODEP (4/5.3/PRODEP/2000) for financial support.
References
[1] R.F. Simpson, G.C. Miller, Vitis 22 (1983) 51.
[2] J.S. Cˆamara, M.A. Alves, J.C. Marques, A.C. Silva Ferreira, Anal. Bioanal. Chem. 373 (2003) 1221.
[3] A.C. Silva Ferreira, A. Bertrand, Œnologie 95, in: 5e Symposium International d’œnologie, Bordeaux, Lavoisier, Tec & Doc, Paris, 1996, p. 520.
[4] R.F. Simpson, J. Sci. Food Agric. 28 (1980) 214.
[5] J.S. Cˆamara, P. Herbert, J.C. Marques, M.A. Alves, Proceedings of the 3th Symposium In Vino Analytica Scientia, Aveiro, Portugal, 2003.
[6] A. Rapp, H. Mandery, Experientia 42 (1986) 873.
[7] S.P. Arrhenius, L. McCloskey, M. Sylvan, J. Agric. Food Chem. 44 (1996) 1085.
[8] R. Baumes, R. Cordonnier, S. Nitz, F. Drawert, J. Sci. Food Agric. 37 (1986) 927.
[9] A. Rapp, Fresenius J. Anal. Chem. 337 (1978) 777.
[10] I. Moret, G. Scarponi, P. Cescon, J. Agric. Food Chem. 42 (1994) 1143.
[11] V. Ferreira, P. Fernandez, C. Pe˜na,aEscudero, J. Cacho, J. Sci. Food Agric. 67 (1995) 381.
[12] A.C. Noble, R.A. Flath, R.R. Forrey, J. Agric. Food Chem. 28 (1980) 346.
[13] W.O. Kwan, B.R. Kowalski, J. Agric. Food Chem. 28 (1980) 356. [14] C.M. Garc´ıa-Jares, M.S. Garc´ıa-Martin, N. Carro-Mari˜no, R.
Cela-Torrijos, J. Agric. Food Chem. 43 (1995) 175.
[15] M.A. Alves, Ph.D. Thesis, Faculdade de Engenharia da Universidade do Porto, 1992.
[16] P. Guedes de Pinho, Th`ese de Doctorat (n◦ 308) de l’Universit´e Victor Segalen Bordeaux 2, 1994.
[17] M.P. Day, B.L. Zhang, G.J. Martin, J. Food Sci. Agric. 67 (1995) 113.
[18] K. Wada, J. Shibamoto, J. Agric. Food Chem. 45 (1997) 4362.
[19] V. Ferreira, A. Rapp, J.F. Cacho, H. Hastrich, I. Yavas, J. Agric. Food Chem. 41 (1993) 1413.
[20] J.M. Nu˜nez, H. Bemelmans, J. Chromatogr. 294 (1984) 361. [21] R. L´opez, M. Aznar, J.F. Cacho, V. Ferreira, J. Chromatogr. A 966
(2002) 166.
[22] Y. Zhou, R. Riesen, C.S. Gilpin, J. Agric. Food Chem. 44 (1996) 818.
[23] G.P. Blanch, G. Reglero, M. Herraiz, J. Agric. Food Chem. 43 (1995) 1251.
[24] A. Razungles, H. El, R. Tarhi, Y.Z. Baumes, Y.Z. G¨unata, C. Tapiero, C.L. Bayonove, Sci. Aliments 14 (1994) 725.
[25] C. Cocito, G. Gaetano, C. Delfini, Food Chem. 52 (1995) 311.
[26] R. Eisert, J. Pawliszyn, Crit. Rev. Anal. Chem. 27 (1997) 103. [27] C.L. Arthur, J. Pawliszyn, Anal. Chem. 62 (1990) 2145.
[28] M. Aznar, R. L´opez, J.F. Cacho, J.V. Ferreira, J. Agric. Food Chem. 51 (2003) 2700.
[29] R. L´opez, N. Ort´ın, J.P. P´erez-Trujillo, J.F. Cacho, V. Ferreira, J. Agric. Food Chem. 51 (2003) 3419.
[30] J.S. Cˆamara, P. Herbert, J.C. Marques, M.A. Alves, Oenologie 2003, 7e Symposium International d’Oenologie. Editions Tec & Doc, 2003, p. 413.
[31] J.S. Cˆamara, J.C. Marques, M.A. Alves, Adv. Mass Spectrom. 15 (2001) 943.
[32] J.S. Cˆamara, P. Herbert, J.C. Marques, M.A. Alves, Anal. Chim. Acta 513 (2004) 203.
[33] J.J. Bencomo-Rodr´ıguez, J.E. Conde, M.A. Rodr´ıguez-Delgado, F. Garc´ıa-Montelongo, J.P. P´erez-Trujillo, J. Chromatogr. A 963 (2002) 213.
[34] T. Tominaga, M.-L. Murat, D. Dubourdieu, J. Agric. Food Chem. 46 (1998) 1044.
[35] Jos´e S. Cˆamara, M. Arminda Alves, Jos´e C. Marques, Anal. Chim. Acta (2005) in press.
[36] De la Calle Garcia, S. Magnaghi, M. Reichenbacker, K. Danzer, J. High Resolut. Chromatogr. 19 (1996) 257.
[37] M. Forina, C. Armanino, M. Castino, M. Ubigli, Vitis 25 (1986) 189.