Analytical characterization of the aroma of Tinta Negra Mole red wine:
Identification of the main odorants compounds
R. Perestrelo
a, A. Fernandes
a, F.F. Albuquerque
b, J.C. Marques
a, J.S. Cˆamara
a,∗ aMadeira Chemistry Research Center, Depto. de Qu´ımica da Universidade da Madeira, Campus,Universit´ario da Penteada, 9000-390 Funchal, Portugal
bMadeira Wine Company, Rua dos Ferreiros, 191, 9000-82 Funchal, Portugal Received 10 August 2005; received in revised form 7 October 2005; accepted 12 October 2005
Available online 11 November 2005
Abstract
A method for the simultaneous determination of major and minor volatiles composition in different types (dry, medium dry, sweet and medium sweet) of a young Tinta Negra Mole (TNM) monovarietal red wine from 2003 harvest has been validated. Wine samples preparation includes a dichloromethane liquid–liquid extraction followed by concentration under a nitrogen atmosphere. The extracted fraction was analysed by gas chromatography–mass spectrometry and give quantitative information for more than 86 analytes whose concentration range from fewg l−1
to 259.1 mg l−1. The method enables high recovery of volatile compounds in wine good linearity with (r2) values higher than 0.980 and good
sensitivity. The limits of detection range from 0.003 to 0.534 mg l−1and limits of quantification from 0.009 to 1.170 mg l−1.
The method allows satisfactory determination of more than 80 compounds in the TNM red wines. These wines are characterized by a high content of higher alcohols, ethyl esters, fatty acids and lactones. The levels of sulphur compounds in Tinta Negra Mole medium sweet wines are very low, but they have the highest concentration of carbonyl compounds. Quantitative analysis of the main odorants followed by the determination of aroma index allow us elucidate the aroma of these varieties. On the basis of their odour description and odour threshold, the most powerful odorants of Tinta Negra Mole wines were tentatively established.
© 2005 Elsevier B.V. All rights reserved.
Keywords: Wine; Tinta Negra Mole variety; Aroma compounds; Odorants
1. Introduction
Tinta Negra Mole (TNM) is the main grape variety used in the production of Madeira wines. This variety represents 85–90% of the Madeira Island Vineyard, with a mean production of 42,000 hl. As far as we know, the aroma of this variety has not yet been characterized[1]. The Madeira wines alcoholic content lies between 17 and 22% (v/v) and is commercially available in different types: dry, medium dry, sweet, medium sweet, accord-ing to the sugar content[2].
Among the many factors that contributed to the typicity and quality of wine, aroma is probably the most important organoleptic characteristic and a key attribute for consumers. Several hundred chemically different flavour compounds such as: higher alcohols, aldehydes, ethyl esters of fatty acids, fatty
∗Corresponding author. Tel.: +351 291705112; fax: +351 291705149.
E-mail address:[email protected] (J.S. Cˆamara).
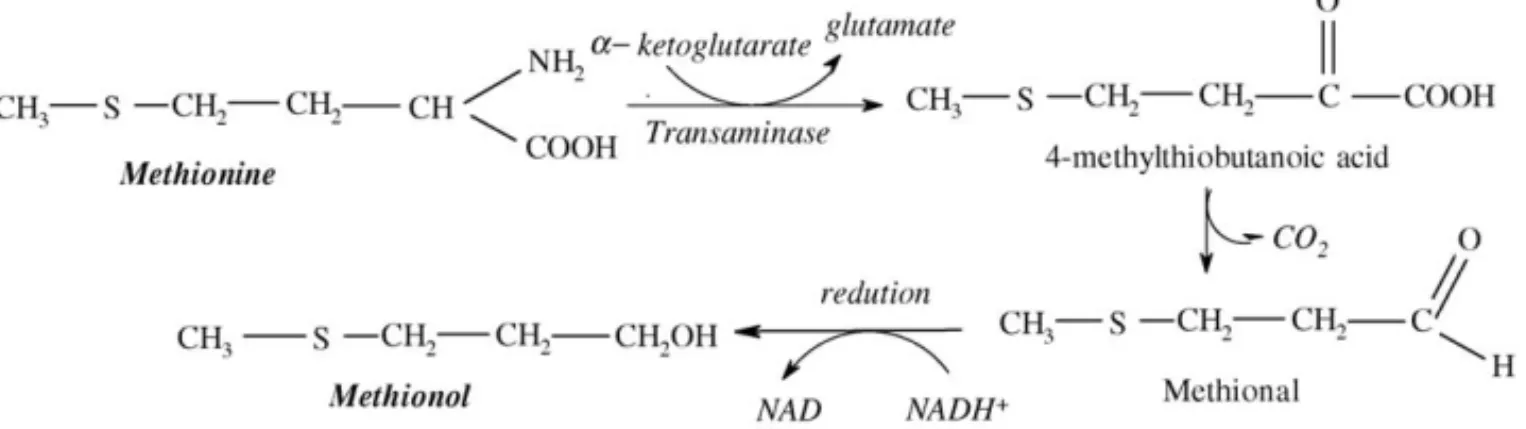
acids, ketones, monoterpenes, volatile phenols, among others, have been found in wines[3]. They have quite different chemical and physical properties like polarity and volatility and their con-centrations range from few ng l−1to more than 100 mg l−1[4]. Among the aromas that are released to the medium as sec-ondary products of the metabolism of the yeasts, were the fusel alcohols: iso-butanol, iso-amyl alcohol, 2-phenylethanol and propanol. These compounds can be synthesised by yeast action through two mechanisms: anabolic pathway from glucose, or catabolic pathway from their corresponding amino acids (valine, leucine,iso-leucine and phenylalanine)[5]. Another compound related with the catabolic pathway and which was associated with this factor was methionol, formed from the amino acid methionine (Fig. 1). It should be remembered that the compo-sition in amino acids depends on the variety of grape[6–8]and for that reason all these volatile compounds are related to the variety of grape used.
Over the last few decades wine aroma has been thoroughly studied, resulting in knowledge of about 800 compounds as
Fig. 1. Suggested mechanism for methionol formation from methionine by yeasts.
stituents of the volatile fraction of the wine. Some components are present in high concentration (hundreds of mg l−1), but most of them are found at the low ng l−1 level [9–13]. Therefore some components need to be extracted and concentrated before analysis, while others can be analysed by GC with direct injec-tion. Several classical analytical methods such as liquid–liquid extraction [14,15], simultaneous distillation–extraction [16], solid phase extraction[17], supercritical fluid extraction[18], microwaves extraction [19] and ultrasound extraction [20], among others, have been developed for the analysis of the minor volatile compounds in wines. Although it is a time-consuming technique liquid–liquid extraction is a widely used sample preparation method for the determination of wine volatiles which extract contains a wide spectrum of components [21]. Among the solvents that have been used for the enrichment of aroma substances, dichloromethane has been found to be well suited for extracting volatiles from a matrix with a high alcohol content such as TNM wines.
Identification of wine aroma components and the relation-ships between their relative content may be a useful tool in differentiating the wines from different varieties and establish-ing criteria of genuineness to improve the quality of the wines, prevent fraud and guarantee their origin. Volatile composition of TNM wines was investigated in this work. The pool of com-pounds analysed include: grape aroma comcom-pounds such as the terpene alcohols; pre-fermentative compounds which are the C6 alcohols; a large group of secondary or fermentative volatile compounds in which are included: higher alcohols, ethyl esters of fatty acids, acetates of higher alcohols, fatty acids and lac-tones; and finally, post-fermentative compounds in which are included those extracted from wood such as vanillin, 2-furfural and its derivates. The aroma index values were determined to elu-cidate which compounds are considered as aroma contributing substances, in order to offer a means of evaluating the potential aroma of this variety.
2. Experimental
2.1. Reagents
All reagents used were of analytical quality. Absolute ethanol was purchased from Panreac (Barcelone, Spain), dichloromethane was HPLC grade quality was from LabScan and solid anhydrous sodium sulphate (analytical grade) was pur-chased from Merck (Darmstadt, Germany). Water was obtained
from a Milli-Q purification system (Millipore). Solvents did not require additional destilation. The pure reference compounds used were from Sigma–Aldrich (Spain).
2.2. Standard solutions
Exact volumes of the chemical standard compounds were dis-solved in absolute ethanol and made up to volume (50 ml). This standard solution was dissolved in ethanol at concentration three orders of magnitude higher than typically found in wines with approximately six calibration points for each standard. These solutions were then diluted with water and ethanol adjusting the final alcohol content to 18% (v/v) to prepare the calibration plots and to spike different wine samples. All the synthetic wines samples used in the calibration graphs were 6 g l−1of tartaric acid and pH 3.3–3.4 adjusted with 1 M NaOH (synthetic wine matrix). Octan-3-ol was employed as internal standard. All these solutions were stored at 4◦C.
2.3. Sample wines
The TNM red wines used in this study were made from the 2003 harvest grapes grown in the Portuguese RAM Appella-tion. Grapes of TNM were crushed, de-stemmed, racked and pressed. The musts were fermented in stainless-steel containers, with spontaneous yeast. Alcoholic fermentation was carried out at 22◦C and stopped by addition of natural grape spirits accord-ing to the wine sugar content to obtain. The different TNM wines types produced were: dry (TNM-D), medium dry (TNM-MD), sweet (TMN-S) and medium sweet (TNM-MS). The wine sam-ples, 12 of each wine type, were taken directly from the cellars in October 2004, and stored at−28◦C until analysis.
2.4. Sample extraction conditions
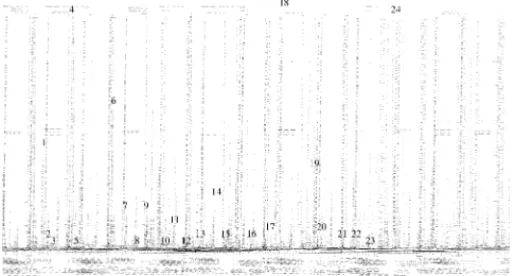
Fig. 2. TIC chromatogram of a TNM-MD red wine dichloromethane extract. Peak identification: (1) 2-methylpropan-1-ol; (2) isoamyl acetate; (3) butan-1-ol; (4) 3-methylbutan-1-ol; (5) ethyl hexanoate; (6) ethyl lac-tate; (7) octan-3-ol (internal standard); (8) ethyl octanoate; (9) acetic acid; (10) cis-dioxane; (11) (D,L)-butan-2,3-diol; (12) 2-methylpropanoic acid; (13) (R,S)-butan-2,3-diol; (14) ethyl decanoate; (15) diethyl succinate; (16) methionol; (17) methyl-2-ethylhexanoate; (18)-phenylethanol; (19) ethyl 3-hydroxybutyrate; (20) octanoic acid; (21)␥-octalactone; (22)␥-nonalactone; (23)␣-hydroxyphenylpropanoic acid; (24) ethyl succinate.
comparisons with mass spectra obtained from the sample with those from the pure standards injected in the same conditions by comparing the Kov´ats index and the mass spectra presents in the NIST MS library Database, or in the literature.
2.5. Gas chromatography–mass spectrometry (GC–MS) conditions
Extracts were analysed using a Varian Star 3400 Cx Series II gas chromatograph equipped with Varian Saturn III mass selective detector and Saturn GC–MS workstation software. The column used was DB-Waxetr (30 m×0.25 mm i.d.×0.25m film thickness) silica capillary column. Splitless injection was used. The carrier gas was helium at a flow rate of 1 ml min−1. The oven temperature program was: 40◦C (for 1 min), then increased to 220◦C, at 2◦C min−1, and held for 10 min. The ion trap detec-tor was set as follows: transfer line temperature 220◦C; manifold and trap temperatures 180◦C. The mass range wasm/z30–300, the emission current 15A and the electron multiplier was set in the relative mode to the auto tune procedures. All mass spec-tra were acquired in the electron impact (EI) mode (Ei= 70 eV, source temperature, 180◦C).
2.6. Method validation
The validation parameters studied were, response linearity, the determination of repeatability (precision), evaluation of the recovery of known quantities of substances (accuracy) and the determination of limits of detection and quantification.
2.6.1. Study of linearity, repeatability and recovery
For each component five-point graphs were obtained in the range of concentrations showed inTable 1. Duplicate calibra-tion graphs, were drawn by the least-squares linear regression method using the relative peak area as response versus con-centration. The correlation coefficient was >0.98. Regression,
slope and origin intercept (Table 1) were calculated by linear least-squares regression.
Repeatability (precision) was evaluated by the relative stan-dard deviation of six independent assays performed under the same analytical conditions in the shortest period of time. For each assay the mean values, standard deviation and coefficients of variation for all compounds were calculated.
Recovery was evaluated by addition of volatile compounds to wines. Samples were submitted to six successive extrac-tions with dichloromethane, after concentration, each organic phase was injected twice into GC/MS. For each volatile com-pounds the recovery percentage was determined by the ratio (C1−C0/C2)×100, whereC0is the concentration of the ana-lyte in the wine,C1the concentration of the analyte in spiked wine sample andC2is the concentration of the analyte added to wine sample.
2.6.2. Limits of detection and quantification
The limits of detection (LOD) were estimated as the con-centration of the analyte that produce a signal-to-noise ratio of three times the standard deviation of they-residuals of the cal-ibration graph, that is 3sy/x/b, wheresy/x is the blank standard
deviation andb is the slope of the line regression. The linear range experiments provide the necessary information to calcu-late the limits of detection, by extrapolating from the lowest concentration point on the linear calibration curve. The limit of quantification (LOQ) can also be estimated as the concentration of analyte producing a signal 10 times that of the noise.
2.7. Quantification
The quantification was carried out following the internal stan-dard quantification method. Thus, octan-3-ol was chosen as internal standard [25l of a 0.422 mg l−1 solution in ethanol (1:1, v/v) of this internal standard was added to each standard and sample]. Quantitative data of the identified compounds were obtained by interpolation of the relative areas versus the internal standard area, in the calibration graphs built for pure reference compounds. The concentration of volatile compounds for which there was no pure reference available was obtained by using the same calibration graphs as one of the compounds with the most similar chemical structure. Since the repeatability of the chromatographic method was very good (with coefficients of variation lower than 4.0% in average), only two injection of each dichloromethane extract was carried out.
3. Results and discussion
3.1. Method validation
Table 1
Method linearity data for the compounds identified in different types TNM red wines
Kov´ats index Compounds Linear range (mg l−1) r2 Slope Intercept LOL (%)
Terpenes
1501 -Citronellal 0.4–103.2 0.997 0.921±0003 −2.178 99.0
1641 Linalool 0.4–115.2 0.997 0.473±0.031 −0.562 99.0
1725 ␣-Terpineol 0.24–45.4 0.998 1.358±0.004 −0.389 99.7
1827 Nerol 0.5–41.7 0.999 0.550±0.046 −0.449 99.0
1845 -Damascenone 0.5–112.1 0.983 0.636±0.057 −1.088 99.0
1877 Geraniol 0.4–105.4 0.994 0.579±0.017 −1.104 99.0
2007 (E)-Nerolidol 0.4–105.0 0.997 0.548±0.061 −0.399 99.0
Higher alcohols
1165 Butan-1-ol 2.5–689.8 0.993 0.228±0.0009 −0.566 99.6
1227 3-Methylbutan-1-ol 6.7–2825.6 0.982 0.082±0.0004 −0.046 99.6
1241 Hexan-2-ol 4.0–996.3 0.992 0.157±0.001 −1.464 99.3
1378 Hexan-1-ol 1.2–1023.9 0.995 0.025±0.0001 −0.020 99.4
1410 (E)-3-hexen-1-ol 0.7–50.7 0.998 0.292±0.004 −0.129 98.5
1434 (Z)-2-hexen-1-ol 0.4–50.0 0.999 0.250±0.002 −0.089 99.3
1515 2-Ethyl hexan-1-ol 1.2–349.6 0.987 0.179±0.001 −0.101 99.4
1606 (R,S)-Butan-2,3-diol 17.0–1406.5 0.992 0.002±0.001 −0.030 100.0
1689 Propan-2-ol 5.6–235.6 0.987 0.006±0.0001 −0.032 97.4
1938 2-Phenylethanol 14.9–744.3 0.993 0.750±0.002 −6.649 99.8
2107 2-Phenoxyethanol 19.8–2980 0.992 0.158±0.002 −2.117 98.8
Acetates
1141 Phenylethyl acetate 2.2–540.7 0.997 0.007±0.0001 −0.014 100.0
1845 Isoamly acetate 0.4–302. 8 0.991 0.2536±0.008 −0.120 96.5
Ethyl esters
1066 Ethyl butyrate 0.9–259.2 0.987 0.275±0.013 −0.338 95.2
1148 Ethyl pentanoate 1.0–100.9 0.998 0.547±0.028 −0.588 95.0
1254 Ethyl hexanoate 1.8–259.5 0.988 0.177±0.007 −0.223 95.8
1371 Ethyl lactate 2.0–480.4 0.999 0.113±0.002 −0.121 98.1
1456 Ethyl octanoate 19.5–994.8 1.000 0.002±0.000 −0.053 96.9
1546 Ethyl 3-hydroxybutanoate 1.5–102.0 0.990 0.290±0.010 −0.482 96.6
1659 Ethyl decanoate 0.1–211.4 0.996 0.599±0.000 −0.077 100.0
1673 Ethyl benzoate 1.2–303.1 0.985 0.165±0.000 −0.770 100.0
1697 Ethyl 2-furoate 2.1–256.2 0.994 0.010±0.000 −0.018 97.1
1706 Ethyl succinate 27.6–2158.7 0.987 0.136±0.001 −3.582 99.2
1837 Ethyl salicylate 5.2–1297.2 0.987 0.120±0.003 −4.724 97.8
1865 Ethyl dodecanoate 4.6–205.6 0.994 0.012±0.000 −0.014 100.0
2104 Ethyl cinnamate 4.8–1202.9 0.994 0.061±0.003 −0.674 95.6
Fatty acids
1485 Acetic acid 10.1–853.1 0.990 0.052±0.0014 −0.370 97.3
1600 3-Methylbutanoic acid 0.5–1036.9 0.994 0.059±0.000 −0.032 100.0
1882 Hexanoic acid 1.5–363.1 0.999 0.477±0.000 −0.684 100.0
2059 Octanoic acid 5.6–1037.2 0.981 0.042±0.000 −0.216 99.7
2196 Decanoic acid 0.5–37.8 0.985 0.053±0.000 −0.005 100.0
2280 Benzoic acid 2.4–360 0.986 0.007±0.000 −0.041 97.9
2345 Phenylacetic acid 7.0–60.2 0.996 0.041±0.006 −0.035 84.9
Carbonyl compounds
1101 Hexanal 1.2–300 0.992 0.209±0.007 −0.161 96.6
1556 (Z)-2-nonanal 1.2–124.3 0.999 0.060±0.000 −0.088 100.0
1549 Benzaldehyde 0.6–381.4 0.995 0.033±0.000 −0.006 99.4
1674 Phenylethanal 1.3–586.7 0.989 0.118±0.000 −0.151 100.0
Furan compounds
1494 2-Furfural 2.8–310.6 0.987 0.179±0.002 −0.512 98.7
1599 5-Methyl-2-furfural 1.1–286 0.992 0.128±0.003 −0.319 97.7
Sulphur compounds
1748 Methionol 1.2–297.2 0.983 0.865±0.004 −1.183 99.6
Volatile phenols
1894 2-methoxyphenol 5.6–1400 0.983 0.090±0.001 −1.428 99.1
2023 Phenol 1.1–38.4 0.986 0.033±0.002 −0.039 95.2
2118 Eugenol 0.5–127.2 0.991 0.028±0.036 −0.424 86.9
2143 4-Ethylphenol 2.4–360 0.982 0.005±0.000 −0.015 100.0
Table 2
Performance characteristics of the liquid–liquid extraction method. Detection (LOD) and quantification (LOQ) limits, recoveries and yield extraction data
Compounds LOD (mg l−1) LOQ (mg l−1) %Recovery R.S.D. (%) %Yield extraction
Terpenes
-Citronellal 0.008 0.028 43.5 7.2 99.9
Linalool 0.008 0.028 51.6 4.6 91.1
␣-Terpineol 0.003 0.011 73.9 5.3 100.7
Nerol 0.002 0.007 45.1 2.9 99.9
-Damascenone 0.022 0.072 60.3 2.1 103.7
Geraniol 0.011 0.038 54.2 3.5 102.1
(E)-Nerolidol 0.021 0.011 49.9 6.2 106.4
Higher alcohols
Butan-1-ol 0.087 0.290 56.6 5.1 103.9
3-Methylbutan-1-ol 0.534 1.780 73.9 0.7 103.6
Hexan-2-ol 0.127 0.374 68.6 3.2 102.4
Hexan-1-ol 0.104 0.348 112.8 1.1 101.5
(E)-3-hexen-1-ol 0.003 0.010 80.5 4.3 101.2
(Z)-2-hexen-1-ol 0.003 0.009 81.2 10.6 101.0
2-Ethyl hexan-1-ol 0.057 0.190 75.2 4.9 104.5
(R,S)-Butan-2,3-diol 0.196 0.653 42.9 6.7 95.8
Propan-2-ol 0.041 0.135 55.6 2.7 98.4
2-Phenylethanol 0.095 0.317 76.3 0.9 97.4
2-Phenoxyethanol 0.414 1.378 52.7 2.9 101.8
Acetates
Phenylethyl acetate 0.047 0.157 76.9 1.4 100.6
Isoamly acetate 0.038 0.126 81.8 3.8 102.7
Ethyl esters
Ethyl butyrate 0.038 0.128 84.7 9.1 102.7
Ethyl pentanoate 0.006 0.015 71.8 4.9 100.6
Ethyl hexanoate 0.037 0.123 108.7 8.5 103.0
Ethyl lactate 0.029 0.096 86.8 4.6 100.5
Ethyl octanoate 0.084 0.281 109.3 1.3 100.1
Ethyl 3-hydroxybutanoate 0.013 0.042 55.1 5.1 103.0
Ethyl decanoate 0.017 0.056 75.0 1.9 101.7
Ethyl benzoate 0.082 0.287 52.1 7.2 105.2
Ethyl 2-furoate 0.030 0.101 28.9 6.1 96.6
Ethyl succinate 0.351 1.170 93.7 7.9 103.1
Ethyl salicylate 0.215 0.682 43.4 9.4 103.4
Ethyl dodecanoate 0.024 0.081 111.6 5.3 104.0
Ethyl cinnamate 0.131 0.548 56.8 8.3 114.9
Fatty acids
Acetic acid 0.126 0.420 54.7 2.0 103.9
3-Methylbutanoic acid 0.106 0.352 88.8 4.9 93.8
Hexanoic acid 0.014 0.048 88.9 1.8 100.7
Octanoic acid 0.204 0.679 65.8 1.1 103.6
Decanoic acid 0.007 0.022 81.4 8.5 106.2
Phenylacetic acid 0.005 0.018 59.4 3.4 100.5
Benzoic acid 0.066 0.221 49.5 1.5 105.6
Carbonyl compounds
Hexanal 0.040 0.123 15.6 7.2 102.5
(Z)-2-nonanal 0.006 0.021 70.6 6.4 100.5
Benzaldehyde 0.039 0.131 67.1 1.9 119.0
Phenylethanal 0.081 0.269 103.8 4.7 98.7
Furan compounds
2-Furfural 0.051 0.171 80.3 1.3 103.1
5-Methyl-2-furfural 0.037 0.149 54.5 4.6 102.4
Sulphur compounds
Methionol 0.056 0.188 13.4 1.0 100.7
Volatile phenols
2-Methoxyphenol 0.265 0.837 48.0 6.0 103.6
Phenol 0.007 0.022 57.7 9.2 81.8
Eugenol 0.017 0.056 59.3 7.1 116.3
4-Ethylphenol 0.075 0.251 34.5 9.4 84.9
were tested in duplicate. The (volatile compound/internal stan-dard) peak area ratio was used for each compound. Calibration solutions, in the range specified inTable 1, were prepared by suitable dilution of the global solution. To calculate this calibra-tion graphs, linear least-square regression was used. For most of the compounds studied, the resulting calibration curves obtained by plotting the GC–MS response versus analyte concentration were found to have good linearity in the range of concentrations studied, with regression coefficient (r2) values ranging between 0.981 (octanoic acid) and 1.000 (ethyl octanoate). It was also corroborated by “on-line linearity” (LOL), with values higher than 85%.
The method sensitivity given by the slope of the straight cal-ibration graphs depends on extraction efficiency and detector response for each compound. With this procedure, high sensi-tivities were obtained for␣-terpineol,-citronellal, methionol and 2-phenylethanol.
The recovery percentage of the studied compounds added to TNM wine were calculated and are shown in Table 2. As expected, the range of recoveries is very wide. The results show that the compounds highly soluble in water, such as acetic acid, methionol and ethyl lactate, are poorly extracted.
The repeatability of the method was estimated by the relative standard deviation (R.S.D.) of the concentrations for six consec-utive extractions of a synthetic wine. The values obtained for this parameter ranged from 0.7% for 3-methylbutan-1-ol to 10.6% for (Z)-2-hexen-1-ol, with an average of about 4.0% for all ana-lytes considered. The limits of detection (LOD) were estimated from the area corresponding to three-fold the system noise. As presented inTable 2the obtained values ranged from 2.0g l−1 for nerol to 0.53 mg l−1for 3-methylbutan-1-ol. For the limits of quantification (LOQ) the values ranged from 9.0g l−1for (Z)-2-hexen-1-ol to 1.78 mg l−1 for ethyl 3-hydroxybutanoate (Table 2).
3.2. Identification of volatile components
The analytical method proposed allowed the correct identifi-cation and quantifiidentifi-cation over than 90 compounds in the volatile fraction of TNM red wines, the majority being higher alcohols (mainly isoamyl alcohols and (R,S)-butan-2,3-diol), ethyl esters of medium-chain fatty acids (hexanoic and octanoic acids), fatty acids, carbonyl compounds and acetates from higher alcohols. Amongst the other components present were detected several furan derivatives (5), seven lactones, the isomers of dioxanes and dioxolanes (4) and some volatile phenols. Only three sulphur-containing compounds were identified: 2-(methylthio)-ethanol, methionol and 5-ethoxythiazole.
Free volatile compounds isolated from TMN-D red wine accounted for 569.7 mg l−1), a value much higher than that obtained for the others TMN wine types, which present con-tents of 247.5, 203.1 and 205.8 mg l−1, for TMN-MD; TMN-S and TMN-MD, respectively. The results are consistent with the vinification process. The average values (mean±standard deviation) determined for the volatile compounds in TNM-D, TNM-MD, TNM-S and TNM-MS red wines from the 2003 har-vest, are present inTable 3.
3.2.1. Higher alcohols
Are quantitatively the largest group of the volatile compounds in TNM red wines. This volatile fraction is composed mainly by n-alcohols of C6chain length (related to the lipoxygenase activity of the grape) and aromatic compounds such as benzyl alcohol and 2-phenylethanol. The presence of these two com-pounds may cause a “flowery” and “sweet” notes which could be considered as a positive characteristic for TNM wines variety. The total concentration of this family of compounds calculated in the different TNM wine types analysed are shown inFig. 3.
TNM-S and TNM-MS are the wine types that show by far the lowest content of higher alcohols. The alcohol frac-tion of TNM-D is significantly different at the 95% level from the other types of TNM red wines studied. 3-Methylbutan-1-ol and (R,S)-butan-2,3-diol were markedly the most abun-dant higher alcohols, being present at levels higher than its perception threshold (30 mg l−1 for 3-methylbutan-1-ol), thus its sensorial contribution with “banana” and “alcohol, fusel” odour, is expected. Identical values of 3-methylbutan-1-ol were observed in the analysed wines from the S and TNM-MS (29.7±0.3 mg l−1), while in those from TNM-MD these values were slightly higher 61.9±0.03 mg l−1). The highest contents of 3-methylbutan-1-ol (significantly different at the 95% level) were determined in TNM-D (259.1±0.9 mg l−1). The high contents of 3-methylbutan-1ol could be justified by the higher content of the amino acid precursors of this alcohol, leucine and isoleucine [22]. The contents of 2-phenylethanol (18.0±0.9 mg l−1) were notably higher in the TNM-D wine and the other varietal alcohol, benzyl alcohol appeared in low con-centrations but were similar in all the TNM wine types (Fig. 4). The next most abundant higher alcohol in the TMN red wines is hexan-1-ol, that contributed with “herbaceous” and “vegetal” odour when its concentration surpass 8 mg l−1. The average concentration of hexan-1-ol in TNM red wines studied (8.4±0.5 mg l−1), is higher than the perception threshold thus its sensorial contribution is expected. The highest concentration of this compound was present in TNM-D wines. The obtained values were similar to those reported by Falqu´e et al.[22].
3.2.2. Ethyl esters and acetates
One of the most important groups of aroma compounds in wine are the ethyl esters of fatty acids that are produced
Table 3
Average concentration (mean±standard deviation) of volatile composition of TNM red wines from 2003 harvest
Compounds Concentration (mg l−1)a
TNM-D TNM-MD TNM-S TNM-MS
Terpenes
␣-Terpineol 0.288±0.733 0.288±0.733 0.287±0.733 0.287±0.733
Subtotal (mg l−1) 0.29 0.29 0.29 0.29
Subtotal (%) 0.05 0.12 0.14 0.14
Higher alcohols
2-Methypropan-1-olb 3.056±0.199 0.723±0.035 0.516±0.034 0.601±0.084
Butan-1-ol 2.585±0.198 2.513±0.199 2.678±0.198 2.518±0.199
3-Methylbutan-1-ol 259.09±0.881 61.974±0.028 29.476±0.112 29.951±0.110
3-Methylpentano-1,5-diolb 0.070
±0.002 0.007±0.000 0.002±0.000 0.006±0.002
␣-Phenylbenzenemethanolb 0.014
±0.002 0.006±0.000 0.014±0.001 0.021±0.006
2-Acethoxypropan-1-olb ND ND 0.003
±0.000 0.005±0.000 3-Methylpentan-1olb 0.010
±0.001 0.002±0.000 0.000±0.000 0.002±0.000
Heptan-1-olb 0.006
±0.000 0.002±0.000 0.001±0.000 0.006±0.000
Hexan-1-ol 8.779±0.466 7.604±0.473 8.366±0.468 8.685±0.467
(Z)-3-Hexen-1-olb 0.005
±0.001 0.008±0.000 0.007±0.001 0.007±0.001
3-Etoxypropan-1-olb 0.031
±0.000 0.013±0.001 0.008±0.001 0.016±0.000
(E)-3-hexen-1-ol 0.488±0.093 0.505±0.093 0.523±0.094 0.518±0.115
(Z)-2-hexen-1-ol ND 0.397±0.115 0.397±0.115 0.444±0.115
2-Ethylhexan-1-ol 0.574±0.216 0.574±0.216 0.575±0.216 0.574±0.216
(D,L)-Butan-2,3-diolb 1.264
±0.201 0.327±0.009 0.232±0.021 0.231±0.033
(R,S)-Butan-2,3-diol 104.102±3.134 40.209±3.134 34.646±3.134 38.076±3.134
Propan-2-ol 8.983±0.348 7.045±0.397 6.358±0.415 ND
2,2-Dimethylpentan-3-olb 0.030
±0.002 0.003±0.000 0.001±0.000 ND
Benzyl alcoholb 0.111
±0.003 0.224±0.007 0.106±0.008 0.107±0.008
2-Phenylethanol 18.005±0.998 11.881±1.012 9.706±1.017 9.8±1.017
Subtotal (mg l−1) 407.20 134.02 93.62 91.57
Subtotal (%) 7147 54.14 46.09 44.58
Acetates
Isoamly acetate 0.654±0.339 0.515±0.344 0.508±0.344 0.491±0.345
Hexyl acetateb 0.002±0.000 0.036±0.003 0.032±0.001 0.003±0.000
2-Phenylethyl acetate 5.09±0.113 3.182±0.113 2.993±0.113 3.07±0.113
Subtotal (mg l−1) 5.75 3.73 3.53 3.56
Subtotal (%) 1.01 1.51 1.74 1.73
Ethyl esters
Ethyl butyrate ND ND 1.372±0.444 ND
Ethyl hexanoate 2.271±0.383 1.73±0.406 1.608±0.411 1.544±0.414
Ethyl pyruvateb 0.006
±0.001 0.032±0.001 0.017±0.003 0.046±0.001
Ethyl lactate 7.206±0.135 6.855±0.142 4.051±0.196 3.088±0.215
Ethyl octanoate 54.823±7.160 32.696±6.464 30.437±6.383 29.069±6.350
Ethyl 3-hydroxybutanoate 1.706±0.228 1.674±0.229 1.659±0.230 1.66±0.223
Ethyl decanoate 0.38±0.014 0.238±0.014 0.192±0.014 0.181±0.014
Diethyl succinateb 1.049
±0.065 0.702±0.030 0.184±0.030 0.329±0.029
Ethyl pentanedioateb 0.007
±0.001 0.006±0.001 0.001±0.000 0.003±0.000
Ethyl benzeneacetateb 0.016
±0.003 0.006±0.000 0.003±0.000 0.005±0.000
Methyl 2-ethylhexanoateb 0.284
±0.019 0.193±0.030 0.073±0.014 0.060±0.001
Ethyl dodecanoate 1.318±0.116 1.236±0.116 ND ND
Ethyl 3-hydroxyhexanoateb 1.786
±0.103 1.325±0.121 1.761±0.324 3.613±0.546
Ethyl 2-furoate ND ND 2.525±0.129 6.535±0.244
Ethyl succinate 30.079±1.659 28.867±1.678 27.056±1.683 27.562±1.679
Subtotal (mg l−1) 100.93 75.56 70.94 73.70
Subtotal (%) 17.72 30.52 34.93 35.88
Fatty acids
Acetic acid 27.101±2.673 14.388±3.017 14.995±3.000 14.492±3.014
Propanoic acidb ND 0.031
±0.001 0.002±0.000 ND
2-Methylpropanoic acidb 0.160
±0.019 0.045±0.002 0.043±0.003 0.822±0.014
Butanoic acidb 0.040
±0.001 0.022±0.002 0.022±0.007 0.019±0.001
Table 3 (Continued)
Compounds Concentration (mg l−1)a
TNM-D TNM-MD TNM-S TNM-MS
Hexanoic acid 1.625±0.208 1.535±0.208 1.502±0.208 1.486±0.208
(E)-Hex-2-enoic acid 0.001±0.000 0.003±0.000 0.010±0.000 0.006±0.002
Octanoic acid 9.076±0.543 6.654±0.551 5.911±0.551 5.843±0.554
Decanoic acid 1.607±0.080 0.098±0.080 0.507±0.080 0.565±0.080
␣-Hydroxyphenylpropanoic acidb 0.200±0.008 0.064±0.002 0.021±0.003 0.031±0.009
2-Furancarboxilic acidb 0.022±0.002 0.021±0.001 0.023±0.004 ND
Dodecanoic acidb 0.021±0.002 0.030±0.001 ND ND
Phenylacetic acid 1.188±0.538 1.161±0.539 1.033±0.554 1.046±0.542
Subtotal (mg l−1) 42.87 24.92 24.95 25.07
Subtotal (%) 7.53 10.07 12.29 12.21
Carbonyl compounds
P-aldehydeb 0.038
±0.009 0.097±0.016 0.228±0.012 0.701±0.020
Benzaldehyde 6.649±0.104 1.35±0.138 2.742±0.129 4.07±0.120
Phenylethanal 1.611±0.039 1.28±0.039 1.358±0.039 1.573±0.039
5-Methylheptan-2-oneb 0.331
±0.012 0.010±0.000 0.230±0.073 0.567±0.070
3-Penten-2-oneb 0.000
±0.000 ND 0.007±0.002 0.004±0.000
5-Methoxypentan-2-oneb 0.002
±0.000 0.003±0.000 0.041±0.003 0.011±0.002
2-Hydroxypentan-3-oneb 0.010
±0.003 0.008±0.001 0.009±0.001 0.018±0.005
5-Acethoxypentan-3-oneb 0.008
±0.001 0.066±0.002 0.041±0.003 0.032±0.002
Cyclopentanoneb 0.015
±0.003 0.045±0.017 0.066±0.012 0.119±0.031
N-ethyl acetamideb 0.004
±0.000 0.002±0.000 ND ND
N-(3-Methylbutyl) acetamideb 0.083
±0.007 0.059±0.001 0.009±0.001 0.024±0.003
(N,N)-ethylphenyl acetamideb 0.020
±0.006 0.030±0.001 ND ND
Subtotal (mg l−1) 8.77 2.95 4.73 7.12
Subtotal (%) 1.54 1.19 2.33 3.46
Lactonesb
Butalactone 0.001±0.000 0.003±0.000 0.000±0.000 0.000±0.000
Pantolactone 0.032±0.002 0.017±0.001 0.012±0.003 0.019±0.004
␥-Hexalactone 0.010±0.002 0.001±0.0030 0.000±0.000 0.001±0.000
␥-Octalactone 0.511±0.116 0.098±0.010 0.065±0.018 0.102±0.021
␥-Nonalactone 0.317±0.087 0.144±0.007 0.063±0.010 0.084±0.023
␥-Decalactone 0.001±0.000 0.001±0.000 ND 0.001±0.000
THMP 0.001±0.000 0.000±0.000 0.005±0.001 0.009±0.000
Subtotal (mg l−1) 0.87 0.26 0.15 0.21
Subtotal (%) 0.15 0.11 0.07 0.10
Acetalsb
cis-Dioxane 0.040±0.000 0.021±0.002 0.031±0.002 0.048±0.008
1,1-Diethoxyethane 0.004±0.001 0.003±0.000 0.006±0.001 0.003±0.000
cis-Dioxolane 0.017±0.001 0.034±0.001 0.029±0.006 0.034±0.004
trans-Dioxane 0.014±0.001 0.008±0.001 0.013±0.001 0.023±0.005
Subtotal (mg l−1) 0.08 0.07 0.08 0.11
Subtotal (%) 0.01 0.03 0.05 0.05
Furan compounds
2-Furfural 2.89±0.346 2.92±0.345 2.961±0.345 3.015±0.344
5-Ethyl hydro-2(3H)-furanoneb ND 0.005
±0.000 ND 0.006±0.002
5-Ethoxydihydro-2(3H)-furanoneb ND 0.010
±0.001 0.010±0.001 0.127±0.024
5-Methyl-2-furancarboxaldehydeb ND ND 0.001
±0.000 0.006±0.001
HMF ND 0.064±0.004 0.065±0.013 0.127±0.024
Subtotal (mg l−1) 2.89 3.00 3.04 3.28
Subtotal (%) 0.51 1.21 1.49 1.59
Sulfur compounds
2-(Methylthio)-ethanolb 0.005±0.001 0.002±0.000 0.001±0.000 0.001±0.000
Methionol 1.623±0.306 1.439±0.306 1.385±0.307 1.384±0.307
5-Ethoxythiazoleb 0.103
±0.005 0.010±0.001 0.007±0.001 0.015±0.001
Subtotal (mg l−1) 1.73 1.45 1.39 1.40
Table 3 (Continued)
Compounds Concentration (mg l−1)a
TNM-D TNM-MD TNM-S TNM-MS
Volatile phenols
Phenol 1.254±0.145 1.269±0.144 1.237±0.145 ND
Vanillin ND 3.008±1.015 2.19±1.117 2.356±1.096
Acetovanillinb 0.005
±0.002 0.015±0.000 0.001±0.000 ND
Subtotal (mg l−1) 1.26 4.29 3.43 2.36
Subtotal (%) 0.22 1.73 1.68 1.15
Total (mg l−1) 569.75 247.54 203.10 205.38
ND: not detected; THMP: tetrahydro-4-hydroxy-4-methyl-2-H-pyran-2-one; HMF: 5-hydroxymethyl-2-furfural. aMean of 12 extraction replicates.
b Concentration determined by the equationC
x=n×Cis, whereCxis the concentration ofxcompound,nthe relative peak area andCisis the internal standard concentration in the sample.
matically during yeast fermentation and from ethanolysis of acylCoA that is formed during fatty acids synthesis or degrada-tion. Their concentration is dependent on several factors mainly: yeast strain, fermentation temperature, aeration degree and sugar contents. These compounds make a positive contribution to the general quality of wine being responsible for their “fruity” and “floral” sensory properties. The TNM-S wines showed the low-est concentration of ethyl low-esters of fatty acids (6–10 carbon atoms). The maximum values for all the ethyl esters were found for TNM-D and TNM-MD, being higher than the respective TNM-MS. With exception of the TNM-D wines, the concentra-tion of ethyl esters in the different types of studied wines was reasonably constant and the differences were not significant. Between the ethylic esters that it has been possible to identify, ethyl esters of C6and C8fatty acids, which are responsible for the “fruity” and “wine-like” aroma, hexanoate and octanoate, were those found at the highest concentrations in the TNM analysed wines. They have similar concentrations with exception for ethyl octanoate determined in TNM-D wines (significantly different at the 95% level), and are present at concentrations exceeding their flavour threshold (Table 4). From the ethyl esters of diprotic acids, the concentration of diethyl succinate (28.4±1.3 mg l−1) is much higher than that found for ethyl lactate (Table 3). Iden-tical concentrations of diethyl succinate were observed in all the analysed TNM wines (Table 3). The concentration of ethyl lac-tate in TNM-D and TNM-MD was higher than that determined
Fig. 4. Total concentration of the minor chemical classes of volatile composi-tion (ACET: acetates from higher alcohols; L: lactones; Ac: acetals; FC: furan compounds; SC: sulphur compounds; P: volatile phenols) determined in TNM red wines (D: dry; MD: medium dry; S: sweet; MS: medium sweet).
in the TNM-S and TNM-MS red wines.Fig. 3compare the total concentration of the ethyl esters of fatty acids in the different TNM wine types analysed.
3.2.3. Acetates
Are the result of the reaction of acetylCoA with higher alco-hols that are formed from degradation of amino acids or carbohy-drates. Isoamyl acetate with a characteristic odour of “banana”, was found at similar values in different TNM wine types and above its perception threshold (30g l−1) in all the samples with an average content of about 0.54±0.08 mg l−1. The concentra-tion of 2-phenylethyl acetate determined in TNM-D, which give “roses, flowery, honey” nuances to the wine, was significantly different at the 95% level, from the determined in TNM-MD, TNM-S and TNM-MS wines.
3.2.4. Fatty acids
Within the family of fatty acids (Table 3), acetic, hexanoic and octanoic acids were notable for their higher concentrations. Acetic acid was markedly the most abundant acid, being present at levels lower than its perception threshold (200 mg l−1). The TNM-D wine, present the highest concentration of these com-pounds (42.9 mg l−1). The fatty acids concentration in the TNM-MD, TNM-S and TNM-MS red wines were not significantly different at the 95% level. The contents of hexanoic, octanoic and decanoic acids although high, showing values of 1.5, 6.9 and 0.7 mg l−1, respectively, were in agreement with those found for other wine varieties.Fig. 3shows the total concentration of these compounds in the different TNM wine types analysed.
3.2.5. Carbonyl compounds
TNM-Table 4
Odour descriptor, odour threshold (LOP) and aroma index (I) of the main odorants found in TNM red wines Compounds Odour descriptora LOP (mg l−1)a Aroma index (I)
TNM-D TNM-MD TNM-S TNM-MS
Ethyl butyrate Fruity, apple 0.02 ND ND 68.6 ND
2-Methylpropan-1-ol Bitter, green, harsh 0.2 15.3 3.6 2.6 3.0
Phenylethyl acetate Roses, flowery 0.25 20.4 12.7 12.0 12.3
3-Methylbutan-1-ol Alcohol, fusel 30.0 8.6 2.1 1.0 1.0
Ethyl hexanoate Green apple, anise 0.014 162.2 123.5 114.9 110.3
Hexan-1-ol Green, grass 8.0 1.1 1.0 1.0 1.1
Ethyl octanoate Sweet, fruity, fresh 0.005 10964.6 6539.1 6087.5 5813.8
Benzaldehyde Bitter, cherry 2.0 3.3 0.7 1.4 2.0
3-Methylbutanoic acid Cheese, fatty, rancid 0.0334 54.8 27.0 26.5 22.8
Ethyl decanoate Pleasant, soap 0.2 1.9 1.2 1.0 0.9
Phenylethanal Flowery, rose, honey 0.005 322.1 256.0 271.6 314.6
Ethyl succinate Wine 6.0 5.0 4.8 4.5 4.6
␣-Terpineol Piney, iris, teil 0.11 2.6 2.6 2.6 2.6
Methionol Baked cabbage 1.0 1.6 1.4 1.4 1.4
Isoamly acetate Banana 0.03 21.8 17.2 16.9 16.4
Hexanoic acid Fatty acid, cheese 0.42 3.9 3.7 3.6 3.5
Octanoic acid Fatty acid, rancid 0.5 18.2 13.3 11.8 11.7
2-Phenylethanol Roses, sweet 14.0 1.3 0.8 0.7 0.7
␥-Nonalactone Coconut 0.03 10.6 4.8 2.1 2.8
Vanillin Vanilla, candy 0.2 ND 15.0 10.9 11.8
Decanoic acid Fatty, rancid, soap 1.0 1.6 0.1 0.5 0.6
Phenylacetic acid Honey, pollen, flowery 2.5 1.2 1.2 1.0 1.0
ND: not detected.
aOdour descriptor and odour threshold reported in the literature[14–22].
MS wines, with exception for benzaldehyde in TNM-D wines whose concentration is significantly different at the 95% level. The ketones can be formed by condensation of activated fatty acids. The most important in the TNM analysed wines are cyclopentanone.
3.2.6. Furan compounds
Another group of aroma compound that have been studied were the furanic compounds, formed by degradation of carbo-hydrates. The major components in this group were 2-furfural and 5-hydroxymethyl-2-furfural (HMF). Furfural was the most abundant compound (Table 4) but is present at levels lower than its perception threshold. The average values for the different TNM wine types are similar (not significantly different at the 95% level).
3.2.7. Lactones
Seven lactones were identified. These compounds are among the most important to the sensory characteristics of wines namely when aged in oak wood. These compounds are formed by cyclization of the corresponding␥-hydroxycarboxylic acids. The odour of these lactones depends on the chemical struc-ture, functional groups and the length of side chains. The odour of these compounds are described as being “fruity” and in some cases as “coconut-like; fruity” (␥-hexalactone); “coconut-like” (␥-octalactone); “peach-like, milky” (␥-decalactone) and “fruity, sweet floral” (␥-dodecalactone). ␥-Octalactone is the most abundant lactone in TNM-D (58.5%), TNM-S (44.8%), TNM-MS (49.3%) red wines and␥-nonalactone is the most rep-resentative of TNM-MD (54.5%) wine.
3.2.8. Sulphur compounds
Comprise a structurally diverse class of molecules that a whole range of aromatic notes, generally considered detrimental to wine quality[23]. Most of the sulphur compounds identified in wines are usually found at level below their threshold values. The main sulphur compound identified in TNM red wines was 3-(methylthio)-propan-1-ol (methionol). This is usually found at levels above its olfactive perception threshold value. The anal-ysis of TNM red wines (Table 3) showed that the highest con-centration of sulphur compounds was observed for methionol in TNM-D wine.
3.2.9. Volatile phenols
These compounds detected in different wine samples, can originate from p-coumaric and ferulic acids by decarboxyla-tion. Within the family of volatile phenols (Table 3) vanillin was notable for their higher concentrations. Its content exceed their flavour threshold contributing with “vanilla” and “candy” odours to the TNM wines (Table 4).
3.3. Identification of the main odorants
concen-trations higher than their corresponding odour thresholds. Thus these compounds exhibit an aroma index value higher than the unity were considered to contribute individually to the TNM wine aroma.
There was a great similarity among the intensities of these odorants in the different of TNM red wine samples. According to the results presented in Table 4, the five most potent aro-mas of each wine type are practically the same. The highest Ivalues were obtained for several well-known by-products of yeast metabolism such as ethyl octanoate, ethyl hexanoate and their corresponding fatty acids; isoamyl acetate; 2-phenylethyl acetate, phenylethanal; 3-methylbutanoic acid; the higher alco-hols 2-methylpropan-1-ol and 3-methylbutan-1-ol; metionol and
␥-nonalactone and seems to be important odorants of this wine. Diethyl succinate, phenylacetic acid, 2-phenylathanol and hexan-1-ol were also at concentrations higher than their corre-sponding threshold. The relevant content of vanillin, associated with “vanilla” and “chocolate” odour descriptors, with I val-ues higher than 10 for TNM-MD, TNM-S and TNM-MS wines, should be considered to have a sensorial contribution for these red wines.
4. Conclusions
TNM red wines are characterized by the presence of higher levels of higher alcohols, ethyl esters and acetates, fatty acids, carbonyl compounds and sulphur compounds. The TNM-MD shows the highest values of volatile phenols. In contrast, they have the lowest contents of acetals. The highest values of furan compounds and acetals were determined in TNM-S wines. These wines present the lowest concentrations of higher alcohols. TNM-MS shows the lowest values of acetates, lactones and sul-phur compounds.
Quantitatively, the higher alcohols (aliphatic and aromatic) are the largest group of the volatile composition in the TNM red wine. The ethyl esters and fatty acids formed enzymat-ically during the fermentation process constitute important groups of aroma compounds that contribute with “fruity” and “cheese/fatty” notes to wine sensory properties, respectively. The dominating esters are the ethyl esters of fatty acids and acetates of higher alcohols. Ethyl octanoate and ethyl hexanoate predominated in TNM red wines analysed.
From all compound identified in TNM red wines, ethyl octanoate, phenylethanal, ethyl hexanoate, isoamyl acetate, octanoic acid and 2-phenylethyl acetate are the most powerfull
odorants. The proposed methodology seems to be adequate to establish the potentially most important wine odorants of TNM wines.
Acknowledgments
The authors are grateful to Instituto do Vinho Madeira and Madeira Wine Company for the supply of the samples used in this study.
References
[1] J.S. Cˆamara, P. Herbert, J.C. Marques, M.A. Alves, Anal. Chim. Acta 513 (2004) 203.
[2] J.S. Cˆamara, J.C. Marques, M.A. Alves, A. Silva Ferreira, J. Agric. Food Chem. 52 (2004) 6765.
[3] M.A. Pozo-Bay´on, E. Pueyo, P.J. Mart´ın- ´Alvarez, M.C. Polo, J. Chro-matogr. A 922 (2001) 267.
[4] R. Castro, P. Natera, P. Benitez, C.G. Barroso, Anal. Chim. Acta 513 (2004) 141.
[5] C. Ortega, R. L´opez, J. Cacho, V. Ferreira, J. Chromatogr. A 923 (2001) 205.
[6] V. Ferreira, R. L´opez, A. Escudero, J. Cacho, J. Chromatogr. A 806 (1998) 349.
[7] M.G. Chisholm, L.A. Guiher, S.M. Zaczkiewicz, Am. J. Enol. Vitic. 46 (1) (1995) 56.
[8] V. Ferreira, N. Ortin, A. Escudero, R. Lopez, J. Cacho, J. Agric. Food Chem. 50 (2002) 4048.
[9] H. Guth, J. Agric. Food Chem. 45 (1997) 3027.
[10] S.M. Rocha, F. Rodrigues, P. Coutinho, I. Delgadilho, M.A. Coimbra, Anal. Chim. Acta 513 (2001) 257.
[11] S. Nakamura, E.A. Crowell, C.S. Ough, A. Totsuka, J. Food Sci. 53 (1988) 1243.
[12] V. Ferreira, R. L´opez, J. Cacho, J. Sci. Food Agric. 80 (2000) 1659. [13] Y. Kotseridis, R. Baumes, J. Agric. Food Chem. 48 (2000) 400. [14] K. Wada, T. Shibamoto, J. Agric. Food Chem. 45 (1997) 4362. [15] V. Ferreira, A. Rapp, J. Cacho, H. Hastrich, I. Yavas, J. Agric. Food
Chem. 41 (1993) 1413.
[16] J.M. Nu˜nez, H. Bemelmans, J. Chromatogr. 294 (1984) 361.
[17] R. L´opez, M. Aznar, J. Cacho, V. Ferreira, J. Chromatogr. A 966 (2002) 166.
[18] G.P. Blanch, G. Reglero, M. Herraiz, J. Agric. Food Chem. 43 (1995) 1251.
[19] A. Razungles, H. Tarhi, R. Baumes, C. G¨unata, C. Tapiero, C. Bayon-nove, Sci. Aliment 14 (1993) 59.
[20] C. Cocito, G. Gaetano, C. Delfini, Food Chem. 52 (1995) 311. [21] J. Marais, S. Afric, J. Enol. Vitic. 7 (1986) 21.
[22] E. Falqu´e, E. Fern´andez, D. Dubourque, J. Agric. Food Chem. 50 (2002) 538.