THIS
DOCUMENT
IS
NOT
AN
INVESTMENT
RECOMMENDATION
AND
SHALL
BE
USED
EXCLUSIVELY
FOR
ACADEMIC
PURPOSES
(SEE DISCLOSURES AND DISCLAIMERS AT END OF DOCUMENT)See more information at WWW.NOVASBE.PT Page 1/30
M
M
M
A
A
A
S
S
S
T
T
T
E
E
E
R
R
R
S
S
S
I
I
I
N
N
N
F
F
F
I
I
I
N
N
N
A
A
A
N
N
N
C
C
C
E
E
E
E
E
E
Q
Q
Q
U
U
U
I
I
I
T
T
T
Y
Y
Y
R
R
R
E
E
E
S
S
S
E
E
E
A
A
A
R
R
R
C
C
C
H
H
H
Our recommendation for Galp Energia is buy with FY11 target price of €17.08 per share, as we believe in the huge potential of the upstream.
After discussing the company goals for the E&P segment we estimated the capital expenditures and technical challenges relating to the development of recent oil discoveries. We identified great potential value, although we also noticed considerable sensitivity to the crude oil prices.
Conversion project aims to increase refining margins taking advantage of higher diesel crack spread and European diesel deficit. But there are concerns about increasing competition from the Asian and Middle East refiners.
Marketing of oil products activity remains stable despite sales contraction as result of the economic downturn in the Iberian Peninsula.
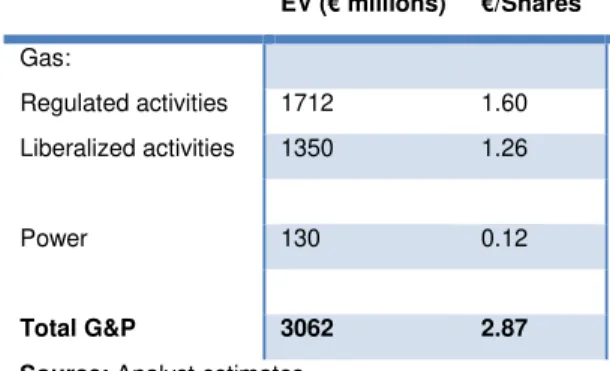
G&P is a source of stable cash flow through the regulated activity. New challenges are coming as the Iberian natural gas market is the liberalization.
At last after securing enough funds to meet up with it commitments in Brazil, the company will be able sustain an attractive growth.
Company description
Galp Energia is a Portuguese Oil & Gas company, which operational activity includes production, refining and marketing of oil. It also supply and distributes natural gas in the Iberian Peninsula.
GALP
ENERGIA
C
OMPANY
R
EPORT
OIL
&
GAS
6
J
UNE2011
S
TUDENT
:
K
EHINDE
R
ITA
F
AWOLE
mst16000273@novasbe.pt
Funding the growth
Capitalizing upstream in a challenging environment
Recommendation: BUY
Price Target FY11: 17.08 €
Price (as of 6-Jun-11) 14.73 €
Reuters: GALP.LP, Bloomberg: GALP PL
52-week range (€) 15.91-11.55
Market Cap (€m) 12,214.860
Outstanding Shares (m) 829.250
Source: Bloomberg and analyst estimates
Source: Bloomberg
(Values in € millions) 2010 2011E 2012F
Revenues 14,185 14,327 15,044
EBITDA 1,053 1,012 1,387
EBITDA margin 7% 7% 9%
Operating profit 630 578 916
Operating profit margin 4% 3% 5%
Net income 441 70 257
EPS 0.53 0.08 0.31
Source: Bloomberg and analyst estimates 94
96 98 100 102 104 106 108 110
Jan-11 Fev-11 Mar-11 Abr-11 Mai-11
GALP ENERGIA VS PSI 20
“GALPENERGIA” COMPANY REPORT
THIS
DOCUMENT
IS
NOT
AN
INVESTMENT
RECOMMENDATION
AND
SHALL
BE
USED
EXCLUSIVELY
FOR
ACADEMIC
PURPOSES
(SEE DISCLOSURES AND DISCLAIMERS AT END OF DOCUMENT)PAGE 2/30
Table of Contents
COMPANY OVERVIEW ... 3
COMPANY DESCRIPTION ... 3
SHAREHOLDER STRUCTURE ... 3
THE SEGMENT ... 4
EXPLORATION AND PRODUCTION ... 4
Market environment ... 4
Galp Energia in the upstream of the industry ... 6
Angola ... 6
Brazil ... 7
Capital expenditures ... 8
Valuation ... 9
Sensitivity analyses... 10
REFINING AND MARKETING ... 10
Galp Energia in the Iberian Context ... 12
European refining industry ... 12
Galp Energia refining margins ... 13
Conversion project ... 14
Iberian marketing activities ... 16
Valuation ... 16
Sensitivity analyses... 17
GAS AND POWER ... 18
Market environment ... 18
Galp Energia in Natural Gas ... 19
Power ... 21
Valuation ... 21
Sensitivity analyses... 22
SUM-OF-THE-PARTS ...22
Sensitivity analyses... 24
FINANCIAL STATEMENTS ...28
APPENDIX ...29
“GALPENERGIA”
THIS
DOCUMENT
IS
NOT
AN
EXCLUSIVELY
FOR
ACADEM
Comp
C
Oil and G processes upstream recovery characteri distributio Founded and Gás Portugues and gas s company Production The com participate the comin G&P segm Peninsula wholesale storage o subsidiarie of electric In 2010 G previous y profit with of the com major pro its largest Brasil.
S
Figure 1: Galp Energia value chain
Source: Galp Energia Galp Energia E&P Exploration Marketing R&M Refining Marketing G&P Natural Gas Power
Figure 2: Galp’s 2010 operational profit
Source: Galp Energia
14%
43% 41%
2%
E&P R&M G&P Others
Uptream will deliver Galp Energia growth
COMPANY REPORT
AN
INVESTMENT
RECOMMENDATION
AND
EMIC
PURPOSES
(SEE DISCLOSURES AND DISCLAIMERmpany overview
Company description
Gas industry is composed by many activities tha ses and risks within its value chain. Nevertheles m activity that is commonly used to refer to the ry and production of crude oil and natural gas, terize activities such as the refining of crude oil tion of natural gas and products derived from crude d in April 1999 with the merger between Petróleos ás de Portugal (GDP) at the time as part of
ese energy sector, Galp Energia is a major integra s sector, it is present in every part of the value cha ny operations are divided in three business segm tion (E&P); Refining and Marketing (R&M); and Gas mpany upstream activity takes place in the E& ates in projects that will be delivering most of the va ing years. Galp Energia downstream activity is m gments. In R&M the company markets the crude o ula transformed in its refineries, through its network ale. Finally in the G&P segment Galp’s activity c of Natural Gas, the supply, and regulated d aries. Regarding power activities are limited to the
ricity.
Galp Energia had an operating profit of €454 mil s year. The R&M segment was the biggest contr ith 46%, and then followed by G&P and E&P. Curr company are in the E&P and R&M segments. In roject is the conversion of its refinery in Portugal, a est project is Tômbua-Lândana project in Angola, a
Shareholder structure
RT
D
SHALL
BE
USED
ERS AT END OF DOCUMENT)
PAGE 3/30 that involve very different less we can identify the e searching for and the , and downstream that oil, and the selling and de oil.
os de Portugal (Petrogal) f a restructuring of the grated company in the oil chain of the industry. The gments: Exploration and
as and Power (G&P). E&P segment, where it value of the company, in s made by the R&M and oil product in the Iberian orks of service stations or comprises the sourcing distribution through its he production and trading
“GALPENERGIA” COMPANY REPORT
THIS
DOCUMENT
IS
NOT
AN
INVESTMENT
RECOMMENDATION
AND
SHALL
BE
USED
EXCLUSIVELY
FOR
ACADEMIC
PURPOSES
(SEE DISCLOSURES AND DISCLAIMERS AT END OF DOCUMENT)PAGE 4/30 Galp Energia has two main shareholders that is Amorim Energia and Eni, each with 33.34% of the company’s stocks. The second main shareholder is the portuguese state that controls 7% through Parpública and 1% indirectely through Caixa Geral dos Depósitos (CGD). The remaining capital is free float, in which 80% is controlled by institutional investors, from which 78% are international. It is important to remind that Angolan state-owned oil company (Sonangol) controls 45% of Amorim Energia’s equity through a company called Esperanza Holding BV.
Amorim Energia, CGD and Eni are parties to an agreement that governs several issues regarding the transfer of the shares they own in Galp Energia, in which they must keep their holdings for a lock-in period up to and including 31 December 2010.
Until now there is not any a new agreement, partially due to the intention of selling its position announced by ENI. Also there are divergences between the shareholders over the renewal of the actual administration mandate, which already expired last year. Those facts leaded to the successive postponement of the shareholder general assembly that finally took place at May 30.
However the general assembly didn’t deliberate anything about the administration of the company, since one of the main shareholder (Portuguese Government) wasn’t in condition to assume any decision, because at that time it was a caretaker government.
The Segment
Exploration and Production
Market environment
Oil has been the world’s most important source of energy for many years, meeting almost 35% of global energy needs in 2009. Since the beginning of this year the industry is being in turmoil, as result of the political and social unrest in North Africa and Middle East region. These regions in turmoil accounts for about 43% of the world oil supply. This outstanding threat to the supply of the crude to the market has caused, a rise of oil price putting brent in levels above $120 per barrel.
Despite economic growth, oil demand growth is expected to slow in the coming years due to a continued structural shift away from oil in the OECD to other
Figure 4: Production of oil by region (thousand barrels per day)
Source: BP statistical review of the world 2010 12% 10% 22% 31% 17% 8% Africa Asia Pacific Europe & Eurasia Middle East N. America S. & C. America
Figure 3: Galp’s shareholder structure
Source: Galp Energia
34% 33% 7% 1% 25% Eni Amorim Energia Parpública CGD Free Float
Graph 1: Brent crude oil price
Source: Blomberg
“GALPENERGIA” COMPANY REPORT
THIS
DOCUMENT
IS
NOT
AN
INVESTMENT
RECOMMENDATION
AND
SHALL
BE
USED
EXCLUSIVELY
FOR
ACADEMIC
PURPOSES
(SEE DISCLOSURES AND DISCLAIMERS AT END OF DOCUMENT)PAGE 5/30 source cleaner energy, and improving end-use efficiency. However increase of demand is expected to come by rising demand in emerging countries, mainly China, Brazil, India and the Middle East. Therefore we expect oil demand to rise from the level of 86.7 mbbl/day in 2010, to around 122 mbbl/day by the year of 2030.
Over the last couple of decades, deepwater has rapidly become an important part of the world’s oil supply, having risen from 2% in 2000 to 5% in 2009 of total world oil production, and is expected to be 25% of World supply in 2030. Since 2000, 40% of discovered reserves have been in deepwater, looking forward there is also significant future potential for deepwater production, mainly in Brazil and West Africa, where recently large reserves were find.
Thought that the technical challenges concerning to deepwater development are numerous and range from simply having a rig able to hold its station in 2000m of water to ensure subsea valves, pumps, electrical and hydraulic equipment can work nonstop for more than 20 years at close to 0°C whilst under 3000psi of external pressure.
Although with the increased interest in developing deepwater resources, deepwater remains a very risky, complex end of the oil field development spectrum that could result in a disaster like last year USA, BP Deepwater Horizon drilling rig explosion and the subsequent oil spill, which economic effect in the industry is yet to be seen.
Nevertheless these effects are expected to assume terms, such as new regulations, improved emergency response measures, new business models and additional, which is hard to quantify at this moment, due to the uncertainty over the form the new regulation that will take place. Nonetheless we can anticipate that the impact on overall deepwater production will only be limited in the short-term. In the long-term, it can be anticipated that any new regulations will become
Figure x: World oil deepwater production by contries
Source: OPEP World oil outlook 2010
Brazil 26%
US (Gulf of Mexico)
22% Angola
15% Nigeria
12% India
6% Egypt
5% Norway
5%
Others 9%
Graph 2: World and GDP and oil demand cumulative growth
Source: IMF, BP statistical review of the world and analyst estimates
0 1 2 3
1990 2010 2030E World GDP
World oil demand
“GALPENERGIA” COMPANY REPORT
THIS
DOCUMENT
IS
NOT
AN
INVESTMENT
RECOMMENDATION
AND
SHALL
BE
USED
EXCLUSIVELY
FOR
ACADEMIC
PURPOSES
(SEE DISCLOSURES AND DISCLAIMERS AT END OF DOCUMENT)PAGE 6/30 routine practice, new technologies are expected continue to improve project economics and the oil and gas industry.
Galp Energia in the upstream of the industry
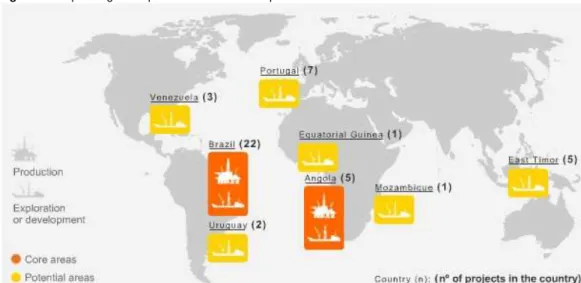
Galp Energia ultimate objective in this segment is to produce around 200 kboepd1, by the year of 2020. In order to achieve this objective the company counts with a portfolio of more than 40 projects all over the world. In 2010 Galp had 2,550 million barrels of oil equivalent in prospective resources2.
In spite of participating in more than 40 projects, the company is only taking its first steps as operator in two smaller-sized onshore projects. The company’s production objectives will be sustained by the core areas, namely Angola and Brazil, where the Galp is effectively producing, and where its prospective resources are laid underneath.
As for the areas in the rest of the countries there are in the phase of exploration, where the company is still acquiring and making the appraisal 2D and 3D seismic data, and performing drilling for further assessment. Which makes it very dificult to precise what value could be delivered from those areas, so our attention will be in the core areas, where actually there is potential value to be delivered.
Angola
Galp Energia is present in Angola since 1982, where it made over 12 discoveries in Block 14, and 13 discoveries in Block 32 and Block 33. However Block 14 is the only producing block, with three producing fields namely Kuito (since 1999),
1
Thousands barrels of oil equivalent per day
2
Prospective resources mean estimate unrisked
Figure 5: Galp Energia's Exploration & Production portfolio
Source: Galp Energia
Graph 3: Galp’s prospective resources
Source: Galp Energia
1640
2550
2009 2010
Graph 4: Galp oil production estimates
Source: Galp Energia and Analyst estimates
0 100 200 300 400
2010 2020 2030
Table 1: Galp Energia blocks in Angola
Block % Galp Energia Operator
14 9.00% Chevron
14k 4.50% Chevron
32 5.00% Total
33 5.33% Total
Source: Galp Energia
“GALPENERGIA” COMPANY REPORT
THIS
DOCUMENT
IS
NOT
AN
INVESTMENT
RECOMMENDATION
AND
SHALL
BE
USED
EXCLUSIVELY
FOR
ACADEMIC
PURPOSES
(SEE DISCLOSURES AND DISCLAIMERS AT END OF DOCUMENT)PAGE 7/30 BBLT3 (since 2005) and Tômbua-Lândana (since 2009). Currently Galp Energia major project in Angola is Tômbua-Lândana, that is expect to achieve its peak of 1004 kpoepd in the current year, after Tômbua south subsea center is fully tied back to Tômbua-Lândana CPT5.
The future development plan for Block 14 and 14k, will take place in five areas: Malange, Gabela, Lucapa, Negageand and Lianzi. The plan for both Malange and Lucapa, will consist in construction of sub-sea centres in both areas and a subsequent tie-back to the operating BBLT CPT. Lucapa and Malange area are expected to have its contractual first oil in 2016. As for the remaining areas is not expected to take place before 2018.
As mentioned before there were 13 discoveries in the Block 32 and 33 areas, from which 12 potential development areas in the block 32 were identified and submitted to the concessionaire. Currently it is in the stage of pre-development with the concept of Kaombo “Split Hub”. The concept consists in the deployment of two FPSO6 to support six development areas with an aggregated capacity of 200 kbopd. The first oil date staged per FPSO is expected by 2016 and 2017. Finally we estimate that the company’s production in Angola to increase from 2016 as major areas in Block 14 and 32 start producing, and achieve its peak at 2019, when production reaches 47 kboepd, to start declining slowly as currently producing field mature. Our estimate is presented in the graph 5.
Brazil
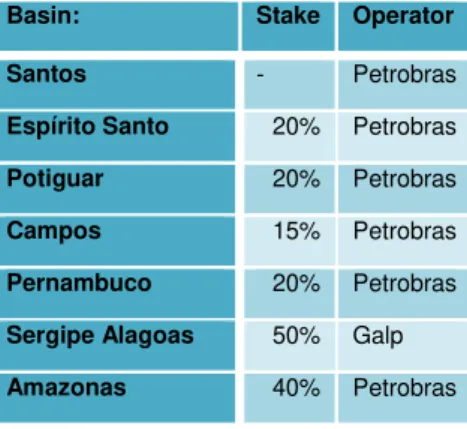
Brazilian assets accounted for 90% of contingent resources of Galp Energia at the end of 2010. In partnership with Brazilian oil operator Petrobras, Galp is participating in 22 projects, 17 offshore and five onshore spread over seven Brazilian basins. Most of the basins in which Galp operates are located offshore, excluding Sergipe Alagoas basin, Amazonas basin and 14 blocks in Potiguar basin that is located onshore.
Current most the company assets, with the exception of those in Santos basin and onshore are still in exploration and pre-exploration phase. So there are no estimates of the possible amount of recoverable oil if it is to exist. As result we’ll only consider Santos basin projects in our valuation. We’ll also be despising the
3
Benguela, Belize, Lobito, and Tomboco
4
In working interest production of the consortium
5
Compliant Piled Tower
6
Floating Production Storage Offloading
Graph 5: Galp Energia working interest production in Angola (kboepd)
Source: Galp Energia and analyst estimates
0 50
2010 2020 2030
Table2: Galp Energia assets in Brazil
Basin: Stake Operator
Santos - Petrobras
Espírito Santo 20% Petrobras
Potiguar 20% Petrobras
Campos 15% Petrobras
Pernambuco 20% Petrobras
Sergipe Alagoas 50% Galp
Amazonas 40% Petrobras
Source: Galp Energia
Table 3: Galp’s Santos basin assets
Block % Galp Energia Operator
BM-S-11 10% Petrobras
BM-S-8 14% Petrobras
BM-S-2 20% Petrobras
BM-S-24 20% Petrobras
Source: Galp Energia
“GALPENERGIA” COMPANY REPORT
THIS
DOCUMENT
IS
NOT
AN
INVESTMENT
RECOMMENDATION
AND
SHALL
BE
USED
EXCLUSIVELY
FOR
ACADEMIC
PURPOSES
(SEE DISCLOSURES AND DISCLAIMERS AT END OF DOCUMENT)PAGE 8/30 onshore projects that the company is engaged with the development, in our valuation due to the relevance of its size. Still it is important to remind that Galp is taking its first steps as operator in these projects, which is an important step in order to accumulate knowhow, so that it could become the operator in bigger projects.
Galp Energia has a concentrated portfolio of stakes in four blocks in the Santos basin that are located in the pre-salt of ultra-depth water. The company was within the firsts to make discovery in 2006, with the Tupi (now Lula) discovery. So far 19 wells were drilled in four blocks with 100% success rate, one well in each block, excluding the block BM-S-11 where 16 wells were drilled. These wells confirmed the potential recoverable resources, of these blocks and delineated the areas in which development would take place.
Currently development and production is officially taking place in the block BM-S-11, namely in the Lula and Cernambi fields, where declaration of commerciality and field development program was submitted to ANP at December last year. The development of Lula and Cernambi fields will consist in the deployment of nine FPSO, and the drilling of about 160 wells totaling an installed capacity of around 1300 kboepd until 2020.
Capital expenditures
According to our estimates Galp will have to spend around $12 billion to develop its current projects in the next 30 years. Our estimates of capex are based in the amount of oil that could be recovered from a reservoir (see table 4) assuming an average life of 15 years for the reservoir, in order to estimate the needed installed capacity (approx. 490 kpoepd).
With an average international cost of $10,000 per barrel/day to build and install a FPSO unit, we estimated the cost of the production unit. However an FPSO unit needs to be connected to wells so that crude oil can be produced. There are two types of wells, injection and production. The injection well is used to pump water or gas into the reservoir, to drive up the crude oil through the production well. Due to the depth of the pre-salt reservoirs, it needs at least two injector wells to secure the flow in a production well.
Considering that the average flow of a producing well is 20 kboepd, and the number injectors that would be needed to sustain this flow, with installed capacity we estimated the number of wells necessary to be drilled in order to meet the capacity of the field. Taking into account that it costs $66 millions to drill one well,
Table 4: Galp’s Santos basin reverves
Block Discovery Reserves (mmboe)
First oil BM-S-8 Bem-Te-Vi 112 2012
BM-S-11 Lula 650 2010 Cernambi 180 2010
Iara 350 2013
BM-S-21 Caramba 160 2015
BM-S-24 Jupiter 1400 2016
Source: Galp Energia and analyst estimates
Table 5: Investments need to develop current field
Block Discovery Capex ($million) Brasil:
BM-S-8 Bem-Te-Vi 424
BM-S-11 All 5000
BM-S-21 Caramba 606
BM-S-24 Jupiter 5300
Angola:
14, 14k, 32 and 33 374
Source: Galp Energia and analyst estimates
Graph 6: Capex 2011-2015
Source: Galp Energia and analyst estimates
0 1000 2000 3000 4000 5000
“GALPENERGIA” COMPANY REPORT
THIS
DOCUMENT
IS
NOT
AN
INVESTMENT
RECOMMENDATION
AND
SHALL
BE
USED
EXCLUSIVELY
FOR
ACADEMIC
PURPOSES
(SEE DISCLOSURES AND DISCLAIMERS AT END OF DOCUMENT)PAGE 9/30 and a drilling success rate of 70%, we were able to precise the amount investment needed to develop each reservoir.
Ultimately we expect the company to invest approximately $400 million in Angola and $2400 million in Brazil, between 2011 and 2015.
Valuation
After estimating the value of the capital expenditures, we evaluated this segment by discounting the future cash flows of the projects, taking into account the timeline of first oil in each project.
Furthermore the length of our estimation is until the exhaustion of the reserves in each block. Concerning the operational variables we consider $100/barrel as the long term price of crude oil in the international markets, as oil demand expected to grow and it’s a value that generates among consensus OPEP member states. About the operational costs we considered the value of Petrobras lifting costs as Petrobras have large portfolio and experience in deepwater projects and more important it is the operator of the main projects of Galp Energia.
Finally for the tax we took into account the two different types of contracts, concession (Brazil) and production sharing agreement (Angola). The tax rate is 40% under concession regime and 50% on the working interest production under the production sharing agreement.
After all we value E&P segment at €9.427 per share
7
For discount rates and further information see Sum-Of-The Parts chapter
Table 6: Valuation summary of E&P segment
EV (€ millions) €/Shares
Angola:
Block 14 351 0.33
Rest of block 14, 14k, 32 and 33 686 0.64
Brazil:
BM-S-11 4669 4.38
BM-S-8 2070 2.65
BM-S-21
BM-S-24 2377 2.23
Total E&P 10154 9.52
Source: Analyst estimates
Graph 7: Pertrobras operational costs per barrel
Source: Petrobras 0
10 20 30 40
“GALPENERGIA” COMPANY REPORT
THIS
DOCUMENT
IS
NOT
AN
INVESTMENT
RECOMMENDATION
AND
SHALL
BE
USED
EXCLUSIVELY
FOR
ACADEMIC
PURPOSES
(SEE DISCLOSURES AND DISCLAIMERS AT END OF DOCUMENT)PAGE 10/30
Sensitivity analyses
In this section we examine key factor that influence the value of this segment and consequently the company value. These main factors are oil prices and delays of investments in the projects.
Oil price is by far the most sensitive variable that affects directly the project cash flow through the revenue, reminding the capital intensive character of this industry.
As discussed above the decision of investment in the major projects is not in the hands of Galp Energia. Consequently delays or anticipation of investments and commercial production dates have an impact in the segment overall value as it can postpone future cash-flow, assuming all other variables maintain constant.
Refining and Marketing
Galp Energia has two refineries Porto and Sines. The Porto refinery has the capacity to process around 90 kbbl/d8. The refinery type is hydroskimming9, and it is equipped with atmospheric distillation, upgrades for naphta reforming and the necessary treating processes to meet the specifications of finished products. This processing type has to produce gasoline in order to have the hydrogen needed to produce diesel, which limits the possibilities to optimize gasoline and diesel production independently. These units generally do not contain catalytic conversion processes and therefore their product distribution reflects closely the composition of the crude oil processed.
8
Thousands of barrels per day
9
Hidroskimming unit upgrades naphta to gasoline and gasoil to diesel and heating oil.
Figure 6: Galp Energia Production mix
Source: Galp Energia
3%
24%
3%
36% 7%
16% 8% 4%
Gases Gasoline
Aromatics Diesel
Jet Fuel oil
C&L Others
Table 8: Project delays effect in our base case target price
Years Base 1 2 3 4 5
17.06 15.87 15.15 14.50 13.90 13.36
Source: Analyst estimates
Table 7: Change in crude oil effect in our base case target price
oil price -25% -20% -15% -10% -5% Base 5% 10% 15% 20% 25% 10.57 11.86 13.16 14.46 15.76 17.06 18.36 19.66 20.96 22.26 23.56
Source: Analyst estimates E&P segment very sensitive to
“GALPENERGIA” COMPANY REPORT
THIS
DOCUMENT
IS
NOT
AN
INVESTMENT
RECOMMENDATION
AND
SHALL
BE
USED
EXCLUSIVELY
FOR
ACADEMIC
PURPOSES
(SEE DISCLOSURES AND DISCLAIMERS AT END OF DOCUMENT)PAGE 11/30 As a simple refinery (also known as a skimmer or topper) it is focused on crude oil distillation with very little investment in equipment to upgrade the distillate streams. In contrast a “complex” refinery refers to a refinery with secondary heavy oil upgrading units downstream of atmospheric distillation.
There are several measures of complexity. The most recognized is the Nelson Complexity Index (NCI)10 which represents a standard measure to ascertain refinery complexities. It captures the proportion of the secondary conversion unit capacities relative to primary distillation or topping capacity. It is an indicator of not only the investment intensity or cost index of the refinery but also the value addition potential of a refinery. The Porto refinery has a NCI of 9.4, which is quite high for a simple hydroskimming refinery (that has a NCI of around 2), fact that have to do with the specialization of the refinery in solvents and aromatic, that has the NCI assign factor of 15.
Aromatic and solvents represents 10% of Porto refinery output and generates higher margins than the other distillates. Despite earning higher margins it’s influence in the over the refinery overall margin is limited, since it uses as raw material heavy naphtha produced with hydroskimming process, which is not upgraded to gasoline.
Sines is a cracking11 refinery with a processing capacity of 220 kbbl/d. It current processing configuration is oriented towards maximizing gasoline production from raw materials. For this purpose Sines refinery counts with two fabrication units that have within it, two vacuum distillation units, an fluid catalytic cracker (FCC)12, a Visbreaker13 and two units for diesel hydrodesulphuring. It also has a utilities factory and a cogeneration central. The ability of this refinery to change yields and reduce gasoline production is limited, since the proportion of gasoline and gasoil produced by an FCC refinery is relatively fixed.
Sines refinery has a NCI if 6.3, a value that is substantially lower than the Porto refinery. This fact is due to the fact that, despite having a more complex secondary conversion unit capacity, it still has inflexibility in the choice of product
10
Nelson complexity index developed by Wilbur L Nelson in 1960, assigns a factor of one to the primary distillation unit. All other units are rated in terms of their costs relative to the primary distillation unit (atmospheric distillation unit).
11
Is the process whereby complex organic molecules such as kerogens or heavy hydrocarbons are broken down into simpler molecules such as light hydrocarbons, by the breaking of carbon-carbon bonds in the precursors
12
Is a processing unit in oil refinery that uses catalysts and high temperature to crack/break down vacuum gasoil or residue into mainly gasoline and a small volume of (poor quality) gasoil
13
Is a processing unit in oil refinery that reduces the quantity of residual oil produced in the distillation of crude oil and to increase the yield of more valuable middle distillates (heating oil and diesel) by the refinery
Table 9: Iberian intalled refining capacity
1
Repsol
47.2%
2
Cepsa
26.4%
3 Galp
19.0%
4
BP
7.4%
Spain
81.0%
Portugal
19.0%
Source: Companies
Porto refinery has an high NCI
“GALPENERGIA” COMPANY REPORT
THIS
DOCUMENT
IS
NOT
AN
INVESTMENT
RECOMMENDATION
AND
SHALL
BE
USED
EXCLUSIVELY
FOR
ACADEMIC
PURPOSES
(SEE DISCLOSURES AND DISCLAIMERS AT END OF DOCUMENT)PAGE 12/30 yield, and the fact that aromatics, solvents and base oil productions are more investment intensive than the traditional fuel production.
Galp Energia in the Iberian Context
Carefully analyzing Galp Energia refining business in the Iberian context, we can see that Galp has about 19% of the Iberian refining installed capacity, which places it in the third place, when compared with other operating companies as we can see in the table 9. Although Galp has only 19% of the Iberian refining installed capacity it represents, approximately 114% of Portuguese 2009 crude oil consumption according to our estimates. On the other hand Spain according to our estimates Spanish installed refining capacity represented 89% of the Spanish 2009 crude oil consumption.
Despite having excess capacity, Portugal is still net importer of diesel as we can see in graph 8, where Portugal net imported approximately 20% of the diesel it consumed in the year of 2010. The same can be said of Spain (graph 9) that is net exporter of gasoline, but however it also had to import (net), approximately 29% of the diesel consumed in 2010.
European refining industry
The observed tendency is not limited to the Iberian Peninsula, but also in the entire Europe, as it is braced with the process of dieselization14 in the EU, where from 1990 to 2009, the share of middle distillates15 has increased from 37% to 49%, while the share of light distillates16 decreased from 29% to 22%. On the other hand this evolution of product demand mix is not being followed by the EU refineries that need more time and heavy investments to adjust their product yield to the demand. Meanwhile the EU is exporting the gasoline surplus, and importing the so needed diesel. However the current declining gasoline demand in the US, which is the largest recipient of gasoline from EU provides fewer outlets for Europe’s gasoline surplus.
The European refiners are facing increasingly stringent standards for transportation fuels and their own lack of investment in upgrading and especially desulphurization capacity as a result of poor profitability (see appendix 2). The utilization rates of the refineries in the EU, historically from the year 2000 have
14
This process provides lower tax for diesel, comparatively gasoline as it is more environmental friendly
15
Middle distillates category includes, kerosene/Jet, and diesel
16
Light distillates includes category includes, LPG, gasoline and naphtha
Graph 8: Portugal’s gasoline and diesel supply (2010) (unit -1000 tonnes)
Source: Eurostat
-2000 0 2000 4000 6000
Gasoline Diesel
Net Output Export Import
Graph 9: Spain’s gasoline and diesel supply (2010) (unit -1000 tonnes)
Source: Eurostat
-10000 0 10000 20000 30000 40000
Gasoline Diesel
Net Output Export Import
Graph 10: EU demmand mix
Source: BP statistical review 2010
16% 19% 17% 10% 37% 49% 29% 22%
1990 2009
Others Fuel oil
“GALPENERGIA” COMPANY REPORT
THIS
DOCUMENT
IS
NOT
AN
INVESTMENT
RECOMMENDATION
AND
SHALL
BE
USED
EXCLUSIVELY
FOR
ACADEMIC
PURPOSES
(SEE DISCLOSURES AND DISCLAIMERS AT END OF DOCUMENT)PAGE 13/30 been the second highest, however mature markets such as the US, EU and Japan have registered falls in utilization rates in the more recent years as China has continued to increase, registering the highest utilization rate since 2008. But the tendency of the utilization rates has been downward, since in the year of 2008 in every region because of the financial crisis (graph 12).
The annual gap in demand of gasoil and jet fuel in the EU was 30 million tonnes in 2009. OPEC World oil outlook (WOO) estimates that Europe is expected to add 0.6 million barrel per day in conversion capacity until 2015. In which according to our estimates can only fill up to half of the deficit (see appendix 1). Despite of the crisis Asia and the Middle East have added 2 million bbl/day of new crude distillation capacity since 2008, and further 5 million bbl/day, is expected to come at full steam until 2015.
These Asian and Middle Eastern oil firms are already looking at the EU market, as a temporary outlet for excess production until local markets grow sufficiently to absorb production. In fact there have been acquisitions of number of refineries in the EU, by firms from that region (Stanlow in the UK by Essar Oil India and Cepsa by Abu Dhabi sovereign wealth fund) with the aim to close these refineries and turn them into import terminals.
Galp Energia refining margins
Comparing Galp Energia margins, with its European benchmarks, we find out that the companies on average as higher refining margins than its European peers (graph 14). Our estimates indicates that the main reason behind this
Graph 12: Refining utilization rates by region
Source: BP statistical review of the world 2010 70,00%
75,00% 80,00% 85,00% 90,00% 95,00%
2000 2001 2002 2003 2004 2005 2006 2007 2008 2009
European Union Middle East China Japan US
Graph 11: Refining capacity additions from existing projects, including capacity creep (2010–2015)
Source: OPEC (WOO)
0 2 4
US & Canada Latin America Europe Middle East FSU Africa Asia-Pacific
“GALPENERGIA” COMPANY REPORT
THIS
DOCUMENT
IS
NOT
AN
INVESTMENT
RECOMMENDATION
AND
SHALL
BE
USED
EXCLUSIVELY
FOR
ACADEMIC
PURPOSES
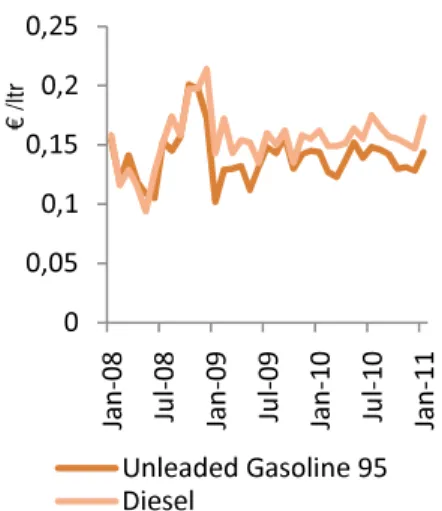
(SEE DISCLOSURES AND DISCLAIMERS AT END OF DOCUMENT)PAGE 14/30 advantage is that the prices practiced by Galp for fuel at the exit of its refineries without taxes are on average €0.15 per liter more expensive than its European references FOB NWE17 (graph 13).
Oil product are tradable goods, which means that ex-refinery prices not only the crude prices and refinery costs, but before that it depends on prices made by other refineries. However the competitive advantage of a refinery increase, as close the refinery is to the consuming centers, and the bigger is the logistic constrains associated with the import of the oil products.
In the Portuguese case, these associated logistic difficulties are mainly, availability of seaports and storage facilities to the imported fuel. To quantify how much of this constrain is reflected in the fuel price we will consider what is designated by, import parity price (IPP), which is the price of the products if it was bought abroad. It takes into account the prevailing international markets (FOB) for oil products, plus the costs of transportation, insurance, disembarkation and stock breaking during the transportation.
As we can see in the table 10, the logistic constrains related with the import of fuel like ports and storage facilities explains part of the differential which means that Portuguese refineries uses this competitive advantage, when making its prices.
Conversion project
In order to meet market actual demand structure, Galp’s refineries are going under heavy investment, in order to increase its conversion capacity, to add more
17
FOB NWE, means free on board in the northwest European zone, that serve as reference to Portugal
Graph 14: Refining margins
Source: Platts and Galp Energia
-2 0 2 4 6 8
1Q 2Q 3Q 4Q 1Q 2Q 3Q 4Q 1Q 2Q 3Q 4Q 1Q 2Q 3Q 4Q 1Q 2Q 3Q 4Q
2006 2007 2008 2009 2010
Rotterdam cracking refining margin (Usd/bbl)
Rotterdam hydroskimming + aromatics + base oil refining margin (Usd/bbl)
Galp Energia refining margin (Usd/bbl)
Graph 13: Portuguese mainland pre-tax, ex-refinery fuel prices minus its European reference (FOB NWE)
Source: European Commission and Platts
0 0,05 0,1 0,15 0,2 0,25
Ja
n
-0
8
Ju
l-0
8
Ja
n
-0
9
Ju
l-0
9
Ja
n
-1
0
Ju
l-1
0
Ja
n
-1
1
€
/l
tr
Unleaded Gasoline 95 Diesel
Table 10: IPP (Jan-11)
(Values in €/m3) Gasoline Diesel
Freight 21.80 21.25
Disembarkation 1.61 1.49
Storck breaking 2.43 1.05
FOB NWE 486 527
IPP 511.84 550.79
Continental Portugal
630 694
“GALPENERGIA” COMPANY REPORT
THIS
DOCUMENT
IS
NOT
AN
INVESTMENT
RECOMMENDATION
AND
SHALL
BE
USED
EXCLUSIVELY
FOR
ACADEMIC
PURPOSES
(SEE DISCLOSURES AND DISCLAIMERS AT END OF DOCUMENT)PAGE 15/30 flexibility to the product yield. The ongoing conversion project consists, in the construction of a new vacuum distillation unit in the Porto refinery, to process the atmospheric residues resulted atmospheric distillation for obtaining vacuum gasoil (VGO) and a visco-reduction unit for the soft thermal cracking of the resulting vacuum residue. And also of a new the hydrocracking unit in the Sines refinery will process vacuum diesel and heavy visbreaking diesel produced in the Porto refinery. Additionally the project includes a steam reforming unit that uses natural gas or naphta as raw material to produce the hydrogen required for the hydrocracking process that will be installed in the Sines refinery.
The company ultimate objective with conversion project is to increase the share of middle distillates in the product mix to 50%, reduce the production of fuel oil, and to take more advantage of heavy crude oil market discount by including more heavy crude in its diet.
Looking at the graph 16 we can compare the different crack spreads18 of the main oil products. Considering the change of product mix after the conclusion of the conversion project we estimated an incremental margin of $1 per barrel from this effect. Moreover the company is expected to be processing 70% medium and heavy crude oil from the actual 50%. The average heavy light crude oil discount is $3.5/barrel, so we estimated that the company can save up to $1.4/barrel, with the change of the crude diet. Finally higher utilization rate is expected as the refineries will be taking advantage of the Iberian and European diesel deficit, with its proximity to the consumer market.
After the conclusion of project Galp’s refinery will be linked and operated as a single refinery, and will have a refining capacity incrase to 330 kbbl/d. The NCI index of Porto and Sines will also increase to 10.7 and 7.7 respectively.
18
Is the market value of a barrel of the oil product minus the market value a barrel of crude oil
After the conversion project both refineries will be operated has a single refinery
Graph 16: Oil products crack spread
Source: Platts
-40 -20 0 20 40
1Q 2Q 3Q 4Q 1Q 2Q 3Q 4Q 1Q 2Q 3Q 4Q 1Q 2Q 3Q 4Q 1Q 2Q 3Q 4Q
2006 2007 2008 2009 2010
Diesel crack spread (USD/barrel) Gasoline crack spread (USD/barrel) Fuel oil crack spread (USD/barrel)
Graph 15: Galp Energia product mix
Source: Galp Energia and analyst estimates
24% 20% 43% 50% 17% 12% 16% 18%
Pre-conversion Conversion Gasoline Middle distillates
Fuel oil Others
Galp Energia expected to increase its refining margin by $2.4/barrel after the conclusion of the conversion project
“GALPENERGIA” COMPANY REPORT
THIS
DOCUMENT
IS
NOT
AN
INVESTMENT
RECOMMENDATION
AND
SHALL
BE
USED
EXCLUSIVELY
FOR
ACADEMIC
PURPOSES
(SEE DISCLOSURES AND DISCLAIMERS AT END OF DOCUMENT)PAGE 16/30
Iberian marketing activities
Marketing or the wholesale and retail sale of fuel products activities, are considered to be the last part of value chain of the oil industry. Profits tend to be much less volatile than those of its refining activities, usually at a time of rising oil prices marketing margins are lower as the marketer takes time to push through increases in the cost of refined product. Similarly at times of falling oil prices, marketing prices tend to be very sticky, with margins expanding as input costs fall.
Furthermore there is little differentiation, between the products offered by these market suppliers, consequently margins per units in this activity tends to be very small. As result volumes and control of costs are key to the profitability of marketing activity. Given these features, we conclude that location is the main driver of the profitability of this activity, since companies can increase or decrease the volumes or margins, by changing prices depending on the location of the retail outlet. The marketing margin also depends on the decree of control of the supply chain, exercised by the company.
Galp Energia sold 10.4 million tonnes to direct clients in 2010, down 6.3% from 2009. It controls 14% of the Iberian marketing activities, with its leadership of the Portuguese retail fuel market with a 34% market share and its 6% market share in Spain. The Iberian market for refined products has four main players Galp Energia, Repsol, BP, and Cepsa/Total. The remaining players in the market are independents and supermarkets. Typically independents have a much reduced margin to make price differentiation, with major oil companies, since they don’t have the capacity buy the oil products at ex-refinery base. Finally the supermarkets are the main challenge to all of the companies in the retail market, because of its strategy that is to fix its price in such way that is the lowest at the influence area of their stores, so that they can attract people to their store.
The four main players of the Iberian market cooperate with each other by having swaps agreements for the exchange of product at Iberian level, due to the symmetry of relations between them. For instance Galp is the main supplier of oil product, at ex-refinery base to Repsol, BP and Cepsa in Portugal, while the same are the main supplier of Galp in Spain. This allows the involved companies to level their logistics costs base at the same denominator.
Valuation
Graph 17: Sales to direct clients in Iberia (million tonnes)
Source: Galp Energia
0 5 10 15
2009 2010
Marketing activity is less volatile than refining activity
“GALPENERGIA” COMPANY REPORT
THIS
DOCUMENT
IS
NOT
AN
INVESTMENT
RECOMMENDATION
AND
SHALL
BE
USED
EXCLUSIVELY
FOR
ACADEMIC
PURPOSES
(SEE DISCLOSURES AND DISCLAIMERS AT END OF DOCUMENT)PAGE 17/30 In the valuation of this segment, we separated the refining activity from the marketing activity. Despite being integrated, there are varying specific issues differing in those activities that needed to be treated separately, so that its value could be captured in the most appropriate form. In the valuation of the refining activity we used discounting cash flows method, where we considered as main the main indicators of a refinery performance that is refining margins, refinery cash costs, and utilization rates. Our assumptions about those indicators are:
• The refining margin is expected to increase from current $2.6 to $5 per barrel as result of the conversion project.
• The refining cash costs are expected to maintain at $2.1 per barrel, as the other operational costs are expected to remain constant.
• The utilization rate is expected to increase to 95% as the company is going to take advantage of the European diesel deficit exporting its excess capacity.
For the valuation of the marketing activities we also consider discounted cash flows as the best approach to capture the value inherent to its activity. Aware of the fact that marketing of crude oil products takes place in many forms, which involves different margins like retail, wholesale, LPG, and others that includes lubricants, aromatics, solvents, we indentified the value drivers of the marketing activity that are the realized margin in the sale of the products.
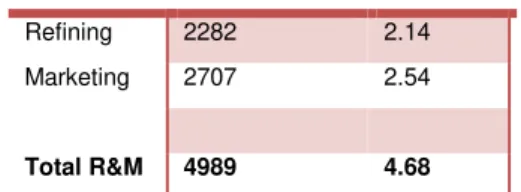
Finally we value the R&M segment at €4.1119 per share.
Sensitivity analyses
In this segment our sensitivity will focus on the refining activity since the marketing activity is considered to have stable margins, only being exposed to the level of economic activity. Therefore the main factors concerning the value of the refining activity in our valuation are the refinery capacity utilization and the
19
For discount rates and further information see Sum-Of-The Parts chapter
Table 12: Valuation summary of R&M segment
EV (€ millions) €/Shares
Refining 2282 2.14
Marketing 2707 2.54
Total R&M 4989 4.68
Source: Analyst estimates
Table 11: Key variables
Refining margin (Usd/bbl) 5 Refinery cash costs (Usd/bbl) 2.1
Whole sale margin 10
Retail margin 30
LPG margin 50
Others 70
“GALPENERGIA” COMPANY REPORT
THIS
DOCUMENT
IS
NOT
AN
INVESTMENT
RECOMMENDATION
AND
SHALL
BE
USED
EXCLUSIVELY
FOR
ACADEMIC
PURPOSES
(SEE DISCLOSURES AND DISCLAIMERS AT END OF DOCUMENT)PAGE 18/30 refining margin, which in its turn depends on the product mix and the crack spread of the oil products.
Thus we conclude that both refining margin and utilization rate have little impact in the company target price due to the increasing importance of the E&P segment in the company business activity.
Gas and Power
Market environment
Natural Gas demand reached important levels in recent years. In 2009 it was the third largest source of primary energy in the world, with a share of 24% (3000 bcm) of total energy use in 2009. The increasing environmental pressures, instability in oil rich nations and favorable pricing provide strong incentives to both private industry and governments to favor gas over coal or oil as the source for energy generation.
According to IEA, demand of natural gas is expected to grow by 43% until 2030.
Unlike oil markets, natural gas markets are generally regional, due to the limitations of infrastructure and transportation. Despite deregulation, markets in Europe remain not competitive, with prices and competitive advantage of each company in the liberalized market still based on LT contracts20 own by these companies. Only the US and the UK are transparent markets with active gas trading.
Although some gas trading hubs have established in continental Europe in recent years, a full efficient spot pricing in Europe is not possible in the short run. The main reason is that the majority of pipelines in Europe flow east to west (from
20
Long term contracts are long term gas contracts that are indexed to a basket of oil product prices, generally lagged by between three to nine months. The contract nature means visibility on pricing is poor although, theoretically, prices should track those of crude.
Graph 18: US Henry hub
Source: BP Statistical review 2010
0,00 2,00 4,00 6,00 8,00 10,00
1989 1999 2009
US Henry Hub
Table 13: Refining margin decrease effect in the target price
Refining margin 5.00 4.50 4.00 3.50 3.00 2.50 2.00 1.50 1.00
17.06 16.58 16.09 15.61 15.13 14.64 14.16 13.67 13.19
Source: Analyst estimates
Table 14: Refining utilization rate decrease effect in the target price
Utilization rate %
95% 90% 85% 80% 75% 70% 65% 60% 55% 50%
17.06 16.91 16.75 16.60 16.45 16.29 16.14 15.98 15.83 15.68
Source: Analyst estimates
“GALPENERGIA”
THIS
DOCUMENT
IS
NOT
AN
EXCLUSIVELY
FOR
ACADEM
Norway/R the other limited giv Though, a increases will also market as
Galp Ene marketing natural ga gas (NG) liquefied n Portugal where LN Some LN pricing. With the competitiv generated procurem regulated Portugues the figure The mark marketing related wi infrastruct regasefica falls outsi distributio to be judic both regul
21 Liquified Natural Gas 22 Billions cubic meters
Table 15: Galp international pipelines International
Pipelines
Country Capaci. (bcm / year)
Galp %
EMPL Algeria, Morroco
12 27.4%
Al Andalus Spain 7.8 33.0%
Extremadura Spain 6.1 49.0%
Source: Galp Energia
Table 16: Galp NG supply contracts Contracts Country Contracted quantities (bcm/year)
Term
NLNG l (LNG) Nigeria 0.42 2020
NLNG ll (LNG)
Nigeria 1 2023
NLNG + (LNG)
Nigeria 2 2026
Sonatrach (NG)
Algeria 2.3 2020
Source: Galp Energia
Figure 7: Galp Energia sales of NG
Source: Galp Energia
83% 3%
14%
Portugal Spain Other
Figure 8: Natural gas value chain
Source: Galp Energia •Industrial clients
•Commercial and residencial clients Marketing •Transport •Regasefication •Storage •Distribution Infrastructure •Natural Import Procurement
COMPANY REPORT
AN
INVESTMENT
RECOMMENDATION
AND
EMIC
PURPOSES
(SEE DISCLOSURES AND DISCLAIMER/Russia to rest of Europe) and do not have the ab er side the access to other sources of gas via LN given the lack of regasification and storage facilities , as regasification capacity in Europe grows an es, it is expected that trade on both spot and forw increase in the long term, so the competition an as well.
Galp Energia in Natural Gas
nergia natural gas business consists of the purcha ing in the Iberian Peninsula. In 2010 the compa gas in which 83% was in Portugal and 3% in Spai G) is secured by an average 20 years LT contract d natural gas (LNG), through Sonatrach in Algeria, l through pipelines EMPL, Al Andalus and Extr LNG is purchased from NLNG and transported to th LNG is also bought on the spot market to take a
he main of turning the Gas sector in the Ibe titive, there was a major deregulation in the mar
ted a set of regulated and unregulated activitie ment and mixed, regulated and unregulated mar ed infrastructure. An example of how Galp Ene ese natural gas market, was affected with the dere re 8.
arket was divided in three parts, the procureme ing, in which might regulated or liberalized. The p with the activity of importing natural gas is a libera ucture activity is regulated and it is divided in fo fication, storage and distribution. The transport and
tside the scope of Galp Energia activities, altho tion activities are allowed to be within the company
dicially separated from the marketing activity. Fina gulated and liberalized.
RT
D
SHALL
BE
USED
ERS AT END OF DOCUMENT)
PAGE 19/30 ability to reverse flow, on LNG21 currently remains ies in Europe.
and as demand for gas rward markets in Europe and transparency of the
chase of natural gas and pany sold 4.9 bcm22 of pain. Its supply of natural act of six bcm of NG and ia, which is transported to xtremadura, and Nigeria the Sines LNG terminal. advantage of favorable
Iberian Peninsula more arket. This deregulation ities, ranging from free arketing through to fully nergia operations in the regulation is described in
“GALPENERGIA” COMPANY REPORT
THIS
DOCUMENT
IS
NOT
AN
INVESTMENT
RECOMMENDATION
AND
SHALL
BE
USED
EXCLUSIVELY
FOR
ACADEMIC
PURPOSES
(SEE DISCLOSURES AND DISCLAIMERS AT END OF DOCUMENT)PAGE 20/30 The regulated part of the distribution activity is remunerated according to the ERSE23 rules specifying which permitted revenues shall be used for the calculation of tariffs. Regulated marketing activity is the last-resort supplier activity carried out by the distributor.
The allowed revenues are calculated at the beginning of a three years regulatory period (until June 2013) and it is equal to the sum of the cost of capital, operating expenses and the tariff gap. The cost of capital is calculated as the product of the RAB24 by the rate of return set by regulator that is 9% (until June 2013) in the case of distribution and 8% in the case of underground storage, plus depreciation charges. The tariff gap is the difference between estimated allowed revenues and actual revenues for year n-2.
The last-resort retailing marketing activities, for the sales to final customers in the first five regulatory periods (until 30 June 2022), remunerates an amount equal to the product of €4/client/year by the number of clients at the start of each regulatory period.
Under the new regulatory framework distribution of natural gas in Portugal is provided by six distributors and four so-called autonomous distribution units (ADU). Galp Energia owns stakes in five of the distributors and in the four ADU with a total RAB of €1184 millions. The distributors operate through concession contracts has been awarded for a period of 40 years, and the ADU operates under 20-year license.
Galp Energia underground storage activity has a RAB of € 19 millions and operates under concession awarded for a period of 40 years. In addition, it has explicitly been awarded the right to expand its storage activity.
Still the Iberian Peninsula is not yet a competitive natural gas market, because of operational constrains. For instance there Portugal has only two operational natural gas pipeline interconnection with Spain (Campo Maior and Valença), that due to geographical position cannot transfer natural gas between Portuguese and Spanish major underground storage facility ( Carriço (Portugal) and Yela (Spain)). However there is a project sponsored by REN25 and its Spanish counterpart to connect Carriço and Yela with a new pipeline and interconnection
23
Portuguese energy market regulator
24
Regulatory Asset Base
25
Rede Electrica Nacional, SA, is the concessionaire of the activity of transportation and regasification of natural gas in Portugal
Graph 19: RAB of Galp Energia distributors
Source:
56 566 281 148 76 9
31 14 3
60% 100% 85% 45% 41% 100% 100% 100% 100%
Beiragás Lisboagás Lusitaniagás Setgás Tagusgás Dianagás Duriensegás Medigás Paxgás
Galp Energia %
Figure 9: Calculation of permitted revenues for the regulated activity of natural gas distribution in Portugal
Source: Galp Energia
Allowed revenues
Cost of capital
RAB x Renumeration
base + Depreciations
Tariff deviation
Operational costs
“GALPENERGIA” COMPANY REPORT
THIS
DOCUMENT
IS
NOT
AN
INVESTMENT
RECOMMENDATION
AND
SHALL
BE
USED
EXCLUSIVELY
FOR
ACADEMIC
PURPOSES
(SEE DISCLOSURES AND DISCLAIMERS AT END OF DOCUMENT)PAGE 21/30 (Zamora) with reverse flow capacity. When concluded it is expected to increase competition in the Iberian market.
Power
This is the smallest business unit within Galp Energia portfolio, although the company has the ambition of developing a competitive portfolio of power generation that includes cogenerations, CCGT plants and wind power. Moreover as provider of integrated energy solutions, Galp Energia created a department for trading electricity, with the intention of promoting development of the market for electricity with a view to safeguarding the natural gas client base in an unregulated market environment.
Galp Energia current cogeneration capacity is 160 megawatts (MW), this capacity is expected to increase by 80 MW until the end of the year, when matosinhos cogenerations come in service. The new plants are expected to increase the annual demand for natural gas, which will further integrate the natural gas and power businesses.
Carriço, Powercer and Energin, are three cogeneration plants, which are partly owned by Galp Energia (65%, 35% and 70%, respectively), have a joint capacity of 80 MW.
The company also holds 49% of Ventinveste, S.A. (Ventinveste), a company, in which the installation of generation capacity of 400 megawatts in six wind farms has been awarded, Construction of the 12MW Vale Grande wind farm, which started in the fourth quarter of 2010, is scheduled for completion in 2011.
Both cogeneration plants and the wind farms are the source of electric power generation under special regime that has priority access to the grid and sale at a regulated tariff.
In 2010, negotiations continued over the proposals presented by the bidders for the engineering, procurement and construction of the Sines combined cycle plant plant, which will have installed capacity of 800 megawatts for the production of electricity under market regime.
Valuation
Our valuation is based on DCF, for the liberalized gas activity and the power. Finally for the regulated activity as described below it is constantly remunerated with a fixed percentage of RAB established by ERSE. Hence the value underlying value will be the difference between the regulated remuneration with
Table 17: Installed capacity (2010)
EDP 10033 GW
Galp Energia:
Cogeneration
Carriço, Powercer and Energin
80 MW
Sines 80 MW
Matozinhos (start in 2011) 80MW
Wind
Vale Grande (start in 2011) 12 MW
Total 252 MW
(1 GW=1000 MW)
Source: Companies
Table 18: Rates
Rate Diference
Distribution 9,00% 3,68%
Storage 8,00% 2,68%
G&P 5,32%