THIS REPORT WAS PREPARED BY “ANDRÉ CHEN”, A MASTERS IN FINANCE STUDENT OF THE NOVA SCHOOL OF BUSINESS AND ECONOMICS, EXCLUSIVELY FOR ACADEMIC PURPOSES. THIS REPORT WAS SUPERVISED BY ROSÁRIO ANDRÉ WHO REVIEWED THE
M
ASTERS IN
F
INANCE
E
QUITY
R
ESEARCH
We initiate coverage Iberdrola with a SELL rating and a YE14 target price of EUR 4.51. The stock is currently trading at a premium over its main European peers (EV/EBITDA of 7.72 versus industry 6.30). We expect this trend to correct as the full impact of renewable policy is still not embedded in the stock’s valuation.
Regulatory uncertainty in home market still affecting performance. With the recently withdrawal of government’s
contribution to the tariff deficit, we still expect pressure on the balance sheet in the short term. Additionally we estimate the new remuneration for renewable energy to impact Iberdrola by EUR 205 million annually, which is still not fully priced in the market.
More risk around the corner. Some EU countries like UK, are currently discussing the affordability of the energy policy mainly regarding renewable energy. We foresee additional risk for Iberdrola due to regulatory cuts outside Spain.
We value the stock at EUR 4.51 implying a 2.1% downside. We base our TP on a SOTP methodology, including a set of alternative scenarios (80:20 split). Regulated business contributes the highest to the stock’s value (52%) with generation and renewable contributing with 27% and 22% respectively. The main risks to our valuation comprise a worse regulatory outcome, decline in power prices and more volatile forex than expected.
Company description
Iberdrola is a Spanish based company that operates in the utility sector. The company specializes in clean energy, more specifically wind energy. Its main operations include distribution and transmission of electricity, production under the ordinary and special regime, supply of energy to end-users and other non-core business (construction and telecommunication business).
I
BERDROLA
S.A.
C
OMPANY
R
EPORT
U
TILITIES
S
ECTOR
6
J
ANUARY2014
S
TUDENT
:
A
NDRÉ
C
HEN
[email protected]
A dim path for renewable
Regulatory pressure pushing away recovery
Recommendation: Sell
Price Target FY14: EUR 4.51
Downside risk 2.1%
Price (as of 3-Jan-2014) EUR 4.61
Reuters: IBE.MC, Bloomberg: IBE SM
52-week range (€) 3.47–4.79
Market Cap (€m) 28,772.52
Outstanding Shares (m) 6,240
Free-Float 63.43%
30-Day Average Volume 40,288,850
YTD Price return 10.49%
Source: Bloomberg; Reuters
Source: Bloomberg
(Values in € millions) 2012 2013E 2014F Revenues 34,201 32,824 32,542 EBITDA 7,727 7,361 6,794 Net Profit 2,868 2,709 2,311 EPS (EUR) 0.47 0.43 0.37 DPS (EUR) 0.34 0.28 0.28 P/E (x) 9.80 10.70 12.54 Dividend Yield (%) 7.44% 6.07% 5.98% EV/EBITDA (x) 7.84 8.13 8.81 Net Debt/EBITDA (x) 3.96 3.84 3.99 Net debt/Equity (x) 0.90 0.81 0.78 Debt/Assets (x) 0.34 0.32 0.32 ROIC (%) 6.02% 5.37% 4.76% Source: Company Data; Analyst’s estimates
0 50 100 150 200
jan-07 jan-08 jan-09 jan-10 jan-11 jan-12 jan-13
Iberdrola
Ibex 35
IBERDROLA S.A. COMPANY REPORT
Table of Contents
INVESTMENT CASE ... 3
COMPANY OVERVIEW ... 4
BUSINESS DESCRIPTION... 4
SHAREHOLDER STRUCTURE ... 6
LEVERAGE ANALYSIS ... 6
STRATEGIC OUTLOOK... 8
MACROECONOMIC ENVIRONMENT ... 8
ECONOMIC PROFILE ... 8
ENERGY DEMAND AND SUPPLY ... 10
POWER PRICES ... 12
SPANISH TARIFF DEFICIT ... 13
RENEWABLE ENVIRONMENT ... 15
BUSINESS FORECAST ...16
NETWORK BUSINESS ... 16
GENERATION AND SUPPLY BUSINESS ... 20
RENEWABLE BUSINESS ... 24
FAIR VALUE ...26
DISCOUNT FACTORS ... 27
FINANCIAL INVESTMENTS ... 28
SUM-OF-THE-PARTS ... 29
ALTERNATIVE SCENARIOS ... 30
SENSITIVITY ANALYSIS ... 31
APPENDIX ...32
APPENDIX I:INTERNATIONALIZATION PROGRAM ... 32
APPENDIX II:INVESTMENT PLAN ... 32
APPENDIX III:ELETRICITY MARKET DYNAMICS ... 33
APPENDIX IV:TECHNOLOGY COSTS ... 33
APPENDIX V:SPANISH REGULATION ... 34
APPENDIX VI:SPANISH DEFICIT FORECASTS ... 35
APPENDIX VII:COMPARABLES ... 35
APPENDIX VIII:COST OF CAPITAL ... 36
APPENDIX IX:SUM-OF-THE-PARTS ... 36
FINANCIAL STATEMENTS ...37
IBERDROLA S.A. COMPANY REPORT
Investment Case
Iberdrola is Spain’s largest utility company by market capitalization, currently
representing 7% of Ibex 35. It is responsible for producing each year around 135 TW and currently operates a total of 44,866 MW of installed capacity across the world. Iberdrola is placed as the world leader in wind energy, with a total installed capacity of 14 GW. It operates in the main businesses of the energy sector, being one of the main players in the market.
The situation in the domestic market is not the most favorable one. Recent regulatory changes implemented to reduce the deficit have so far reduced EBITDA by EUR 503 million with the impact for 2014 being much larger. The Spanish state has withdrawn its commitment (five months after announcing it) to a EUR 3.6 billion contribution for the system, clearly showing the lack of support from the Spanish government1.
Renewable regulation in Spain is still unclear at this stage. We make a first
approach analysis on the impact on Iberdrola based on the 7.5% “fair return”
(Spanish 10 year bond yield plus a 200 bps spread). We reach an annual average impact of EUR 208 million for 2014-2018 (resulting in a EUR 0.49 reduction in share price). We consider this the main catalyst for Iberdrola as it currently owns around 18% of total renewable capacity in Spain. We believe this measure is still not fully incorporated in the market. The recent discussions regarding the affordability of EU energy policy (namely renewable incentives) are also a major source of risk for Iberdrola as it is one of the most exposed companies to this technology2.
The tariff deficit is a major constraint on the deleveraging story. However we believe Iberdrola will be able to deleverage without harming future performance. The focus on cost-cutting, Capex reduction and the disposals of non-core assets should be the trigger here. Additionally, the deconsolidation of NeoEnergia will also reflect positively on this issue. The attractive dividend yield (5.37%) and high returns from regulated markets (US and UK) should also be considered.
We cover the stock with a SELL rating, based on 2.1% downside to our YE14 target price of EUR 4.51. Currently the market is not fully valuing the regulatory changes in Spain, namely concerning renewable energy. This is observed in the negative relation between market price and EPS during this period. Iberdrola is trading at a premium towards its peers either in terms of EV/EBITDA (7.72 versus 6.30) and PE ratio (12.77 versus 12.40), thus reiterating our recommendation.
1
See section “Spanish Tariff Deficit” for a more detailed discussion on this subject.
2
See sections “Renewable Environment”and“Renewable Business” for a more detailed discussion on this subject.
Largest utility company in Spain, generating around 135 TW per year
We attribute a SELL rating based on a EUR 4.51 target price
Spanish tariff deficit is still an issue for 2013
Leader in renewable energy but also the one bearing the highest risk
IBERDROLA S.A. COMPANY REPORT
Company Overview
Founded in 1992 as a result of a merger between Hidroeléctrica Española and Iberduero, Iberdrola is nowadays the largest utility company in Spain by market capitalization, representing around 7% of the spanish stock index IBEX 35. The company is present across approximatly fourty countries with special focus on Iberia, United Kingdom, United States, Mexico and Brazil. The main operations of Iberdrola include distribution and transmission of electricity and gas, electricity production under ordinary and special regimes and supply of energy to end-users. Iberdrola also owns other non-core business mainly construction, real estate and telecommunication. Troughout the decade, Iberdrola has made a clear bet on the renewable energy segment, being the world leader in wind energy with 14 GW of installed capacity (31% of its total installed capacity).
Business Description
Iberdrola is established as a vertically integrated business, operating in the major areas of the energy business. Iberdrola structures its business in four main areas: 1) the network (regulated) business that comprises the transmission and distribution of electricity and is present in Spain, UK, USA and Brazil; 2) the generation and supply (liberalized) business that comprises the production of electricity under the ordinary regime (hydroelectric, nuclear, combined cycle gas turbine/CCGT and coal) and the sale to the end-user in the liberal market or through the last resort service of electricity and gas. This business is present in Spain (Iberia), UK and Mexico3; 3) the renewable business (mostly through wind
– 90% of capacity) which is present across the world with special focus in Spain, UK and USA; 4) and other non-energy businesses that includes Iberdrola Ingeniería y Construcción and Iberdrola Inmobiliária.
A large part of the income generated by Iberdrola is originated by the regulated segment (around 50%) and renewable business (21%). These units are less exposed to market risk but are still subject to regulatory risk (remuneration changes). The liberalized business on the other hand is highly exposed to the market. Here is also included Mexico’s long term contracted business (4%) which is dependent on market conditions as to avoid the default of the counterparty. The recent discussions around renewable subsidies and their impact in the end-user electricity bills4 poses in our view some specific risks to Iberdrola’s value
given their positioning versus the industry (represents 21% of 3Q13 EBITDA, versus 9% of peers). Iberdrola would be one of the most affected companies if renewable incentives were to be reduced (as it already is happening in Spain).
3
Small presence in USA as well, which is included in the “Other Businesses” segment due to its small value. 4 More detailed discussion in “Renewable Environment” and “Renewable Business” chapters of this report.
Iberdrola is the world leader in wind energy, with an installed capacity of 14 GW
Iberdrola is the largest Spanish utility company
Figure 1: Lines of
business
Source: Company data
Specific risk coming from renewable positioning
Figure 2: EBITDA 3Q13
per business
50%
28% 21%
-1%
Regulated Business Liberalized Business
Renewable Other and Adjstments
IBERDROLA S.A. COMPANY REPORT
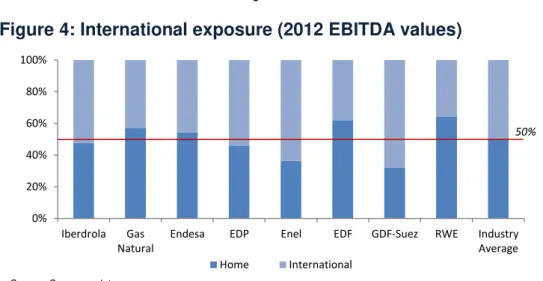
One major driver during the last decade in Iberia has been the diversification of operations, reducing the exposure to the maturing domestic market and looking at growth opportunities mainly in Latin American countries5. In 2012 Iberdrola’s
international segments represented around 52% of the company’s operating
income (versus 50% of the industry). As most of its major European peers, Iberdrola developed its internationalization plan via acquisition of local companies financed mostly with financial debt (see section “Leverage Analysis” for more details). This, together with the easy access, created the huge leverage situation that utility companies face. Now we start seeing divestments occurring in some of those assets considered as non-strategic6.
Figure 4: International exposure (2012 EBITDA values)
Most of Iberdrola’s power plant facilities are located in Spain, with this country representing 57% of the installed capacity held by the group (and 25% of the total installed capacity in Spain). At a group level, installed capacity reached the values of 44,866 MW with the most corresponding to renewable, gas and hydro sources of energy (31%, 29% and 22% respectively).
Throughout the last five years Iberdrola has invested a large bulk into its network segment and as a consequence electricity distributed has been able to grow at 1.4% p.a. as the growing demand coming from LatAm markets more than offsets the lower demand in the domestic market. The same growing pattern has being achieved in the users connected to Iberdrola (2.7% p.a.).
Employing around 30,651 people across the world (figure that is still expected to reduce as a consequence of the efficiency program) Iberdrola is nowadays considered a benchmark in terms of operating efficiency.
5 Iberdrola became one of the largest utilities after the program, avoiding also the risk from takeovers. 6
Iberdrola, for instance, has used the cash considerations from the sale of Turkish renewable, Gas Natural Mexico, and Central Europe renewable, among others, to reduce its debt position.
0% 20% 40% 60% 80% 100%
Iberdrola Gas Natural
Endesa EDP Enel EDF GDF-Suez RWE Industry
Average Home International
50%
Source: Company data
Geographically diversified portfolio
Correcting previous leverage flamboyance
Figure 3: EBITDA 3Q13
per country
49%
17% 17%
6%
10% 1%
Spain United Kingdom
United States Mexico
Brazil RoW
Source: Company data; Analyst’s estimates
Table 1: Operating data
3Q13
Installed Capacity (MW) 44,866 Electricity Distributed
(GWh) 159,861 Gas Supplied (GWh) 68,309 End-users (million) 31.9 Electricity 28.3 Gas 3.6 Employees 30,651
Source: Company data
IBERDROLA S.A. COMPANY REPORT
Shareholder Structure
Iberdrola presents a dispersed ownership structure being the main shareholder Qatar Investment Authority with a mere 8.24% of the voting rights7. In 2011, Actividades de Construcción y Servicios (ACS) held the largest stake in Iberdrola (18.8%), however the losses originated by the power reform in Spain and the high indebtedness of the construction company led to the reduction of the position up until now, with the company using the funds to repay the expensive debt it had contracted when acquiring Iberdrola’s stake. The latest development on this issue was the issuance of EUR 720 million bonds convertible into
Iberdrola’s shares (up to 2% of total share capital)8, which will further disperse the ownership. Another overhanging risk is coming from Bankia’s stake (Banco Financiero de Ahorros). The recently nationalized financial institution is under strict conditions by the European Commission that impose the sale of its participations if certain conditions are met9. The company had announced the sale for the period after the third quarter earnings announcement but so far no movement has been done. We see here some benefits for Iberdrola in the long-run as potentially sounder companies replace the constrained shareholders. As the result of the integration of Energy East (now Iberdrola USA), the
acquisition of more than 10% of Iberdrola’s group stake is subject to prior
approval of several regulatory authorities in the United States. We believe this to be a major constraint in consolidating participation in the company structure thus
leaving space for new investors to enter Iberdrola’s ownership. This fact
potentially hinders the company’s ability to raise capital as shareholders will look at Iberdrola more from a return perspective rather than a strategic perspective (looking for the attractiveness of the dividend and share price movements rather than for the attractiveness of the business itself) as a consequence of the diluted stakes, being more reluctant to capital inflows into the company.
Leverage Analysis
The internationalization program (see Appendix I) started by 2001 and has been
the major driver of Iberdrola’s leverage position, as referred. The integration of Scottish Power in 2007, for a consideration of EUR 17 billion (financed 54% with debt) contributed for a 53% increase in debt (leverage reduced thanks to the capital increase for Energy East deal and proceeds from Renewable IPO). With the Lehman Brothers failure, the access to money was much more constrained making a priority for Iberdrola (and other utility companies) to deleverage.
7 Each share corresponds to one voting right. 8
The bonds were contracted with Natixis, Santader, Deutsche Bank, HSBC and Société Générale and will pay 2.625%.
9 The conditions comprise: 1) enough liquidity in the market; 2) market price above the acquisition price.
Figure 5: Shareholder
structure
Source: Bloomberg
8.24%
5.64%
5.05%
4.96%
4.80%
3.04% 3.12% 1.72% 63.43%
Qatar Inv. Authority ACS
Bankia Kutxabank
Natixis Blackrock
Société Générale Norges Bank Free-Float
Disperse ownership resulting in a difficult position to raise capital
Disperse ownership
Overhanging risk coming from
ACS and Bankia’s stake
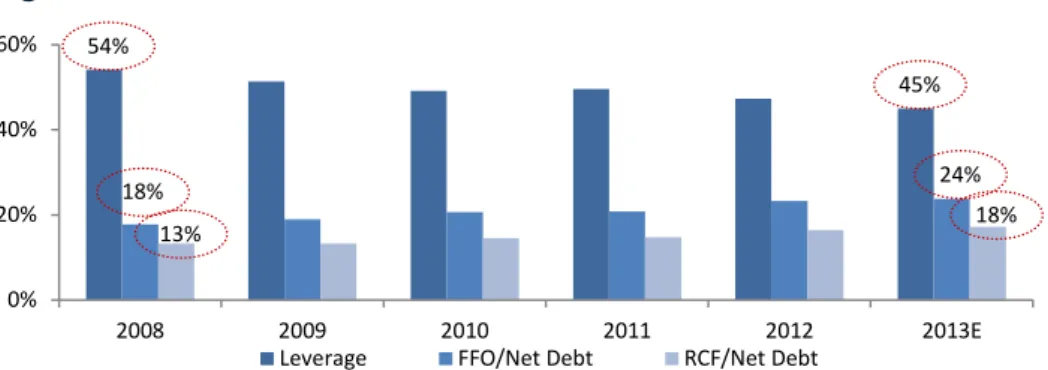
Figure 6: Financial
leverage (ex-deficit)
Source: Company data and Analyst’s
estimates
IBERDROLA S.A. COMPANY REPORT
Figure 7
: Iberdrola’s credit metrics
10Despite the focus on the improvement of the credit metrics, the ratings attributed by the three major rating agencies have deteriorated (and consequently on yield). This happened mostly due to the more demanding ratio requirements to reflect the added risk from sovereign risk. Iberdrola is rated as Baa1, BBB+ and BBB
from Moody’s, Fitch and S&P respectively, with negative and stable outlooks. A considerable part of the debt raised in the period was generated by the deficit created in the Spanish market. By 2010, debt used to finance the shortfall peaked reaching approximately 17% of the total debt or EUR 5.5 billion. With the introduction of the securitization program in 2011, the impact of the deficit on the
company’s balance sheet has reduced significantly11.
Figure 9: Tariff Shortfall and debt
Most of Iberdrola’s debt is denominated in Euros with close to half in foreign currency. This debt allocation provides a natural hedge to the international equity (a higher currency appreciation will reduce consolidated EBITDA, but also the euro value of debt). As part of its financial strategy, Iberdrola has been increasing its exposure to fixed rate debt (65.6% at 3Q13 versus 61.9% the year before) moving towards its target of 70% to optimize costs and risks. In terms of liquidity Iberdrola at this time has EUR 12,220 million of available liquidity being able to cover more than thirty months of its financing needs (40% of existing debt).
10
( ) .
At market values, leverage stands at 49% (using our valuation market capitalization).
11See section “Spanish Tariff Deficit” for more details.
0% 20% 40% 60%
2008 2009 2010 2011 2012 2013E
Leverage FFO/Net Debt RCF/Net Debt
0.0% 2.0% 4.0% 6.0% 0 2,000 4,000 6,000
2006 2007 2008 2009 2010 2011 2012 2013E
Tariff Shortfall (€ M) Leverage (from deficit; %)
Source: Company data; Analyst’s estimates
54% 18% 13% 45% 24% 18%
Source: Company data; Analyst’s estimates Utilities dragged by Spanish
downgrade
Clear commitment to deleverage
Figure 10: Debt by
currencies
Source: Company data
54%
16% 26%
4%
Euro Dollar
British Pound Brazilian Real
Figure 8: S&P rating
versus peers
Source: Bloomberg
Note: Iberian utilities are graded below average as they were dragged by the Spanish sovereign rating. Iberdrola Gas Natural EDP Endesa EDF GDF-Suez RWE Verbund E.On Fortum Enel Average BBB+ BBB BBB BB+ BBB A+ A BBB+ A- A- A- BBB CDS 0.8% 1.1 % 0.9% 1.1% 1.9% 1.7% 3.2% 0.9% 1.2% 1.0% 1.8% 4% 17% 3%
% of Gross Debt 11%
9% 12%
9%
IBERDROLA S.A. COMPANY REPORT
Strategic Outlook
As a consequence of the measures announced mid-2013, Iberdrola has decided to postpone its investor day to February 2014 as it waits for the uncertainty around the regulatory measures to dissipate. The Spanish regulator is however considering a new royal decree just for renewable policy (with no major changes estimated in the renewable hit) to avoid some legal constraints, and as such detail on this issue is only expected to be known by February 2014.
Despite this, we consider Iberdrola’s equity story to remain similar in the
upcoming years: a strong commitment in achieving the EUR 6 billion debt reduction in 2014. Management expects to achieve this positioning by 1) reducing the level of investments (expected around EUR 10.5 billion between 2012 and 2014, 37% lower than the previous three years12). At this level the focus of investments will be in countries with more regulatory visibility (42% of the investments in UK) and higher growth prospects (23% in LatAm countries). For the same reasons Iberdrola is expected to invest more into network facilities and renewable plants (59% and 25% respectively). 2) Divesting from non-strategic assets into a total of EUR 2 billion. Around EUR 1.2 billion already achieved mainly with the sale of Medgaz and of renewable assets in Central Europe. 3) And finally through a better cash flow generation resulting from lower CAPEX and improving efficiency. Currently Iberdrola is already a benchmark in terms of efficiency and we expect this to remain as more headcount reduction is expected.
Figure 13: Efficiency benchmarking
13Macroeconomic Environment
Economic Profile
According to OECD14, the world’s economy is expected to grow at a 3.4% pace driven mostly by the growth in emerging economies (non-OECD countries growth
12
See Appendix II for more details.
13 Efficiency measured in terms of operating expenses over gross margin. 14
OECD Economic Outlook (2012): Chapter 4 – Medium and long-term scenarios for global growth and imbalances. Growth values all in real terms.
38% 40% 42% 44% 46% 48%
2010 2011 2012
Iberdrola Iberian average
Emerging economies driving
the 3.4% world’s growth
Figure 11: 2012-2014 net
investments per country
Source: Company data
42%
23% 19%
16%
UK LatAm Spain USA
Figure 12: 2012-2014 net
investments per segment
Source: Company data
59% 25%
13% 3%
Networks Renewable
Generation Other
Source: Bloomberg
IBERDROLA S.A. COMPANY REPORT
expected around 6.9%). In the last decade the same aspect has been experienced, with China growing at 10.1% p.a. since 2000 (and expected to grow 7.2% p.a. in the next five years, surpassing USA’s GDP).
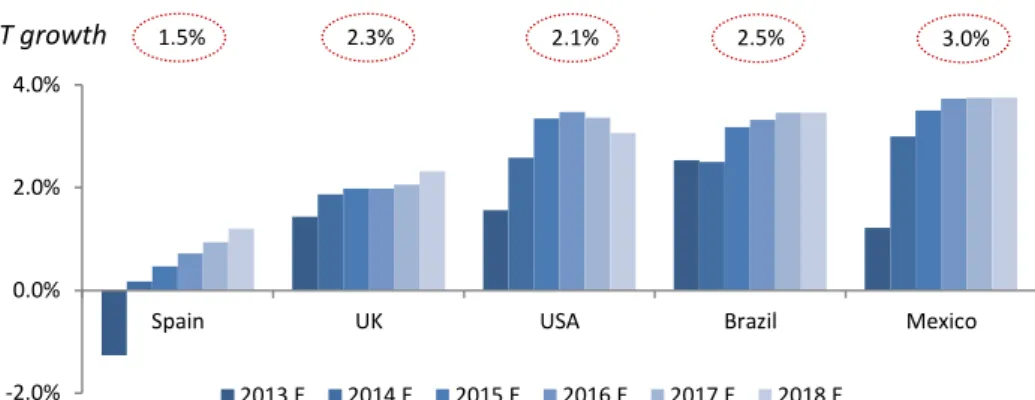
Iberdrola’s portfolio is captures part of the growth in these economies, especially in Brazil and Mexico which represent more than 15% of EBITDA15. The two economies are expected to grow at 3.2% and 3.5% in the next five years respectively. Spanish economy, on the other hand, has been in a period of economic recession with unemployment peaking at 26.88% in 2013. In the last quarter Spanish GDP was able to grow 0.1% QoQ, officially ending the two-year downturn of the sovereign crisis. Despite this, the cumulative growth for 2013 in Spain is still expected to be negative (-1.27%), starting to recover only in the following year into a 0.7% growth p.a. for the following five years. A much favorable outlook is expected from UK and USA (2.0% and 3.2% respectively).
Figure 14: GDP real growth estimates
The risk of high inflation is still expected in LatAm countries, especially in Brazil, with negative effects in business confidence and investors requiring a higher remuneration rate. Another issue that arises from the expected inflation gap between the LatAm countries and the developed countries is the depreciation of its currencies, reflecting the lower purchasing power in LatAm countries. This is a pattern already expected by the market (as shown by the futures market). These
movements have already impacted Iberdrola’s results in the 3Q13 (around EUR 150 million) and are expected to keep having a determinant impact in Iberdrola’s
results in the following years (average EBITDA impact for 2014-18 expected at EUR 299 million). Latin American countries inflation standards are not as strong as European ones, as governments are very supportive in stimulating the domestic economy enlarging their public debt figures and inflation. We do not expect this pattern to change in the short/medium-term.
15 Notice that the business in these economies is either regulated or based on long term contracts, thus will benefit less
from the demand expansion. Still we believe this position will bring growth to Iberdrola as more and better networks will be needed, and contracted production will follow closely demand as more energy must be distributed or contracted.
-2.0% 0.0% 2.0% 4.0%
Spain UK USA Brazil Mexico
2013 E 2014 E 2015 E 2016 E 2017 E 2018 E
Position in Brazil and Mexico are the main drivers for
Iberdrola’s growth
Source: IMF estimates (October 2013); OECD estimates (2012)
1.5%
LT growth 2.3% 2.1% 2.5% 3.0%
Figure 15: Target
(long-term) inflation
Source: OECD estimates (2012)
2.0% 2.0% 2.0%
4.5% 3.0%
0% 2% 4% 6%
Spain UK USA Brazil Mexico
IBERDROLA S.A. COMPANY REPORT
Table 2: End-year exchange rate projections
162012
2013
2014E 2015E 2016E 2017E 2018E
Euro-dollar 1.32 1.38 1.36 1.36 1.38 1.40 1.41 Euro-pound 0.81 0.83 0.83 0.84 0.85 0.86 0.87 Euro-real 2.71 3.25 3.50 3.51 3.55 3.59 3.62 Euro-peso 17.06 18.06 18.29 18.48 18.70 18.92 19.08Energy Demand and Supply
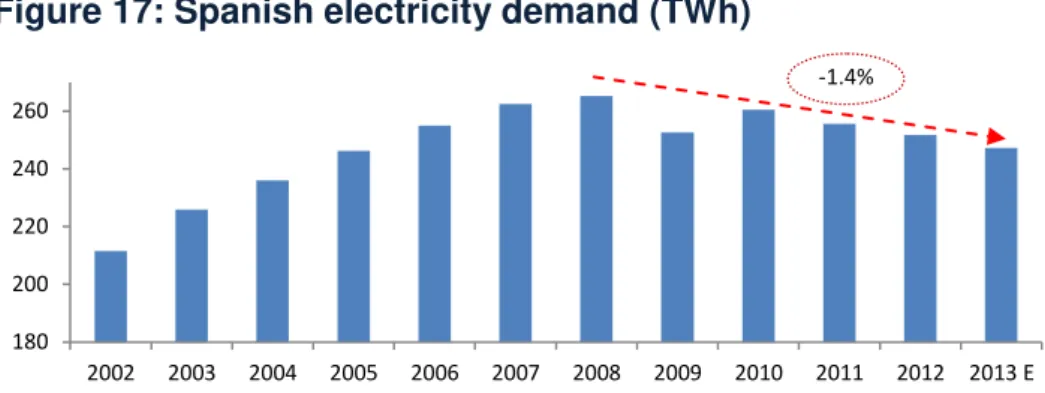
Energy demand has taken a descending path in most of economies during the last five years as a consequence of the economic downturns suffered. The Spanish market is a clear example of this event. We expect electricity demand in 2013 to achieve 247,285 GWh, values only matched in 2005. The Portuguese electricity market should also be considered in the analysis as it represents 13% of the total electricity supplied in Iberia. Here the trend is thinner, with demand reaching 50,300 GWh in 2013 after a 1.8% cumulative decline since 2008.
Figure 17: Spanish electricity demand (TWh)
Demand shows a positive relation with the overall economy growth, mostly as a consequence of industrial consumption. Though this not the only trend in the electricity market. The concerns about energy wasting and efficient use of energy in EU and the establishment of the 20% target reduction of primary energy consumption is a major conditioner to the electrical demand growth. We expect Iberian demand to grow 0.2% p.a. in the next five years (a much lower growth than the one expected for the economy). An additional constraint into the Spanish demand is the effect of the Royal Decree 9/2013 as it requires end-users to contribute to the deficit reduction via increased tariffs.
The same conditions are expected from the British market as it is also subject to
the EU’s energy directives. We expect the British demand to grow at 0.5% in the
next five years, gradually decoupling from the GDP growth. As for Mexico we expect energy efficiency practices to be far from now (as concerns are more focused towards the availability of energy for all population) thus Mexico should
16 Using Chicago Mercantile Exchange Futures (at 03/01/2014) as a reference and assuming no arbitrage opportunities.
180 200 220 240 260
2002 2003 2004 2005 2006 2007 2008 2009 2010 2011 2012 2013 E
Source: Bloomberg
Figure 16: Spanish GDP
and demand relation
Source: IMF, REE and Analyst’s estimates
-6% -4% -2% 0% 2% 4% 6% 8%
2003 2005 2007 2009 2011 2013 E
GDP growth Demand growth
Figure 18: British GDP
and demand relation
Source: IMF, Gov.uk and Analyst’s estimates -6%
-4% -2% 0% 2% 4% 6%
2003 2005 2007 2009 2011 2013E
GDP growth Demand growth
Electricity demand in 2013 expected to reach 2005 values
-1.4%
IBERDROLA S.A. COMPANY REPORT
experience a much higher growth in demand (expected to grow annually by 3% during the next five years)17.
As for supply we expect the trend in the last years to remain the same. The EU’s
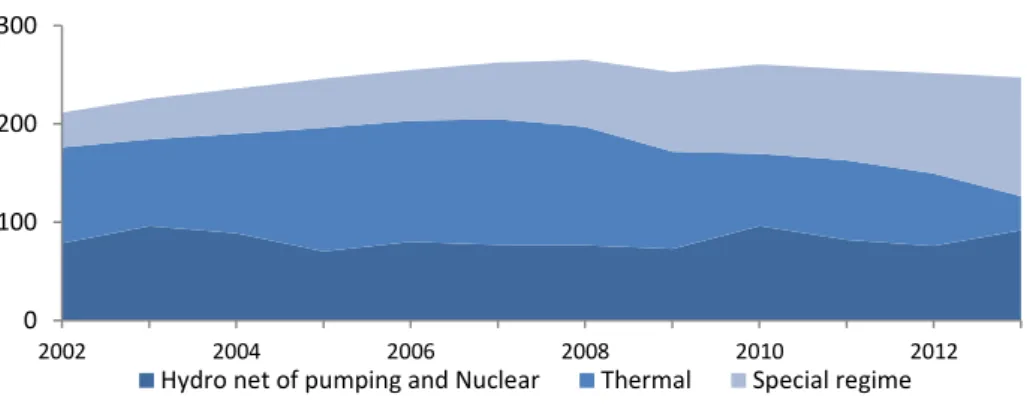
directives for reaching 20% of energy consumption from renewable sources at 2020 imply a renewable weight of 34%18 in total electricity generation output by that period. A movement towards this objective has already been pursued in Spain and Portugal, with renewable energy already achieving 32% in 2013E (72% in Portugal). On the other hand thermal generation has reduced dramatically (-5.2% annually) reducing the viability of those power plants.
Figure 20: Spanish electricity generation (TWh)
As a consequence of this market and regulatory trend we expect capacity coming from thermal sources to reduce in the coming years as low load factors (which are expected to remain due to the excess capacity observed in Spain and due to a slow recovery of demand) make the plants unprofitable. By 2018 we expect that 37% of Spanish capacity to be base on renewable sources and thermal to gradually reduce to 30% (from 36%).
In the United Kingdom the presence of renewable energy is not yet fully in place as it currently only represents 9% of the total energy produced (the largest bulk comes from coal – 37% - and CCGT – 28%). In the UK it is required a lot of investments by the companies to secure the availability of energy, making thermal energy more recommended due to its stability in output. However, regulatory policies have been recently implemented in order to incentivize the use of clean plants (see “Renewable Environment” and “Renewable Business” section). Thus we expect by 2018 thermal output to reduce 15% from 2012 values, being substituted by renewable production (target renewable energy by 2020 of 30%, including hydro and cogeneration). Moreover several old coal and
17 The American and Brazilian markets are not considered in this analysis as Iberdrola is not directly exposed to the
energy demand of those countries (network business is regulated and special regime enters always in the market, independently of demand).
18
Other sectors like transportation are expected to have a weight much below 20% hence the higher weight on electricity production. Source: EDP – DPE.
0 100 200 300
2002 2004 2006 2008 2010 2012
Hydro net of pumping and Nuclear Thermal Special regime
Figure 19: Mexican GDP
and demand relation
Source: IMF, Secretaría de Energía (SER) and
Analyst’s estimates
-6% -4% -2% 0% 2% 4% 6% 8%
2003 2005 2007 2009 2011 2013E
GDP growth Demand growth
Source: REE and Analyst’s estimates
Figure 21: Spanish
capacity mix
Source: Analyst’s estimates
0% 20% 40% 60% 80% 100%
2012 2018E
Hydro Nuclear Coal
CCGT Cogeneration Renewable
IBERDROLA S.A. COMPANY REPORT
nuclear plants are expected to retire by the end by 202019.
In non-OECD countries, the generation mix is expected to be satisfied mostly by hydroelectric power20. Currently gas is the main input in Mexico’s production, but we expect hydro technology to have the highest expansion in the coming years. In Mexico the interconnection Agreement for renewable sources (required for private generators to connect to the grid) was set to promote renewable energy and incentives started to be provided, like accelerated tax depreciation. Renewable targets in this country are set at 35% for 2024 however there are no sanctions if not met, thus we do not expect such rapid shift in production mix.
Power Prices
Most of Iberdrola’s generation output is originated by renewable sources (including hydro). These technologies only comprise fixed costs as no primary energy input is required, thus not relying in the commodity prices. The profitability of such plants depend however from the price movements of commodities, as they are (most of the days) the marginal technology determining both baseload and peakload power prices (see appendix III). This effect is clearly shown in the
relative performance of Iberdrola’s stock and natural gas commodity price.
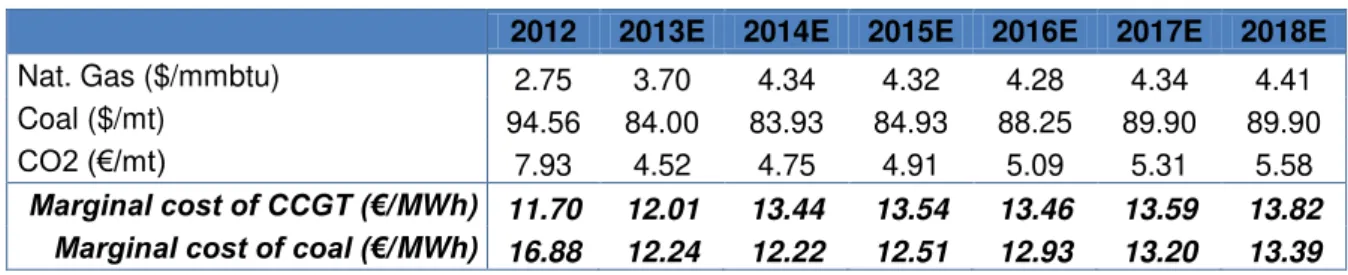
Historically in Spain, coal has been marginally more expensive than natural gas as a result of the CO2 prices. However in Spain national coal is subsidized putting coal ahead of gas in the merit curve. For the future we expect marginal cost of coal to fall below the natural gas as production of natural gas in Europe continues to decline (leading to higher prices21) and CO2 prices keep flat in 2014 (recovering only afterwards as we expect a rationalization of allowances - backloading). Overall, we do not expect a shift in the marginal technology (in Spain and UK), as coal remains less expensive than natural gas.
Table 3: Power price forecasts
222012 2013E 2014E 2015E 2016E 2017E 2018E
Nat. Gas ($/mmbtu) 2.75 3.70 4.34 4.32 4.28 4.34 4.41
Coal ($/mt) 94.56 84.00 83.93 84.93 88.25 89.90 89.90
CO2 (€/mt) 7.93 4.52 4.75 4.91 5.09 5.31 5.58
Marginal cost of CCGT (€/MWh) 11.70 12.01 13.44 13.54 13.46 13.59 13.82
Marginal cost of coal (€/MWh) 16.88 12.24 12.22 12.51 12.93 13.20 13.39
19
A new nuclear plant is being built by EDF, but will only enter in function by 2023. Source: Timera Energy.
20 Source: EIA’s Energy Outlook (2013). 21
A more intensive exploration of shale gas would lead to a shift in the marginal technology to coal. However we believe that an intensive exploration of shale gas in Europe is less likely (than in US for instance) given the high population density. Additionally we consider that this scenario is already imbedded in futures market price (with a certain probability).
22 Considering that one mmbtu converts to 293 KWh and one coal mt to 8141 KWh. In the forecast we used commodity
futures price: Nat. Gas and Coal Future from Nymex Exchange; CO2 Futures from the European Energy Exchange. We exclude fixed costs from this analysis as most of the cost in these technologies arises from fuel prices (see Appendix IV).
Figure 23: Stock
performance vs natural
gas price (€/mmbtu)
Source: Bloomberg
0 50 100 150 200 250
Iberdrola Natural Gas
We expect natural gas price to drive wholesale prices in Spain and UK
Source: Bloomberg and Analyst’s estimates
Figure 22: British
generation mix
Source: Analyst’s estimates
0% 20% 40% 60% 80% 100%
2012 2018E
Coal Gas
Nuclear Hydro
Renewable Cogeneration
IBERDROLA S.A. COMPANY REPORT
We estimate Spanish average wholesale price to reduce in 2013 achieving 41
€/MWh (from 47 €/MWh in 2012). The main catalysts here are the reduction of commodity prices, the increase of renewable energy in the production mix, excess capacity and the mild recovery of demand. For the period afterwards electricity prices should start to recover as renewable production stabilizes and fuel prices increase.
In UK the story is slightly different has there is no problem of overcapacity due to the overshoot of renewable and CCGT plants. In 2012, thermal facilities were still responsible for satisfying 68.5% of the total electricity demand. Average wholesale price in UK has been increasing since the commodity price slump in 2008 and is still expected to increase as commodity prices (namely gas) continue to pick up. In the long-run we forecast it to reduce as pressures coming from renewable production increase23.
Spanish Tariff Deficit
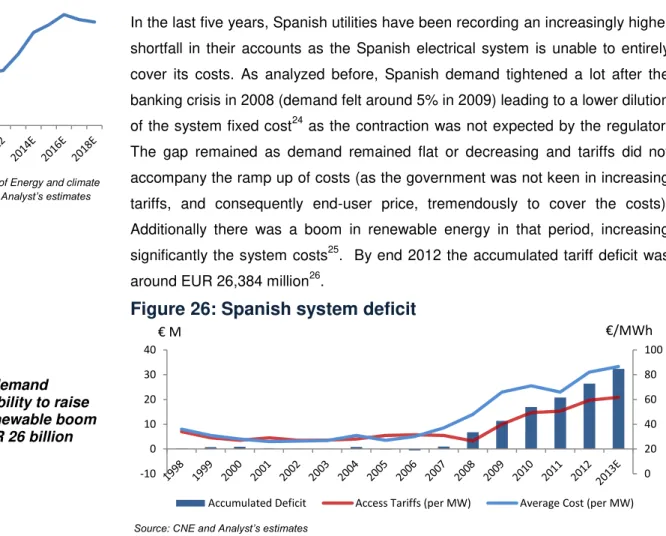
In the last five years, Spanish utilities have been recording an increasingly higher shortfall in their accounts as the Spanish electrical system is unable to entirely cover its costs. As analyzed before, Spanish demand tightened a lot after the banking crisis in 2008 (demand felt around 5% in 2009) leading to a lower dilution of the system fixed cost24 as the contraction was not expected by the regulator. The gap remained as demand remained flat or decreasing and tariffs did not accompany the ramp up of costs (as the government was not keen in increasing tariffs, and consequently end-user price, tremendously to cover the costs). Additionally there was a boom in renewable energy in that period, increasing significantly the system costs25. By end 2012 the accumulated tariff deficit was around EUR 26,384 million26.
Figure 26: Spanish system deficit
23
Mexican’s power prices are also estimated to increase as gas prices increase. Notice that this country operates under a
PPA agreement, where the prices are set for a longer period. However we consider that prices should follow the market to avoid default from the counterparty.
24 Most of system costs, like distribution and transmission remunerations, are fixed and established each year. 25
The renewable premium over wholesale price is supported by the system.
26 Figure excluding securitization efforts.
0 20 40 60 80 100
-10 0 10 20 30 40
Accumulated Deficit Access Tariffs (per MW) Average Cost (per MW)
Figure 24: Spanish
average wholesale price
(€/MWh)
Source: EDP –DPE, OMEL and Analyst’s estimates
30 40 50 60 70
Figure 25: British
average wholesale price
(£/MWh)
Source: Department of Energy and climate
Change (DECC) and Analyst’s estimates
30 40 50 60 70 80
Source: CNE and Analyst’s estimates Unexpected demand
decrease, inability to raise tariffs and renewable boom led to the EUR 26 billion deficit
IBERDROLA S.A. COMPANY REPORT
During 2011 concerns about the sustainability of such system started to be raised as Spanish public deficit aggravated. Regulators were committed on reducing system costs and avoid the increase in tariffs even further (Spanish users already pay on average more 27.6% per KWh than the average EU citizen27). However, until this year, no considerable change had been implemented with Spanish government withdrawing some contributions throughout the period (as it happened with the withdrawn of the EUR 3.6 billion contribution for 2013).
Major changes only occurred in 2013 with the application of RD 15/2012 and RD 9/2013 (see appendix V for more details). The latest one, the most aggressive, was expected to reduce the annual differential by around EUR 4.5 billion: 1) EUR 2.7 from the reduced remuneration of utility companies; 2) EUR 0.9 billion to be included in the state budget (concerning non-mainland costs); 3) and EUR 0.9 billion to be paid by costumers via the increase of tariffs (tariffs should adjust to expected deficit). Additionally it was proposed a EUR 2.2 billion credit line from the government. However, the Spanish Senate has removed all state contribution for the system in 2013 (a total EUR 3.6 billion contribution). In our figures we expect the deficit to reach a EUR 3.7 billion in 2013.
With the implementation of these measures, there is a good improvement of costs, being the system able to break-even by 2017 (assuming the EUR 900 million contributions for non-mainland costs from 2014 onward still holds – see appendix VI). The main drivers here are the generation taxation and renewable remuneration (expected to reduce 22% yoy in 2014). Full details in this side of regulation are still not available, however we do not expect large changes in the cuts expected for renewable companies (estimated at EUR 1.5 billion p.a.). These changes have mixed effects on Spanish utilities as the system gets more efficient (with companies able to remove the deficit from their balance sheet) at the expense of lower returns (higher taxation) to the utilities themselves. Overall we see consider it as positives since the regulatory risk from deficit dissipates. To eliminate the accumulated deficit the Spanish government as established a securitization vehicle, Fondo del Amortización del Deficit Electrico (FADE)28. In total it was already transferred to FADE EUR 18 billion of the cumulated deficit. Iberdrola is entitled by regulation to finance 35% of the shortfall or EUR 10,530 million of total cumulative tariff deficit for 2013. Part of this was already
27 In Europe, production mix are very disperse (in France 82% comes from nuclear; Portugal 97% from renewable incl.
hydro; Poland 84% from coal; Netherlands 89% from natural gas). Spain is among the countries with the highest renewable share (with 40% versus 18% of EU-27 average) which are more costly than traditional technologies. This cost is not incorporated in the wholesale price but goes to the system being latter on passed to the end-user (or to the deficit). Source: Eurostat – Key figures on Europe 2012.
28
FADE works as a vehicle to finance the regulatory receivables via capital markets, having the guarantee of the Kingdom of Spain.
Table 4: Contribution to
deficit financing
Contribution
Endesa 44% Iberdrola 35% EDP - HC 6%
E.On 1% Gas Natural 14%
Total 100%
Source: FADE
Figure 27: European
end-user prices (€/KWh)
Source: Eurostat Note: Prices before taxes.
0.1 0.15 0.2
2008S2 2010S1 2011S1 2012S1 2013S1
EU Spain
Tariff deficit to reach EUR 3.7 billion
IBERDROLA S.A. COMPANY REPORT
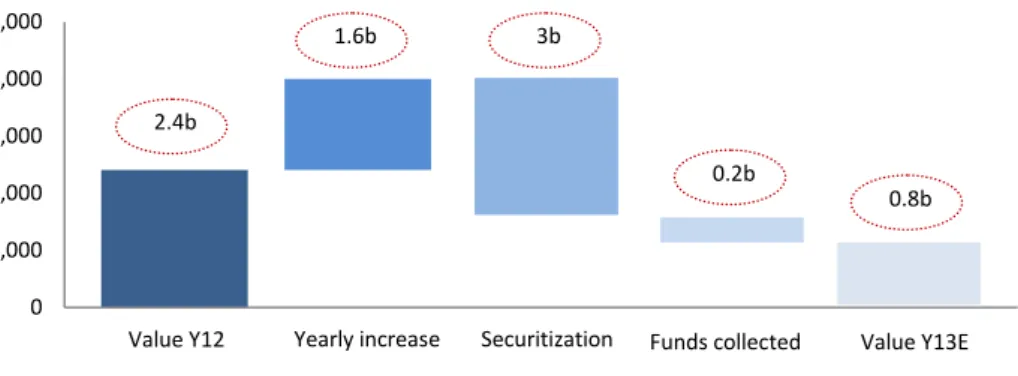
transferred into FADE (around EUR 7,729 million29) and another part already collected (EUR 1,908 million), being expected to remain EUR 831 million in 2013
in Iberdrola’s books (from EUR 2,409 million in 2012). The Spanish government has increased the guarantees for securitization to EUR 26 billion, however, under the current policies, the need for additional securitization is diminished and we do not include in our analysis any further securitization.
Figure 28
: Iberdrola’s revenue shortfall evolution
(€ M)
Renewable Environment
Renewable consumption in the world has experienced a huge expansion in the last ten years (more than tripled) with European countries on the front of the expansion. This happened mostly due to the support from governing bodies for these technologies. In Europe it was established for 2020 three main objectives regarding energy policy: 1) reduce the CO2 emissions by 20%; 2) increase the renewable share in production to 20%; 3) and reduce by 20% the primary energy consumption (not binding policy). Additionally, incentives for companies to invest in this segment were established by local governments30, as renewable energies were not (and still are not) competitive against conventional sources of energy31. We still expect the market to grow though at a more moderate level. In Spain, around 32% of energy is already supplied by renewable sources so we don’t
expect much more growth coming from this market anymore (we estimate renewable output annual growth of 1% as demand recovers slowly and load factors stabilize). The same does not hold for the UK as renewable sources are currently only responsible for 9% of total energy supplied. With the purpose of increasing that figure, the UK government has implemented further incentives for investments in non-polluting sources, like the carbon price floor (extra payment for CO2 emissions) and the renewable obligation certificates (ROCs32). We
29 Source: company data and FADE. 30
In Europe mostly through fee-in tariffs, that is, each MWh is remunerated at a fixed tariff established as a spread to the average wholesale price.
31
See appendix IV for the cost comparison between technologies.
32 Renewable Obligation Certificates: for each MWh supplied, the company must hold a number of renewable certificates.
0 1,000 2,000 3,000 4,000 5,000
Source: Company data and Analyst’s estimates Net tariff deficit for Iberdrola
expected to reduce to EUR 831 million
Figure 29: Renewable
world consumption (TW)
Source: BP
0 50 100 150 200 250
2002 2005 2008 2011
14.6%
…and is still a growing…
Renewable was a growing
driver…
2.4b
1.6b 3b
0.2b
0.8b
IBERDROLA S.A. COMPANY REPORT
expect UK’s renewable output growth to be around 8%, reaching the 30% target in 2020 (including hydro and cogeneration). In the US there are also targets for renewable energy per State33 but on average less demanding. Energy Information Administration (EIA) expects renewable energy share in US to be around 16% in 2040 (from 13% in 2011) as technologies get more economic and their costs decrease. With this it is expected a moderate growth around 3.3% p.a. However there is a growing concern in this segment, especially in the more mature countries (in terms of energy markets), regarding the over cost of renewable energies. The EU program to invest in renewable energies together with weak growth in disposable income has increased pressure in households’
bills. This conflict generated debates about the affordability of the energy policy, especially in countries with power prices expected to increase. In Spain measures have already been considered to reduce renewable remuneration as part of the tariff deficit solution. We consider that there is also potential risk that other countries might follow the same route. Reducing feed-in tariffs, increasing taxes on the sector or reducing other regulated remunerations are some of the possible ways that governments have to fight the over cost tendency. This will particularly harm companies highly exposed to the renewable market.
Iberdrola has positioned itself as the world leader in wind energy (14 GW installed capacity – CAGR of 8.7%) and over the years has taken advantage of the huge sector growth (renewable EBITDA growing at 36.6% per year). This makes the company extremely exposed to this regulatory uncertainty, especially in Spain. Just in Spain Iberdrola is responsible for around 18% of the total installed capacity in renewable energy. We deem regulatory policies over
renewable energy as extremely important for Iberdrola’s value. To comprise this
risk inherent in Iberdrola’s value we included in our valuation model a scenario where more regulatory intervention would occur, especially in the renewable sector (see section “Alternative Scenarios”).
Business Forecast
Network Business
The network business comprises all regulated activities of Iberdrola, including both transmission and distribution of electricity in Spain, UK, USA and Brazil. This is the most relevant sector for the company in terms of EBITDA and fair value. Currently it holds 1,044,220 km of power lines (96.6% low voltage) and is responsible for distributing 210,622 GWh of energy. Under this segment, a large part of earnings arise within the domestic market (35.7% in 2012), however this
33 These values range from 15% in Arizona by 2025, to 40% by 2030 in Hawai.
Figure 32: Renewable
capacity share in Spain
Source: Company data and Analyst’s estimates
18%
18%
7% 6% 3% 1% 47%
Iberdrola Acciona
EDPR Enel Green Power
Gas Natural E.On
Others
Figure 30: Renewable
growth outlook
Source: IEA World Energy Outlook 2012, EIA
and Analyst’s estimates
1.60% 2.70%
0% 5% 10%
Non-OECD Latin America Middle East Asia OECD UK USA Spain
Figure 31: Iberdrola
Renewable EBITDA (€ M)
Source: Company data
0 500 1000 1500 2000
2002 2005 2008 2011
36.6%
IBERDROLA S.A. COMPANY REPORT
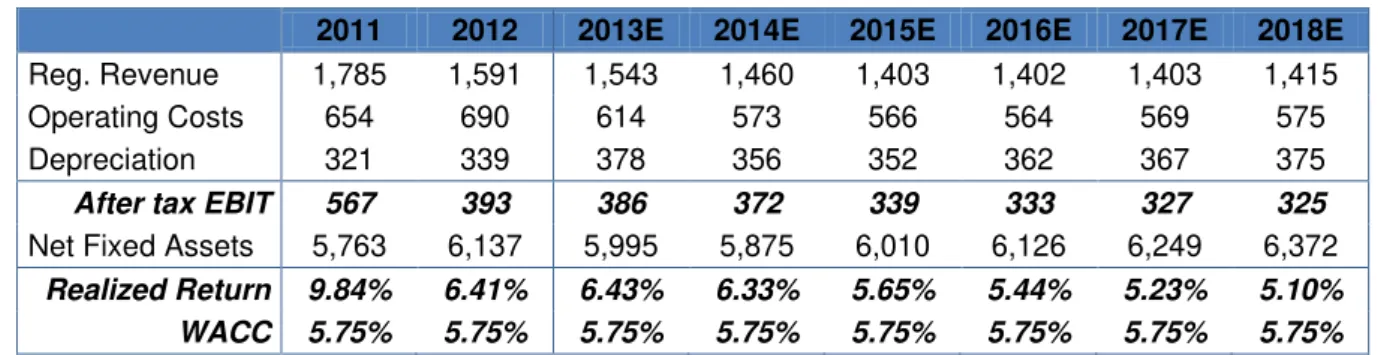
figure has been decreasing due to regulatory cuts and higher investments outside Spain. For 2012-2014 the expected investment is around EUR 6,150 million from which EUR 5,400 million will be allocated to international markets (mostly UK and USA). The strategy is to invest in countries where the regulatory environment is more stable, as opposed to the macroeconomic outlook in Spain. As a regulated business, operating income in each country is determined by the regulator. In the Spanish case the entity responsible for regulation and supervision of the energy sector is Comission Nacional de Energia (CNE). According to this entity, remuneration of energy distributors is based on a reference network model34. This implies remunerating three items: 1) investments; 2) costs necessary to operate; 3) and costs occurred to maintain the assets. The remuneration is established for a regulatory period of four years, being updated each year by the CPI and IPRI35 and for the new investments made. Additionally there is also a yearly incentive on quality and losses. With the introduction of RD 9/2013 by mid-2013 the remuneration scheme for distributors was reduced, being investments remunerated at the yield of Spanish 10 year government bonds plus a 200 bps spread (currently 6.5% pre-tax return). In our estimates revenues are reduced by EUR 155 million in 2014 (versus company guidance of EUR 115 million). As a consequence of the announced cuts Iberdrola is focused on cost cutting: 1) reducing workforce; 2) lower contractor costs; 3) and re-engineering processes. These pillars were established during the last investor day and we expect Iberdrola to keep the same focus on cost cutting. In our analysis we assumed RAB decreasing in 2013 as a consequence of the low investments in Spain and the assets revaluation36, reaching an operating income of EUR 386 million in 201337. Under this regulation efficiency plays an important role (we assumed an EBITDA margin varying between 75.7% and 74.3% throughout our explicit horizon) to achieve returns above cost of capital.
Table 5: Income forecasts for Networks Spain (€ M)
2011 2012 2013E 2014E 2015E 2016E 2017E 2018E
Reg. Revenue 1,785 1,591 1,543 1,460 1,403 1,402 1,403 1,415
Operating Costs 654 690 614 573 566 564 569 575
Depreciation 321 339 378 356 352 362 367 375
After tax EBIT 567 393 386 372 339 333 327 325
Net Fixed Assets 5,763 6,137 5,995 5,875 6,010 6,126 6,249 6,372
Realized Return 9.84% 6.41% 6.43% 6.33% 5.65% 5.44% 5.23% 5.10% WACC 5.75% 5.75% 5.75% 5.75% 5.75% 5.75% 5.75% 5.75%
34
This is a model that maps, for all Spanish territory, the power lines needed and the necessary costs to operate them.
35 Consumer Price Index and Manufacturing Price Index. 36
We considered as a proxy to RAB, total operating fixed assets as no disclosure was provided.
37 This figure excludes other revenues as well as levies and capitalized staff costs.
Most important segment for Iberdrola
International presence is gaining importance
Figure 33: Remuneration
approach in Spain
Source: BOE and Analyst’s research
Revenue
“Fair Return”
Asset Base
X
=
+
Depreciation
+
Estimated Op. Costs
Squeezed returns following new regulation
IBERDROLA S.A. COMPANY REPORT
In UK, Iberdrola faces a much more stable outlook than in the Spanish one. In this market Iberdrola operates through SP Manweb and SP Distribution (two distribution companies) and SP Transmission (transmission business). It currently manages around 118,116 km (mostly low voltage) over a 38,410 km2 and 3.4 million of supply points. The main regulator in this market is the Office of Gas and Electricity Markets (OFGEM). The current remuneration policy for distributors is based on RPI-X which attributes a remuneration based on the costs of an efficient network operator, capital programme required and a target return with yearly updates at inflation (RPI in UK’s case)38. The remuneration was established in 2010 at 4.7% (real before tax) for a period of five years. A new regulatory period, RIIO ED1, is already being discussed. RIIO model is similar to the RPI-X with the exception of the introduction of a longer amortization period for new assets (from 20 years to 45 years)39. We estimate a real remuneration before tax for Scottish Power around 4.2% (10% lower than under RPI-X)40 under this policy, based on lower forward average interest rates. Unlike Spain, UK is a very stable market with no large changes in policies and with long regulatory periods (eight years for RIIO). Iberdrola expects to invest around EUR 2,290 million in this country mostly in the transmission network with the development of a subsea cable between Scotland and England. Moreover, RIIO requires a huge capital investment. According to the business plan sent to OFGEM, Iberdrola plans to invest during that period a total of £ 5,155 million (we assumed a lower figure of EUR 652 million per year). With this we estimate RAB to reach £ 4,604 million (+15% than 2012) driven by the increase in transmission business RAB (+23%). At EBITDA level, we forecast a 1% annual growth (in £) propelled by RIIO investments with margins ranging from 76.6% to 75.0% in 2013-18.
The third most relevant regulated market for Iberdrola is the USA. In this country Iberdrola operates mostly through New York State Electric & Gas Corporation (NYSEG) and Rochester Gas and Electric Corporation (RG&E), companies that distribute both electricity and gas, and Central Maine Power (CMP), mostly electricity transmission. Currently it distributes 31,573 GWh of energy to over 2.4 million customers and 120,672 km of power lines. The regulatory environment in US is also very stable like in UK. The tariffs for distribution companies in New York have been set in 2010 for a period of three years and four months, that is, until end 2013. During this period companies were remunerated at a 10% ROE. We extended this remuneration scheme for our explicit horizon as Iberdrola has the right to expand the tariff agreement further in 2014. For the transmission business in Maine, the same methodology is used but under a different ROE.
38 It is a similar methodology to the Spanish one. 39
The regulatory period will be a transitory period for this policy.
40 Value based on Western Power Distribution draft already published by OFGEM.
Table 6: RIIO regulation
RPI-X (A) RIIO (E) Regulator OFGEM OFGEM Period 2010-15 2015-2023 Cost of debt 3.60% 2.90% Cost of equity 6.70% 6.70%
Leverage 65% 65%
Tax rate 24% 24% WACC (after
tax) 4.0% 3.8%
WACC (before
tax) 4.7% 4.2%
Source: OFGEM and Analyst’s research
Note: Rates in real values and GBP.
Large investments expected due to RIIO-ED1
Stable environment in UK
Figure 35: US regulatory
method
Source: Analyst’s research
Net Income
Regulated ROE
Asset Base
X
=
X
Equity ratio
Figure 34: UK RAB and
EBITDA evolution (£ M)
Source: Company data and Analyst’s estimate
650 700 750 800 850
0 2,000 4,000 6,000 8,000
2011 2013E 2015E 2017E Distribution Transmission EBITDA
IBERDROLA S.A. COMPANY REPORT
CMP currently receives a 12.89% ROE (11.14% base ROE, 0.5% NETO and 1.25% incentives). During 2011 some state officials filed a complaint on the excessive remuneration for transmission companies requesting a 1.4% reduction on ROE. This litigation however will only be resolved by early 2014. In the meanwhile, CMP has already filled a request for a new tariff agreement for the next five years. During our analysis we considered the drop in the remuneration rate as we believe the current rate to be unsustainable. During the latest investor day, Iberdrola has announced a total net investment in US of EUR 1,585 between 2012 and 2014. The investment is mainly on the development of
Maine’s connection with Canada (expected to total $ 1.4 million). We include these figures in our analysis reaching a RAB increase of 11.5% in 2013 mostly driven by the increase in transmission assets. We see growth potential for Iberdrola in the US market, especially in the transmission business, given its substantial remuneration for capital (we estimate cost of equity for this market around 6.78%, much lower than the actual remuneration). Considering our estimates of regulated asset, and incorporating management’s target NOE/GM41 ratio of 34% for 2014 (5.5% lower than in 2012), reaching an EBITDA of EUR 729 million in 2014 (10% higher than in 2012).
Brazil has been the fastest growing country within Latin America (growing at 2.6% p.a. in real values in the last five years) and Iberdrola has been able to explore this with its participation in NeoEnergia (owns 39%) and Elektro (acquired 100% in 2011 to enlarge the presence in this country and integrate with NeoEnergia42). Total energy distributed by the company has increased 5% per year in the last five years reaching 49,006 GW in 2012, growth that has not been totally accompanied by EBITDA (+0.6%) due to the increase in operating costs (+15%)43. During this year, companies have also been penalized by the drought as costs to buy energy (which is pass-through) were higher than the ones set by the regulator. These differences will be repaid in 201444. Between 2009 and 2011, 5.8% of investments were directed to Brazil. This figure has tripled (15%) for the period between 2012 and 2014, showing the clear focus of Iberdrola’s
investment in LatAm countries for growth. The regulatory system in Brazil is based on a price-cap framework and is set by Agência Nacional de Energia Elétrica (ANEEL). Each regulatory period lasts for four or five years depending on the concession. During the third cycle of periodic tariff reviews, ANEEL reduced the after tax remuneration rate from 9.95% to 7.5%, reflecting a lower risk
41
Net Operating Expenses over Gross Margin.
42 This move was blocked by the remaining shareholders of NeoEnergia (Banco do Brasil and PREVI, a pension fund of
Banco do Brasil). Iberdrola considered at that time the sale of NeoEnergia, but recently it has pointed the strategic importance of Brazil, as such we disregarded that scenario.
43
Values adjusted for the consolidation of Elektro.
44 Companies can ask ANEEL for an early tariff review due to extraordinary events.
Growth potential, with high compensating returns
Figure 37: Regulatory
framework in Brazil
Source: Company data and Analyst’s research Note: Nominal remuneration and in BRL.
Remuneration
- After tax allowed
remuneration reduced to 7.5%
Costs
- Based on a benchmark model: direct comparison of companies costs
Quality Factor
- Frequency and duration of interruptions
Asset Base
- Assets in beginning of cycle plus investments and D&A
Figure 36: US RAB and
EBITDA evolution ($ M)
Source: Company data and Analyst’s
estimates
0 600 1,200
0 2,000 4,000 6,000 8,000
2011 2013E 2015E 2017E
Transmission Distribution
EBITDA
IBERDROLA S.A. COMPANY REPORT
premium (below our cost of capital estimate). To counteract this negative effect, Iberdrola has launched an efficiency plan in Elektro, positioning the company
among the most efficient ones for ANEEL’s benchmark model. Given Iberdrola’s
investment plan in Brazil, we estimate RAB of distribution companies to increase 2.6% per year during the next five years. Iberdrola also holds stakes in generation facilities (mostly hydro and CCGT – non regulated facilities), being currently attributable to Iberdrola 744 MW (expected to more than double by 2018). We forecast an average EBITDA margin of 25.6% throughout our explicit horizon (300 bps higher than 2013). From 2014 onwards, NeoEnergia will be equity consolidated as a consequence of accounting policy IFRS 11 (from proportionally consolidated). This will be the most relevant event to affect
Iberdrola’s income for 2014 (with no effect on valuation). We estimate a cut of 48% (reaching R$ 1,034) in 2014 for the Brazilian unit (5.6% at the group level). Comparing the several regulations that Iberdrola is exposed to, we can see that the American one is the most advantageous one, that is, with the highest regulatory return. However, considering our own estimates of WACC for US (4.89%), we consider that this regulation is not sustainable hence we consider the complaint followed by state officials to reduce the remuneration as a very likely scenario in the short term (if reduced by 1.4%, regulated remuneration would drop to 6.4%, still above our estimate of WACC). The british regulation presents also an attractive environment for Ibedrola with remuneration above its WACC, being the RIIO’s investments able to create value. The current Spanish remuneration on the other hand is below our estimates of WACC, thus destroying
value and corroborating Iberdrola’s decision of lower investment in this country.
Generation and Supply Business
This business segment comprises the production of electricity through ordinary regime plants (hydro, nuclear, coal and gas) and the supply of both electricity and gas to end-users. Since 2011, Iberdrola has bundled its generation and supply businesses in Spain, UK and Mexico into one single bucket to achieve efficiency gains from the synergies between countries. However this measure has not been enough to counteract against the pressure upon margins (especially in Spain and UK). With the large slump in demand after the 2008’s crisis and consequent reduction of power prices, generation units suffered a huge fall in their earnings
(Iberdrola’s generation EBITDA reduced by 9.7% in 2009). The last couple of years haven’t been very favorable as well, especially for the more mature
markets (in Iberdrola’s case Spain and UK), with regulatory taxation increasing around 77% this year only. Additionally, in Spain, overcapacity has been an issue due to the renewable energy boom. In sum, we are assisting at a business increasingly less attractive in mature markets with margins totally squeezed.
Figure 38: Brazil RAB
evolution (R$ M)
Source: Company data and Analyst’s estimates
0 1,000 2,000 3,000 4,000
2011 2013E 2015E 2017E
Elektro NeoEnergia
Figure 39: Evolution of
generation levies (€ M)
Source: Company data
0 200 400 600 800 1,000 1,200
77%
Table 7: Comparison of
regulations in €
Regulated WACC (after tax)
Spain 4.55%
UK 4.80%
US 7.08%
Brazil 4.33%
IBERDROLA S.A. COMPANY REPORT
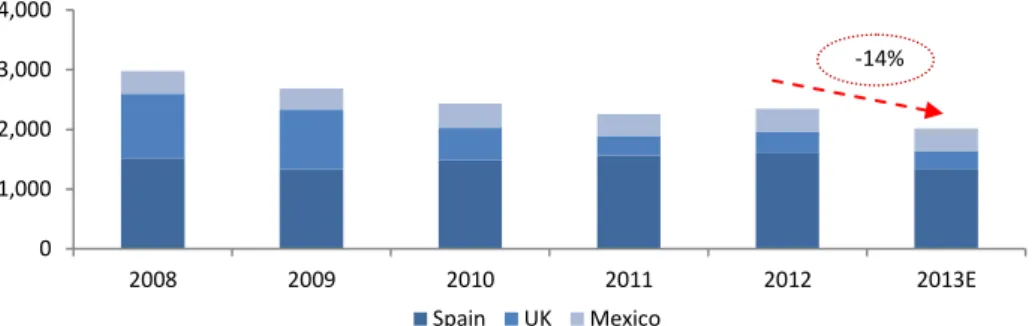
Figure 40: Generation and Supply EBITDA breakdown
(€ M)
Currently Iberdrola owns a total of 29,850 MW of installed capacity (19,378 MW in Spain, 4,865 MW in K and 5,607 MW in Mexico). Most of energy produced by Iberdrola in Spain comes from low carbon energies (hydro and nuclear) while on the other markets Iberdrola is more expose to the emitting CO2 energies (almost 90% of installed capacity in UK and Mexico comes from coal and/or CCGTs). In October Iberdrola has inaugurated a 2.2 GW hydroelectric plant located in Valencia, the largest pumping in Europe. In the medium term the company also expects to develop an additional 1.9 GW CCGT plant in UK but apart from that
no other large investments in capacity are forecasted (management’s guidance
for investment between 2012 and 2014 is smaller, EUR 1,370 million).
Looking in more detail into the Spanish market, the current year has been dramatic. The implementation of RD 15/2012 and RD 9/2013 (discussed previously) have impacted third quarter earnings by around EUR 363 million and we expect to reach the EUR 678 million in 2014 (EUR 539 million for the RD 15/2012 and EUR 139 million for RD 9/2013). Regarding the generation side, we estimate a moderate 1% annual growth for production in the next five year period (reaching 46,809 GW in 2018) as thermal load factors are kept at low values (consequence of the overcapacity in the market) and renewable load factors stabilize. This implies a stable generation market share for Iberdrola, around 25% (historically this market share has varied as a consequence of the lower/higher hydro output, being only partially compensated by the higher thermal output).
0 1,000 2,000 3,000 4,000
2008 2009 2010 2011 2012 2013E
Spain UK Mexico
-14%
Source: Company data and Analyst’s estimates Lower power prices and
higher levies led to cut in earnings
Figure 41: Installed
capacity in Spain (MW)
Source: Company data and Analyst’s estimates
0 5,000 10,000 15,000 20,000 25,000
2012 2018E
Hydro Nuclear Coal
CCGT Cogeneration
10.4%
Figure 42: Installed
capacity in UK (MW)
Source: Company data and Analyst estimates
0 2,000 4,000 6,000 8,000
2012 2018E
Hydro Coal CCGT Cogeneration
5.1%
Figure 44:
Iberdrola’s average
load factors in Spain (13-18E)
Source: Analyst’s estimates
( ) ( )
0% 50% 100%
Cogeneration CCGT Coal Nuclear Hydro
Figure 45: Share in Spanish
generation
Source: Company data, REE and Analyst’s estimates
20.0% 25.0% 30.0%
2008 2010 2012 2014 2016 2018 25.2%
Figure 43: Installed
capacity in Mexico (MW)
Source: Company data and Analyst’s estimates
0 2,000 4,000 6,000 8,000
2012 2018E
Hydro CCGT Cogeneration