THIS REPORT WAS PREPARED BY “STUDENT’S NAME”, A MASTERS IN FINANCE STUDENT OF THE NOVA SCHOOL OF BUSINESS AND ECONOMICS, EXCLUSIVELY FOR ACADEMIC PURPOSES. THIS REPORT WAS SUPERVISED BY ROSÁRIO ANDRÉ WHO REVIEWED THE
VALUATION METHODOLOGY AND THE FINANCIAL MODEL. (SEE DISCLOSURES AND DISCLAIMERS AT END OF DOCUMENT)
See more information at WWW.NOVASBE.PT Page 1/37
M
ASTERS IN
F
INANCE
E
QUITY
R
ESEARCH
Maximizing opportunities in the upstream
We recommend buyingGalp Energia given our target price of €14,82 per share, corresponding to an overall return of 25% given current price levels.
The expected increase from 87,4 mb/d in 2012 to 101,4 mb/d in 2035 in world demand of oil and natural gas, strengthens
Galp Energia’s growing opportunities. We identified great potential value in upstream activities where the main projects in Brazil, particularly Lula´s field, to have a crucial role in this segment development. Also Angola fields and the NG reserve in Mozambique contribute for an optimistic situation.
The European and national crisis suggest a slowdown in demand, lower refining margins and expected negative conditions for the following years implies a lower value in this segment. The current refining margins are 2 $/bbl and it´s expected a growth reaching the 3,5 - 4,0 $/bbl. We expect that the full operation of the hydrocracker and consequently improved refining margins will reverse the undesirable situation in the long term.
Despite suffering slightly due to the lower growth expectations in the Iberian market, the G&P segment remains fairly stable with forecasted net profits increasing between 1% and 2% per year until 2020. The window of opportunities for exploitation of arbitrage in the Asian market, especially Japan, leads to an expectation of good results in the Gas & Power sector.
Company description
Galp Energia is a Portugal based company engaged in the oil and gas industry and it was established in 1999. In the year of 2006, the company was floated on Euronext Lisbon (NYSEEuronext), and it is a constituent of the PSI 20 index. Company´s activities are divided into three different segments
with a diversified portfolio of assets divided across 10 different countries, with the development and production of oil and gas mainly in Brazil, Angola and Mozambique. Galp has a market
capitalization of € 9,752 million and in 2012 was rewarded with the insertion in Dow Jones sustainability indexes.
GALP
ENERGIA
C
OMPANY
R
EPORT
OIL&GAS
6
J
ANEIRO2013
S
TUDENT
:
AFONSO
FREITAS
[email protected]
Growing up in Brazil
leads to…
Recommendation: BUY
Vs Previous Recommendation BUY
Price Target FY14: 14,82 €
Vs Previous Price Target 14,82 €
Price (as of 6-Jan-14) 11,89 €
Reuters: GALP .LS
52-week range (€) 10.76-13.40 Market Cap (€m) 9.752 Outstanding Shares (m) 829.251
Source: Bloomberg
Source: CMVM and Galp Energia
GALP ENERGIA COMPANY REPORT
PAGE 2/37
Table of Contents
EXECUTIVE SUMMARY ... 3
COMPANY OVERVIEW ... 4
COMPANY DESCRIPTION ... 4
SHAREHOLDER STRUCTURE ... 5
EXPLORATION & PRODUCTION (E&P) ... 5
MARKET ENVIRONMENT ... 5
BRAZIL ... 7
ANGOLA ... 9
MOZAMBIQUE ... 10
VALUATION E&P ... 11
SENSITIVE ANALYSIS ... 13
REFINING & MARKETING (R&M) ...14
MARKET ENVIRONMENT ... 14
REFINING ... 17
MARKETING ... 18
VALUATION R&M ... 19
SENSITIVE ANALYSIS ... 20
GAS & POWER (G&P) ...20
MARKET ENVIRONMENT ... 20
GAS ... 23
POWER ... 25
VALUATION G&P ... 26
SENSITIVE ANALYSIS ... 26
SOTP ...27
SENSITIVE ANALYSIS ... 29
FINANCIALS ...30
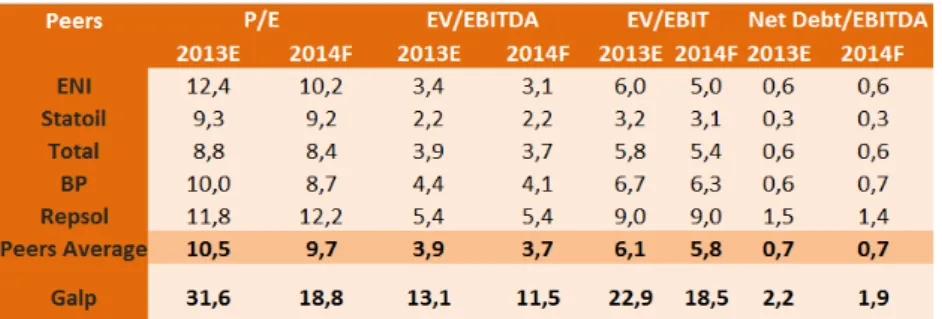
MULTIPLES...32
FINANCIAL STATEMENTS ...33
APPENDIX ...35
GALP ENERGIA COMPANY REPORT
PAGE 3/37
Executive summary
This Report has the main objectives of developing a comprehensive analysis of the Company Galp Energia and providing an investment recommendation based on the actual price and the possible return in the period of 12 month. Our valuation implies an upside potential of 25%. We followed the sum of the parts approach, using DCF for the sectors in which Galp operates: E&P, R&M and G&P. We have followed the company´s strategy as well as the industry dynamics in which Galp is inserted. In addition, we strongly believe that there is considerable growth potential.
Through our analysis we have identified the E&P segment as the main source of value, even tough is not representing yet the major source of income. This belief is consolidated mainly with the projects in Brazil. However, Angola and Mozambique also transmit respectable prospects. Taking into account all the political, commercial and regulatory challenges we expect that high returns will be achieved in the next years, coming from this segment.
Regarding the R&M segment, which has been historically the main source of income, we expect a slowdown on its operations mainly due to the economic crisis and a change in the pattern of oil &gas supply and demand. We foresee that the adverse European R&M market will remain in the following years where non-developed countries seem to gain competitive advantages. The upgrade project concluded in 2012 helped the company to be aligned with international demand and we trust that this will be crucial for this segment recovery in the long-term.
Thirdly, the G&P segment looks to be more stable and it is intensely conditioned by remuneration rates and tariffs imposed by the regulator ERSE. In this business, we predict the Company to take advantage from trading in the Asian market, which its importance has been increasing over the last years.
Finally and to conclude we have set a price for Galp Energia for FY2014 of €14,82/share.
Overall return of 25%
Upstream activities as the main source of value
Some risks to be faced
Hostile conditions in the R&M industry
GALP ENERGIA COMPANY REPORT
PAGE 4/37
Company overview
Company description
Galp Energia is a Portugal based company engaged in the oil and gas industry and it was established in 1999 to incorporate the operations of Petrogal (Oil&Gas Company) and Gas de Portugal (Utility Company). In the year of 2006, the company was floated on Euronext Lisbon (NYSEEuronext), and it is a constituent of the PSI 20 index, the main index in Portugal.
Galp’s activities are divided into three different segments: Refining and Marketing
(R&M), Gas and Power (G&P) and Exploration and Production (E&P). Historically, Galp Energia generated the majority of its EBIT from its downstream segments (R&M and G&P). The first segment (R&M) has the majority of sales on the Iberian Peninsula, where the company is one of the most important players and it is expanding its sales to clients in Africa. In the Gas and Power business sector, the company is not only a supplier of natural gas and energy in the Iberian Peninsula but has been also concentrating on its trading of liquefied natural gas (LNG) among international markets. However, Galp Energia has turned now its strategy to the upstream business (E&P) with a diversified portfolio of assets and activities divided across 10 different countries, with the development and production of oil and gas mainly in Brazil, Angola and most recently in Mozambique.
The company has a market capitalization of € 9,752 million and is expected to
increase in the coming years since the main concern of its shareholders is to strength the E&P sector which if the expected unique growth is achieved it will lead to a likely increase in the company value. The company has been also aware of the sustainability issues and in 2012 it was rewarded with the insertion in the Dow Jones sustainability indexes (DJSI), JDSI World and DJSI Europe.
Source: Galp, Analyst Estimates Figure 1 – Segment waight in the EV
Source: City Group, Analyst Estimates Figure 2 –EBITDA evolution per segment
Source:Bloomberg, Analyst Estimates Figure 3 –Peers Market Capitalization
GALP ENERGIA COMPANY REPORT
PAGE 5/37
Shareholder structure
The company has three main different shareholders Amorim Energia1 38,34%,
Eni with 16,34% and Parpública 7%, controlled by the Portuguese State. The remaining stake of 38,32% is free-float and traded in the Euronext index. Amorim Energia is owned 55% by Galp´s Energia Chairman Américo Amorim and the remaining 45% stake is held by Esperaza Holding BV. Parpública is a vehicle for the Portuguese state equity holdings in a different number of companies
During the last year, Galp Energia has suffered from changes on its shareholder structure. In May 2013 it was announced the successful of the placement by Eni of 55 452 341 shares, corresponding to approximately 6,7% of Galp Energia, after the settlement of the sale, Eni holds 16.34% of Galp's outstanding share capital of which 8%2 are convertible bonds and therefore it is expected Eni to
reduce its participation to 8,34% in 2015. Another important aspect, was an adjustment in Galp Energia’s dividend distribution policy which was revised in 2012, estimating a rising dividend and an expected smooth increase in the following years until 2016.
Additionally, Galp Energia's shareholder structure has a growing representation of international shareholders, close to 80% of total institutional investors, which shows the geographic variety of the Company's investors.
Exploration & Production (E&P)
Market Environment
This sector has become one of the most valuable sectors among the different continents and this role is expected to remain in the next years. In 2013, the consumption of oil in the world had an increase of 1.1% when compared to the previous year. The reasons behind this issue are consequence of an increase of demand for this product by the countries outside the Organisation for Economic Cooperation and Development (OECD). Oppositely, countries from OECD have shown a slowdown on its economic growth during the last 4 years. This was a consequence of the economic crisis in the USA and in Europe but also due to
1 Amorim Energia shareholders are Power, Oil & Gas Investments BV (35%), Amorim Investimentos Energéticos SGPS
S.A. (20%) and Esperaza Holding BV (45%). Esperaza Holding is owned by Sonangol, E.P., Angola’s state owned oil
company and Isabel dos Santos
2 Bonds issued on 30 November 2012 and due on 30 November 2015, and the remaining 8.34% subject to certain rights
exercisable by Amorim Energia. If Amorim Energia don’t buy or don´t not indicate a third party, ENI is free to sell 8.34% in the market, meaning that there is risk of overhang on Galp’s shares
ENI participation expected to be reduced Figure 5 – Share Structure
Source: Galp, Analyst Estimates
Figure 6 –Brent price evolution
GALP ENERGIA COMPANY REPORT
PAGE 6/37 more efficient markets in developing countries. Conversely, China and India have been contributing to a rise in oil and gas demand during the years of sovereign crisis with an increase in consumption of 7%. According to OPEC estimates, the OPEC member countries3 will continue to expand its upstream businesses and
around 132 projects are expected to come on-stream. The development of the awaited projects is translated in a net increase of 7 mb/d4 when compared with
2010.
We predict that in a near future some importers will become exporters (the U.S. is changing its role in the Natural Gas market), large exporters are becoming large consumers (Middle East countries regarding oil consumption) and earlier small consumers are becoming the main font of global demand (India and China). Once again, these changes emerge as the energy sector is reacting to global trends, alterations in both demography and economic growth and the faster advance of energy sector followed by an unusual unlocking oil and gas supplies.
The dated Brent price is also an important driver for the E&P market environment. This indicator has shown a huge volatility, directly related with Geo-political events, supply, demand and so on and the last years the data Brent price ranged between $90/bbl5 and $111.5/bbl. The price instability was mainly driven
by the hostile environment in Syria, southern Sudan and Yemen, but also due to the USA and European Union (EU) restraint on crude oil from Iran.
Another important issue that can strongly affect the market for natural gas is the development of shale gas which is a natural gas that is found trapped within shale formations and has becoming an increasingly important source of natural gas in the United States since the start of this century. The theory that the USA might change from importer to exporter of natural gas is increasing the risks for the players in energy markets since the threat of this new product will have repercussions on the profitability of different projects for the development of natural gas. In fact, the huge impact of production of shale resources, especially in North America, would strongly affect crude oil and gas production and consequently the economies of countries which heavily depend on crude oil as their main source of revenue. Also, according to International Association of Oil & Gas Producers (OGP) the development of shale gas in Europe could add 1 million jobs and consequently make the industry more competitive and less
3 Organization of the Petroleum Exporting Countries 4 Millions of barrels per day
5 Barrels – Oil barrel = 42 US Gallon – 158,9 liters
Changes in the energy sector
Progress of shale gas as a challenge
Galp E&P projects among 10 countries Figure 7 – Growth in world oil demand
Source: IEA, Outlook 2013
Figure 8 –Oil demand evolution by region
Source: IEA, Outlook 2013 – Analyst Estimates
Figure 9 – Unconventional gas evolution
Source: IEA, Outlook 2013 – Analyst Estimates
Figure 10 – Regions where Galp is production
GALP ENERGIA COMPANY REPORT
PAGE 7/37 dependent on energy imports. On the other hand, there are several risks associated with this unconventional gas with the environmental ones being in the top of them.
Galp Energia is directing its upstream operations among 10 different countries with 50 projects but with particularly emphasis on the discoveries in the pre-salt area of the Santos basin in Brazil, in the Rovuma basin in Mozambique and in blocks in Angola. The other projects are only in the initial phases of exploration or appraisal which are recognized as technical reserves and are placed on the following countries: Venezuela, Uruguay, Portugal, Equatorial Guinea, East Timor, Namibia and Morocco. The company is preparing to increase its production. Its goal is to produce 300 kboe/d6 (actual galp’s refineries
consumption) in 2020 which represents more than 10 times of the actual production. Therefore, our analysis will be focused on the countries where there is already a development plan or where the company is already producing
Brazil
The discoveries in Brazil and its adjacent participation of Galp Energia have increased the company´s value, being the projects in Santos basin the main source of value and leading to perspectives of future development in oil and gas production. In all these projects, Galp Energia controls its operations through Petrogal Brazil where Galp has a 70% holding.
In fact, Galp Energia is involved in two great oil & gas discoveries during this century: Lula in Brazil and Mamba in Mozambique. Over the last ten years, more oil fields have been discovered in Brazil than in any other country in the world. Secondly, we believe that there are several technical and commercial challenges associated with the pre-salt projects where Petrobras is the operator in most fields and where this company is dedicating significant efforts to research and advance of proper technologies. The targets for levels of production are a stimulating opportunity for Galp Energia and it is critical to evaluate properly the significant level of risk. That is why each project has to experience the four different phases: exploration, appraisal, development and production. In each field, EWT7 and Pilot tests are made, in the initial phase where the goal is to
gather the most reservoir and production data possible. The phase of full development (here is important Petrobras desire to fast-track the pre-salt
6 Thousands of barrels of oil equivalents per day 7 Extended Well tests
Figure 12: Petrogal Brazil Project Figure 11: Production Curve (Carcará field)
Source: Galp Energia, Analyst Estimates Great increase in production is expected for 2020
Source: Galp Energia, Analyst Estimates
Figure 13: Brazil Reserves and Start-up date
GALP ENERGIA COMPANY REPORT
PAGE 8/37 developments), is when the tested technologies, FPSOs8 and subsea wells are
used (with the contraction of more units in the production phase if needed). Together, these investments represent the major part of the capital expenditures on this kind of projects.
Galp´s exploration calendar in Brazil for the next years includes several high impact wells with very high risk but also the de-risking operations if successful could be vital for the company´s future growth. The risks that arise with well constructions are mainly related with the uncertainty about the existence or not of hydrocarbons which can lead to abandonment of the field and waste of capital expenditures. Also, high environmental hazards are associated, where the process of wells drilling may produce a concentration of surface disturbance and trash generation. The de-risking operations are the tasks that have to be performed in order to convert the uncertain reserves into proved and recoverable reserves. Plus, the development and production stages carry a high level of risks respecting their critical variables (infrastructure costs, production schedule, and quality of resources extracted, operational costs and geological reservoir characteristics). Again, since many of the projects are in the exploratory or appraisal phase we will only focus our valuation on the projects where there is already a development plan or which are already in the production phase. These fields are commonly named commercial reserves.
Regarding the projects that we have evaluated: BM –S 8 Carcará; BM-S 11 Iara field; BM- S 24 Júpiter and the BM-S 11 Lula and Cernambi fields (we have modelled the two fields together due to the ANP9 consideration of both fields to
be a single accumulation,) in each one Galp has different participations. Several issues addressed (date for start-ups, capital expenditures, operating costs and expected peak of production) appear to be determinant on its value for the company. Moreover, all these projects are regulated under concession contracts where there is a special tax applicable depending on the level of production per year.
Carcará pre-salt oil and gas field lies within the BM-S-8 exploration where Petrogal Brazil holds a 14% stake and includes other discoveries such as Bem-Te-Vi and Bigua. The company operator is currently planning to start the Carcará field production in 2018. In block BM-S-24, also located in Santos basin, Petrogal Brazil has a 20% holding. Here, the second well, Jupiter was drilled and it was
8 Floating Production Storage and Off-loading facilities 9 Agência Nacional do Petróleo
Source: IEA, Outlook 2013
Figure 15: Global discoveries Oil fields Wells construction represents high risks
Valuation focused only in upstream projects in the last phases
Brazil projects controlled under concession
contracts
Figure 14: Average E&P Projects duration
Source: Galp Energia, Analyst Estimates
Brazil assets
GALP ENERGIA COMPANY REPORT
PAGE 9/37 evidenced the existence of continuous reservoir and the confirmation of the presence of commercial oil, and that is why we have considered this field as a commercial reserve. In the consortium in charge of the BM-S11, Petrogal Brazil has a stake of 10%. In this area, Iara was one of the largest deep-water discoveries ever made. Despite being an extended well test planned for 2014, there is also a full-scale plan of development to follow. The Lula project is already producing since 2010 while the Cernambi field will start in 2014, therefore we believe that Lula and Cernambi together will reach its peak of production in 2025. We have made our investment plan for each project based on Petrobras BMP 2012-201610, since the company is the operator in each block, but also in past
experiences for the Lula field.
Finally, it is important to refer that in the beginning of 2012, Galp has sold to Sinopec an equivalent stake of 30% in Petrogal Brazil. In this deal, Sinopec has subscribed the $4,8 billion capital increase in Petrogal Brazil plus a shareholder loan to the company in the amount of $390million which was used to reimburse 30% of the loans to Galp Energia of $1,3 billion. In fact, when compared to similar deals in this industry, such as the purchase of Sinopec in Repsol, we observe a difference in Galp´s deal between 1,7$/bbl and 1,9$/bbl below. However, we believe that the deal also decreased operations risk, allowed for liquidity for upstream activities and improved confidence for other shareholders and possible future investors or partners.
Angola
Galp Energia has currently its main source of production activities in this country, even though in the medium and long term this will rapidly be replaced by projects in Brazil. In fact, while Galp has some development prospects in blocks 14/14k and block 32, we believe that these opportunities are on a much smaller scale than those in Brazil and Mozambique.
In block 14 Galp holds a participation of 9% and the operator is Chevron, where the fields of Kuito, Tombua-Landana and BBLT11 are allocated. Here, the
company is already producing and has even reached its peak production in the year of 2010 with 71 905 kboe. In this block an FPSO facility has been leased and installed in the late 2000. It was designed to operate for about 10 years and has to be recertified for continue the production on this block; thus we assume
10“Petrobrás Business and Management Plan” 11 Benguela / Belize / Lobito e Tomboco
Operation benefit for Galp Energia
Sinopec deal in 2012 appear to be
undervalued
Lula field as a reference
for the other field’s
valuation
No more investments expected in block 14 Figure 16: Angola Projects
GALP ENERGIA COMPANY REPORT
PAGE 10/37 that there will not occur more investments in FPSOs in these three fields. The Tombua- Landana filed is crucial for the company performance on the block 14
since it’s the only field where production is not in a declining phase and has not
reached its peak and therefore we expect that its production phase will offset block 14 declining production rather than increase production. Galp is also involved in block 14 in the development of Malange & Lucapa field which was the first discovered in the Cretaceous Pinda Formation. This field is relatively small and recoverable reserves are unlikely to be sufficient to support a standalone development. The two other projects that Galp is operating are Block 14K-Lianzi and Block 32, in which the company has a participation of 4,5% and 5% respectively. The block 32 is situated in water depths ranging from 1 400 to 2000 metres and the fields are spread over a large area, which contributes to a larger amount of capital expenditures on FPSOs facilities and wells. All these questions show the numerous hazards that projects like these in Angola are associated to, being the uncertainty about the field geology the main risk. In addition, less transparent practices, delays in suppliers ‘schedules and the fact that oil companies operating in Angola must use local banks to make all payments, constitute a threat for the operations in this country.
The company is also taking part in the first integrated natural gas project in the country, Angola LNG II but it is still in the initial phase of exploration. In block 33, the activities in 2012 were dedicated on drilling of Sumatê-1, and in the year of 2013 a new exploration plan was submitted and so we do not consider as a commercial reserve yet, not taking into account for the valuation purpose.
Mozambique
In Mozambique, Galp Energia has a 10% participation in the consortium for the exploration of area 4 in the Rovuma basin. The consortium is operated by Eni but has also ENH12 and Kogas as participants. Here, and particularly in the year of
2012 there were numerous natural gas findings through the execution of six wells drilled in the area. After the appraisal phase there was an estimate of 27 Tcf13
equivalents to 4.656.284 Kboe exclusively for area 4. Galp Energia and the other partners should also continue the exploration and appraisal of Area 4. We share the same opinion of Galp Energia that there is extra value in Rovuma gas prone structures where the company intends to test liquids prospects in the end of 2013.
12 The National Oil and Gas Company of Mozambique 13 Trillion cubic feet
Area 4 exploration should continue
Galp investing in the first NG project in Angola Projects in Angola with some threats associated
GALP ENERGIA COMPANY REPORT
PAGE 11/37 The discoveries in Mozambique are likely to provide exceptional returns in the medium and long term for the companies involved, and offer access to high LNG volumes for export essentially to international markets and more precisely to Asian Markets. The presence of Eni who has LNG experience constitutes a competitive advantage. On the other hand, the dependence on sales agreements with LNG buyers might be a threat for the profitability of the development plan. In December 2012, Eni together with Anadarko (operator of the Area 1 of Rovuma Basin) awarded a number of FEED (Front End Engineering and Design) contracts and announced a HD (Heads of Agreement) to track a co-ordinated development and a common LNG facility. The partners have scheduled a delivering of the first LNG train in 2018, although we had a more conservative approach and have forecasted the first LNG train to be implemented in 2019 which will be built near the town of Palma in the north of Mozambique. Furthermore, we think that the initial capital expenditures might be too high for some of the participants of the consortium, such as ENH, and therefore there might be a change in the partnership before the final investment decision, with the possibility of the major players in the Asian market to acquire the available stakes and thus improving operations due to their advanced experience. It is also of the upper importance to refer that we have assumed that if eventual future domestic sales occur it will be done at market values and hence not affecting future cash flows14.
Valuation E&P
The method that we have used in the valuation of the E&P segment was the Adjusted Present Value (APV) which allows us to value each project separately not taking into account the capital structure. With this method we are able to evaluate each project and its operations as if the company were all-equity financed and the value of tax shields that arise from debt financing. First of all it is important to reiterate that we have only valued the projects that are already nominated commercial reserves and where that is already a plan of development or production phase. For each field/project we have discounted the Free Cash Flow to the firm (FCF) at an unlevered cost of equity (calculating different values for each country) and then we have added the value of tax shields. In the end, after computing the total value for each project we had to attribute the percentage of participation that Petrogal Brazil keeps in each field and then also apply the
14 Appendixes 2 and 3 provide E&P projects information, however it is only related to the first 10 years.
Different participations of Petrogal Brazil have to be addressed
Future domestic sales at market values
Findings in Mozambique predictable to provide extraordinary returns
Valuation of projects using the APV approach Figure 17: Area 4, Mozambique partners and financial capacity
GALP ENERGIA COMPANY REPORT
PAGE 12/37 stake that Galp Energia has in Petrogal Brazil (70%). Moreover, we have done our analysis based on the perspective of the operator (Petrobrás, Chevron, etc) as we thought that it would facilitate our valuation instead of trying to estimate costs, risks and revenues exclusively for Galp´s Company. The assumptions that Galp will be prepared to follow the project investments and that each project will complete its estimated duration are essential for our approach. We have taken into account the different types of contracts in each country: Concession contracts (Brazil and Mozambique) and Product Sharing Agreement (Angola). In the first group the participants have to share a percentage of production with the State plus the taxable income, while in the PSA there is the possibility of recovering part of the project costs and the remaining production is shared between the contractor and the concessionaire.
For each field we have forecasted the expected peak of production based on the operators and Galp´s reports. Lifting costs, other operational costs and royalties
(10%)
were forecasted depending on each year production. Also Brent prices affect strongly the profitability of the project. In our estimates we have used a $108 price for 2013 decreasing until $98 in 2022 and after that showing a rising trend since is expected a recovery of this commodity prices. We have also used a discount over brent of 4% in Brazil and 3% in Angola mainly due to variances in API gravity15.Regarding capital expenditures, for the three countries we estimated the number of wells required, and having in mind that its number is a big uncertainty and a critical factor in determining the whole cost of the project, we used an average of 22 wells per FPSO (12 producers and 10 injectors) in Brazil. In Angola we used a number of 14 wells per FPSO (10 producers and 4 injectors) attributing the discrepancy between both countries to different levels of production, FPSOs capacity, distance of each field and percentage of recoverable reserves.
In what respects the Rovuma project, the capital expenditures have a different nature since it is a Natural Gas Project. Here, we estimated an installation of a Pipeline with a cost of $500M in the year of 2017 (production starting only in 2019) and 4 LNG trains to be acquired during the project. Also in this project, we have used a NG/Oil parity to calculate revenues as the reserves of this project were translated in boe. Although we expect a slighter relation between gas and oil prices in the future, we made our assumptions based on recent studies16 that
15 American Petroleum Institute´s scale for denoting the “heaviness” or “lightness” of crude oils 16“ The weak tie between natural gas and oil prices”, David J. Ramberg & John E. Parsons
Variance in discount over brent in Brazil and Angola
Brent prices disturb the success of the projects Different types of
contracts in the 3 countries
Different levels of production and capacity in the 3 companies
GALP ENERGIA COMPANY REPORT
PAGE 13/37 establish that crude oil and natural gas prices are co-integrated. We adopt a constant natural gas – oil parity (boe/mmbtu)17 of 17% and a conversion factor of
a boe to mmbtu of 5,55 approximately.
Therefore, we reached Galp´s E&P operations at a €13,10/share.
Sensitive analysis
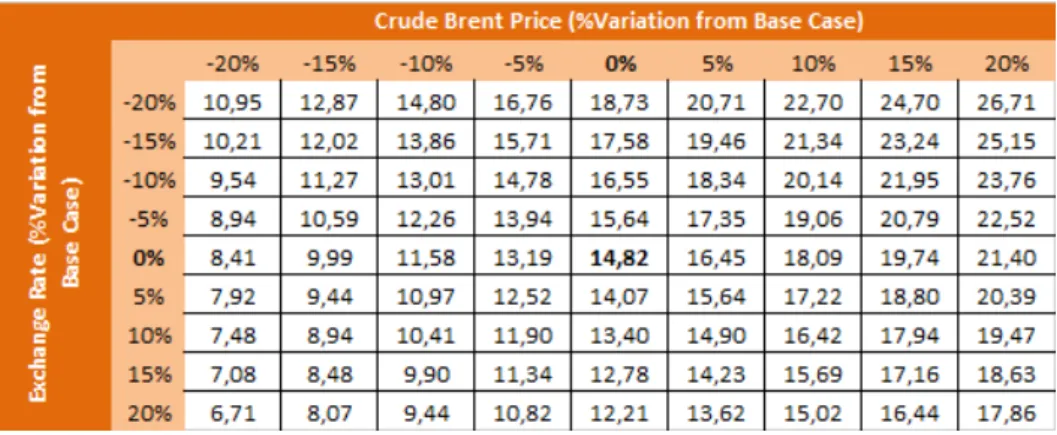
In each section we have anticipated the impact in the actual outcome, the equity value of Galp Energia, by a variation from the base case of the key value drivers. This analysis is particularly useful since the estimates have always an inherent uncertainty and therefore it can attenuate the risk of an unfair valuation.
Regarding the E&P segment, we have predicted the impact of a variation in the
data Brent price and in the exchange rate (€/USD). In fact, Galp Energia activities
and its value creation are extremely dependent on these two indicators. This dependence will increase in the future, as a result of a stronger importance of the E&P segment. Besides, as the products extracted from the reserves of the main projects, in this sector, have the data Brent price as a reference, price movements in the next years will affect Galp price per share. Also, since the production extracted from the fields and the major parts of cash flow in this segment are traded in dollars, a depreciation/appreciation of the dollar will also impact in the E&P performance in the next years. As we can observe, a depreciation of the dollar has a negative impact in the Company´s value due to the importance of upstream businesses.
It is important to refer that these two variables also affect the R&M segment but have a deeper impact in upstream activities, where they yield higher variations. Also, it is crucial to have in mind that variations in both drivers have opposite effects on E&P and R&M sectors. In fact, an increase in Brent price has positive effects in upstream operations while the same variation would impact negatively in refining margins, since it represents a huge part of the operating expenses. In
what concerns the exchange rate (€/USD) while an appreciation of the dollar may
increase E&P margins, the refining cash costs would also increase.
Concluding, even though these two key value drivers have contraries effects on different segments, the large importance of the E&P segment points that the data Brent price is positively correlated with Galp´s value, while a depreciation of the USD will have an undesirable effect on Galp´s price per share.
17 Ratio between barrels of oil equivalents to millions of British Thermal unit
Brent price and exchange rate affect both R&M and E&P segments
Brent prices moves affect Galp value
GALP ENERGIA COMPANY REPORT
PAGE 14/37
Refining & Marketing (R&M)
Market Environment
The global refining and marketing has been facing a deep transformation over the last years as a result of several changes in regional demand trends for oil products but also due to variations in regional energy costs. In this industry, crude oil and natural gas liquids are mainly used as inputs to provide fuel for the transformation process. Thus, the importance of low energy prices has increased and the cost of energy inputs affects strongly the price of fuel. The profitability of refining margins is affected by the inability of the refiners to reflect the higher input costs in the final prices. Therefore, the main problem is related with rivalry between refining companies and with elasticity demand/price (when price increases, the demand falls) strongly influencing competition for installed capacity. Commonly the costs are lower for refining companies that are located close to the market than for companies who have to ship refined products over long distances. Energy costs are the main cause for the shrinkage of refining margins in some regions, especially Europe, where several refineries have already closed and further exits are likely. Since the beginning of the century, stricter oil-product standards and an upward shift in the demand for middle distillates (such as diesel) are imposing refining companies to increase conversion processes. We have predicted an important pattern in company’s investments in energy-saving equipment. Also, the fall in gas prices in the United States has given to its companies a competitive advantage with negative consequences in European refiners with high imported gas costs.
Competition between refineries as the main problem
Conversion processes are gaining importance
Figure 18: Deviations in price target due to changes in Crude Brent price and €/$ exchange rate
GALP ENERGIA COMPANY REPORT
PAGE 15/37 Europe and USA have always been the main refining centres in the world, together accounting for 46% of total global refining capacity in 2012. Moreover, while demand in both of these regions tracks a downward trend, Asia and emerging countries are expected to increase demand and its refinery capacity. Over the 4 mb/d of refining capacity that has been permanently shut down worldwide over the last 5 years, half was in Europe mainly due to the sovereign crisis. The extremely problematic access to crude oil and the difficult to export its products is a pattern that will persist over the next years. The difficult to access to crude oil is explained by the inequalities in allocation of crude around the planet and also by the improvement and construction of refining centres in the countries producers (as they benefit from cheaper feedstock and lower energy costs, they can easily compete against Europe's refiners). Besides, the challenges in exportations are related with the fact that many Europe refineries were constructed after the Second World War and were heavily geared towards gasoline production which is being reflected on a surplus of gasoline due to a change in products demand (with diesel being favoured). At the same time, massive refineries in the United States, Asia and the Middle East are sending ever-growing volumes of diesel to Europe which deteriorates even more the situation. Since the end of the 1990s, European gasoline consumption has decreased by 1,2 mb/d with diesel consumption playing a significant role and turning this continent into the biggest importer of diesel, due to government policies and fuel taxation. The process of “dieselization” started in the beginning
of the 80s where a more favourable tax policy and the creation of a “diesel motor”
were the main causes. In the 90s, the technology improvement in these type of motors that were perceived to be more environmental friendly, faster and quitter
than “gasoline motors” accentuated the growth importance of diesel. Also, we believe that this trend is to continue as diesel represents by far the largest increase in volume terms, rising by more than 5 mb/d to 31 mb/d between 2012 and 2035. All of the net increase in diesel demand comes from the road-transport sector in non-OECD countries. In Europe, we have two different markets for trading of oil products: MED18 market and NWE19 market, while in the distribution
sector we have local markets mainly due to logistic and fiscal issues. Consequently we do not have a European single market in this sector.
We predict that total European oil product demand will decline by 2,4 mb/d to 2035 while distillates increase their share of total product demand. Another trend
18 Mediterranean – Genoa, Lavera
19 Northwest – Amsterdam, Rotterdam and Antwerp
Diesel has been enhancing its position over the last years Difficult in access to crude oil and exports
More European refineries will bankrupt in the near future
Europe´s dependence on imports of middle
distillates
Figure 19: Refining Capacity evolution by region
Figure 20: Gasoline and Diesel Quotations evolution
Source: PIRA Energy Group- World Refining Data Portal, Analysts Estimates
Source: Galp Analysts Estimates
Source: Wood Mackenzie- JEC Fleet & Fuels Model, Analysts Estimates
GALP ENERGIA COMPANY REPORT
PAGE 16/37 that we could observe is the intensification of Europe´s dependence on imports of diesel and jet fuel. In addition, we strongly believe that the capacity for European
refining companies’ exports excess gasoline to USA and to West Africa will be limited in the future. Both the slowdown of USA demand for gasoline and increasing production from US Gulf Coast refineries should be a warning for European refining and marketing managers. Also the fact that US Gulf Coast R&M companies are already selling to West Africa may be a denunciation for some European refining companies whose margins cannot persist at this low levels and which make us believe that more companies will close in the near future. According to a Bloomberg survey of six European refinery executives, 10 will shut permanently by 2020 from France to Italy to the Czech Republic.
Another reason for apprehension in European refining companies is the increasing dependence on imported crude which we trust that will raise even more in the coming years. In an intensive and competitive environment and where refining margins are constantly under pressure, the fact that Russia has been reducing exports of crude oil and turning its trade path to China20,
deteriorates the situation.
In conclusion, the European refining and marketing market has been facing an adverse atmosphere in the last years and is expected to remain the declining pattern. The combination of lower amounts of product outputs, more competition, low share in gasoline exports and the expectation of more refining companies to close take us to a prediction of European refinery runs will decline in 2035 by 2,6 mb/d more than the 2,4 mb/d fall in European demand.
Before Galp´s refinery investments and upgrades21, refining activities were not in
accordance with its retail and marketing sales. The company have been with extra production mainly in fuel oil and gasoline, and with the necessity of acquiring middle distillates for resale on its marketing business, aligned with the competition. One of the goals of the upgrades in the refineries were to increase the yield rates of the middle distillates from 43% to 49% and at the same time decrease the output of the excess oil products in order to equilibrate the overall balance. After the upgrade project we believe that Galp will be more aligned with European trends in the medium and long term.
20 After a 25 year agreement, through the direct ESPO pipeline link 21 More detailed in the next section
Refining margins persistently under pressure
Decreasing trend to persist
GALP ENERGIA COMPANY REPORT
PAGE 17/37
Refining
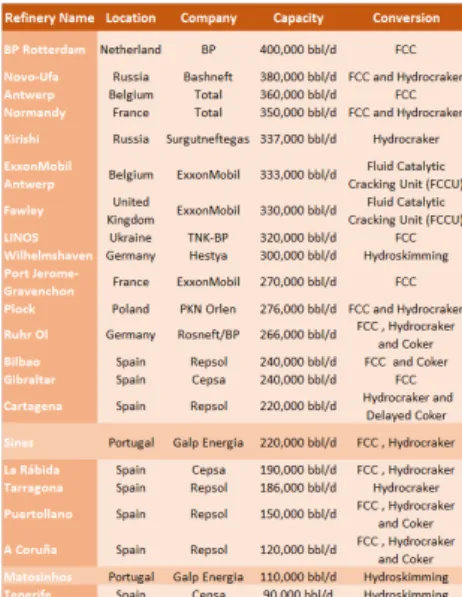
Regarding the refining sector, Galp Energia owns two refineries in Portugal. The first is located in Sines, a deep conversion refinery, and is one of the largest in Western Europe with a capacity of 220 kboe/d, and the second in Matosinhos, a hydro skimming refinery with a full capacity of 110 kboe/d.
The main event was the restructuring and upgrading project of the two refineries which started in the beginning of 2012 and was associated to an investment of
€1,4 bn. This process was crucial for the productivity and profitability of the company since it was the only way for the company to compete in the current and future strong environment and to adapt to market dynamics. In fact, the refineries are now more able to process heavier crudes as well as larger quantities of diesel (middle distillates) making the operations and output more adjusted to European and international demand. Therefore we believe that Galp´s refining margins could increase in the long-term and recover from the narrow margins we have observed last years. Among the upgrade project, the first phase was the contracting of new units at Sines refinery which affected the utilization rate to an average of only 68% during this period. The company also implemented advanced engineering methods and RCM22, aiming to decrease the
number of stoppages during the refining process and consequently increase utilization rate. Better integration between the two refineries and a greater flexibility in its choice of end-product were two important objectives of the project. When the new units started its operations the process of transforming heavier crudes (the cost is lower than lighter crudes, even though nowadays the difference is minimum) was facilitated and from Galp´s accounts report we can predict that the company wants to continue to take advantage from it in the next years. In 2013, diesel and gasoline sustained to be the main products processed in the refining structures.
Galp Energia imports crude oil from 15 different countries and the company aims to guarantee a great diversification of its suppliers given the impact on the company profits, as was proven in Europe when the EU embargo on crude from Iran occurred in the year of 2012. The company represents 100% and 20% of the Portuguese and Iberian refining capacity respectively.
The third quarter profits for 2013 found even worse expectations especially due to narrower refining margins and a huge increase in amortization costs which
22 Reliability centered maintenance
Diesel and gasoline as the main products treated
Upgrade project crucial to compete
Figure 22: European Refineries
GALP ENERGIA COMPANY REPORT
PAGE 18/37 increased 47% and amounted to 145 €M. It is important to refer that although amortization costs affect company´s margins, it has no influence on Cash Flows. However, as we have already mentioned we believe that in the long-term it will improve to the targets set by the company.
Knowing that historically downstream businesses have been the main source of company´s earnings, slowdown in refining led top managers to introduce new methods and systems in order to optimize this downstream segment. Moreover, together with the investment project in the refineries, the company constructed cogeneration facilities at the Sines and Matosinhos infrastructures with the start of fully operations in 2012 and 2013 respectively.
Marketing
The activities of Galp Energia in this segment have its core development in the Iberian Peninsula and with the other procedures positioned in Africa. The company owns a total storage capacity of near to 7mm3 in Portugal and Spain and also holds participations in logistics companies and pipelines of around 4000 Km in both countries which allow the company to have a wider marketing network. In this segment, Galp Energia aims to market its products under Galp Energia brand where the vast chain of service stations and its efficiency play an important role. During the last years there have been a slump in Iberian demand for oil products mainly due to the crisis and we had taken this into account in our assumptions for valuation of this segment. To fight this issue, Galp has increased its actions on a number of new events related to costumer care but also has been simplifying the organizational structure. In Africa, more precisely in Mozambique where the company is one of the main operators, the firm controls its operations through Petrogal Mozambique (100% owned) where distributes lubricants and liquid fuels but also the supply and marketing of LPG23 in the wholesale and
direct client channels. Over the last 5 years, volumes sold in the retail segment remained with its fallen trend which reflected a drop of 11% in sales in Portugal. However, Galp remains as the retail market leader in Portugal with 30% and only 6% in Spain. The company aimed to reduce its service stations networks and in 2012 there were closed 27 stations accordingly to Galp´s Investor Presentation. In the late 2008 Galp acquired Agip´s and ExxonMobil´s operations in the Iberian market for oil products as which was a key factor for the company to place is products originated from refineries. Knowing the adverse margins and the current
23 Liquefied Petroleum gas
Galp remains as the market leader in Portugal Top managers
introduced new methods Galp´s third quarter refining results worse than expected
GALP ENERGIA COMPANY REPORT
PAGE 19/37 economic condition, Galp is not planning to follow investments like these in the next years.
Valuation R&M
In the R&M segment of Galp Energia we have preferred an approach of valuing both sectors Refining and Marketing independently. We have used this criterion as each sector has different perspectives of growing and their key value drivers are not the same. After all, we have used a DCF method using the same wacc for discounting the FCF of each activity. The wacc24 was computed based on R&M
comparable companies, mainly used to compute Average Beta unlevered (0,73) and after levered it, we used a terminal growth of 2% and an equity premium of 6%. In the refining sector the EBITDA was a function of Galp´s refining margins which we expect to stay at slight values until 2018 (ranging from 2 to 3,5 $/bbl) such as it was confirmed in the disclosure of Galp´s third quarter results where adverse refining margins were observed. Also the data Brent price and refining cash costs affected negatively the results for this segment and finally the crude which is not expected to have great variations in the next years since the refineries are almost reaching its full capacity of utilization and achieving the operational levels target for the upgrade.
In the Marketing sector the forecasted EBITDAs were mainly driven by sales which depend greatly on data Brent price but also on perspectives of growth in the Iberian Peninsula. Regarding the Brent price we have predicted a growth pattern starting in 2023 which will have implications in price of refined products and consequently decreasing marketing sales due to the elasticity demand/price of refined products. Here we forecasted for the next years an almost flat growth in sales and consequently in Marketing´s net profit. This was mainly driven due to an increase in competition, consumer preferences and the uncertainty about when both Portugal and Spain will recover from the harmful economic trend. In both sub segments large capital expenditures are not anticipated since an unprecedented investment was made in R&M in the last years and therefore the investments will be mainly due to maintenance and to cover amortization and depreciation of facilities.
Hence, we computed a Galp´s R&M processes at a €2,26/share.
24 WACC= (D/D+E) x Rd x (1-tc) + (E/D+E) x Re
Refineries almost achieving its full capacity of utilization Galp´s refining margins will remain at short values
Refining and Marketing segments valued independently
GALP ENERGIA COMPANY REPORT
PAGE 20/37
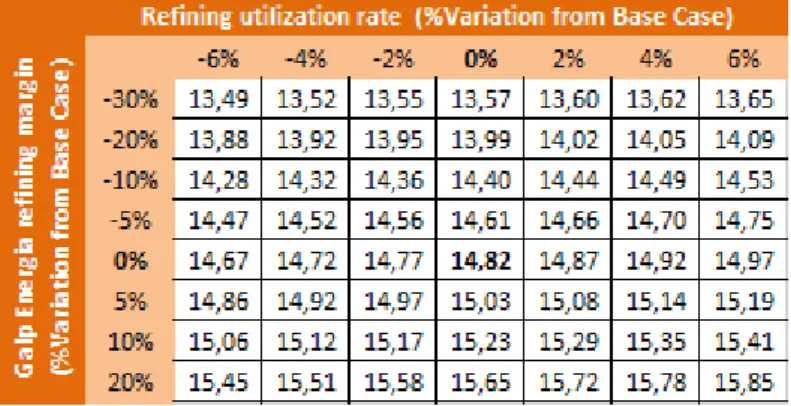
Sensitive analysis
Concerning the Refining and Marketing segment, we have analysed the impact of the refining margin as well as the utilization rate. In what regards the refining margin, the main driver of the Refining segment, it is strongly affected by seasonality, international conflicts, oil prices, turnarounds and several other factors. Firstly, we have decided to perform a variation depending 50% on Brent price variations and adding a variation of 5%,10%, 20% and 30% to refining margins base case, having in mind that is much volatile than the utilization rate as have been perceived in the last years.
Secondly, for the utilization rate we have only varied 1 %, 2%, 4% and 6% since, as we have already explained, the refineries are both reaching its full operational capacity and the utilization rate it is an indicator that is easier to predict in the future.
These two variables only affect the Refining sector, and we have decided not to perform a sensitive analysis for the Marketing sector as this segment is mostly
affected by customer’s preferences and economic cycles on the countries where the Company is placed. Finally, we can observe that R&M value driver’s
variations produce lower deviations in the Company´s value, which can be explained by a lower weight of this sector in Galp´s equity value.
Gas & Power (G&P)
Market Environment
This industry plays a central role in the world´s energy evolution in the decades to come. In fact, the importance of natural gas has been growing during the last
R&M value drivers with lower impact than other sectors in Company´s value
Refining margins more volatile than utilization rates
Figure 23: Deviations in price target due to changes in Refining utilization rate and Galp’s Refining margin
GALP ENERGIA COMPANY REPORT
PAGE 21/37 years not only due to various discoveries made in this field but also due to its safe and flexible use which is environment-friendly. This makes this resource the perfect partner for renewable sources of energy which we believe that companies will attribute even more meaning in the long term. Also the reserve life of natural gas has longer time frames than other resources which make projects on this industry very attractive and profitable for expanding companies.
In this business sector, we strongly believe that the general prospects for natural gas are very optimistic. The values for consumption in 2035 are expected to reached almost 5 tcm25 with an average year growth of 1,6%. We estimate that
82% of this increase will be in non-OECD countries where demand for this resource will growth by around 1,3 tcm.
The main reasons for this increase in demand will be supported by Middle East, North America and China motivated by the introduction of energy policies to diversify the energy uses and with environment issues associated. Regarding the European Union, we do not forecast a so favourable scenario since it will be affected by an increase in the prices of natural gas. In the supply side, we expect that Iraq, East Africa Brazil and the eastern Mediterranean will be the main players in the coming years. New sources of gas are expected to appear which
brings variety to global supply. Also LNG supplier’s changes can create new
connections between regional gas markets more precisely between those of North America and Asia contributing to shrinkage of the regional gas prices that exist nowadays. In fact, regional gas prices are a subject that has been debated over the last years, more precisely in the World Gas Conference where gas prices formation models and its mechanisms have been studied. In wholly liberalised traded markets, the price would be a reference price, as what happens in the USA, where in many other countries, where gas is imported, it could be normally a border price. The more difficult cases are when the gas consumed is provided through local production with no international trade and therefore the concept of wholesale price is not recognised. Here the price variation depends on the nature of the market (monopoly, etc.) and on competition. The main types of gas price formation mechanisms are the following: oil price escalation (where the gas price is set based on competition of fuels); gas-on-gas competition; bilateral monopoly (the price is formed based on agreements between large sellers and buyers) and regulation (where the price is approved by a regulatory authority).
25 Trillion cubic meters
Significance of natural gas has been growing over the last years
Introduction of energy policies in some countries
Natural gas prices is a subject that generates discussion
Figure 24: Sources of Gas supply by region
GALP ENERGIA COMPANY REPORT
PAGE 22/37 Since the turn of the century, the world natural gas consumption has expanded on average by 2, 7% per year, which showed a quicker growth than oil and power but slower than coal and renewables and the tendency is to continue. However, and as we have already referred, this pattern varies among different regions and with Europe reaching a more difficult future. The main drivers for this disparity in different areas are the following: the dynamics of inter-fuel competition (mainly due to co-integration between natural gas and oil prices), economic growth and policy strategies (e.g. the revision in China´s policy in 2013 where they expanded the policy´s attention to include new types of gas and coal and with the aim on price rationalization and inclusive support for gas consumption. Accordingly to International Energy Agency, in 2035 the share of natural gas in the global energy industry will correspond to 24% against the 21% observed in 2011 but with the averages of 1,6% per year declining progressively until 2035. Also, in OECD view, the production in North America and Australia will increase rapidly with both regions becoming major gas exporters and production declines in Europe.
Another trend that we have identified is the existence of new sources of gas production: for example, NGLs26 which are liquids produced within a natural gas
stream. Even though this is not a new phenomenon (since NGLs production has been already occurred in Qatar in the last years) we anticipate that Russia will soon enter in this market attracted by a favourable tax environment and the possibility to export. This will eventually force natural gas prices to persist lower until the countries rich in liquids start to reduce its output. This also takes us to a prediction that NGLs will be in the front of the future upstream investments. After analysing the movements in the global gas market, we can also assure that this will not indicate a single world gas price contrary to what happens for example in the oil market. The main reasons for this are the huge cost of carrying and storing gas, when compared with a much inferior energy density as happens with oil. The LNG might be a solution for this density issue but have other threats associated as an example of the construction of LNG facilities and liquefaction infrastructures. Consequently we believe that in the coming years there will remain substantial differences prices between the US Henry Hub27 and the
respective import prices in Europe and Japan. In our valuation we have used the NG/oil parity to evaluate NG resources.
26 Natural Gas liquids
27 The Henry Hub is the price point for natural gas futures on the New York Mercantile Exchange and the prices set in
Henry Hub are used as benchmarks in the US natural gas market Huge costs of carrying
and storing gas
Inexistence of a single world gas price
Different types of natural gas price formation
Europe faces a more pessimistic scenario in this sector
GALP ENERGIA COMPANY REPORT
PAGE 23/37 Regarding the power segment, the demand for electricity is growing more than other final form of energy. Accordingly to the International Energy Agency it is estimated that global electricity demand will climb by more than 2/3s over the period between 2011 and 2035 and growing at an average of 2,2% a year. This pattern is mainly driven by an increase of population with access to electricity
supply and by an evolution in efficient energy equipment’s. Also global installed
generating capacity is expected to grow by over 70% reaching values of 9760 GW in 2035 when compared with a 5649 GW in 2012. It was also estimate that considerable investments in the power sector will be required to satisfy the rising in electricity demand and the global investment in the power sector is expected to be of $740 billion per year between 2013 and 2035. Finally, electricity prices will rise in most regions and in 2035 US industrial electricity prices will be half of those in European Union and 40% lower than those in China, when we think that markets will be less competitive.
The G&P business segment of Galp Energia includes the supply and marketing of natural gas mainly in the Iberian Peninsula; LNG trading on international markets more precisely to Asian Markets and also power generation and supply of electricity in the domestic market.
Gas
The Galp Energia segment of Natural Gas is divided into liberalized and regulated activities. The first group is segmented in liberalized procurement and liberalized distribution to consumers, while the second is divided in regulated operation of infrastructure and regulated supply. Galp Energia regulated supply is made over 6 distributions companies and operates under concessions contracts of 40 years but also through local companies (partially owned by Galp). In 2012 companies distributed an amount of 1,5 bcm28 of natural gas. The regulated
infrastructure profitability is highly dependent on ERSE29 as well as all regulated
activities in the energy sector in Portugal. Here, the returns are based on ERSE´s revenues formula and are mainly affected by the remuneration rate (9%30), which
we do not expect to change in the next years and would only change if the regulator perceived a change in the cost of capital, and by operating and amortization costs which are a percentage of the Regulated Asset Base. Regarding the remuneration rate, the concession contract with the natural gas
28 Billion of cubic meters
29 Entidade Reguladora dos Serviços Energéticos, Portugal
30Source: “Tarifas e Preços de Gás Natural para o ano Gas 2013/2014”- ERSE
NG/oil parity to evaluate NG resources
Electricity demand is increasing more than other form of energy
Considerable capital expenditures are expected in this sector
Electricity prices will rise
Galp Energia regulated supply of gas is operated under concession
GALP ENERGIA COMPANY REPORT
PAGE 24/37 suppliers ensures the concession financial stability. The regulator establishes the remuneration rate (based on information provided by Galp Energia and sets the profits allowed31) and it should be at least equal to the cost of capital for these
activities, otherwise the companies would start to disinvest. Also the regulated storage of NG in Portugal is operated by Galp Energia and has a current storage capacity of 40 mm3 with the development of a cavern equivalent to 752 000m3 and with high importance for Portugal energy security, the reason why it is operated under a public service concession.
In this sector, the company´s strategy is the creation of long term supply contracts with an average of 20 years for natural gas in Algeria and for LNG with Nigeria, accounting for 6 bcm per year. This strategy was implemented to reduce risks and volatility of costs and we expect that the contracts will be renewed on its maturity date. In the year of 2012, the company acquired a total of 6,3 bcm of natural gas which represented an increase of 12% from the previous year, of which 2 bcm came from Algeria (through three different pipelines) and 3,5 bcm of LNG were bought from Nigeria. The company is also acting in the spot market where in the same year were acquired 0,8 bcm of natural gas. Although the incidents in Egypt could lead to some apprehension on the contracts fulfilment, we do not expect a similar situation in Algeria since it political situation seems to be stable.
Regarding the liberalized distribution market, the activities are mainly divided in residential, industrial, electrical and trading segment, Galp Energia is a key operator with an estimated number of 1,3millions clients in 2012 and the second place in the Iberian Peninsula market sales transmits the significance of the operations of the company in this industry. However, there was observed a contraction in electricity generation via natural gas mainly due to a more competitive price of coal translated in a higher importance of coal in electricity production in Portugal. Also the enlarged imports of electricity produced in Spain influenced this decline in consumption in the electrical segment. Oppositely, in the industrial sector, the amounts of gas sold increased from 161mm3 in 2011 to 2 113mm3 in 2012, a great variation explained by the upgrade project in both refineries in Portugal. In fact, refineries play an important role in natural gas consumption since some unit refineries such as steam reformer32 and
cogeneration plants need natural gas on its industrial processes. In the residential sector which is much volatile, there was a decrease in 2013 in
31 Document in Appendix section: profits allowed by ERSE and remuneration rate 32 These units use natural gas as input to produce hydrogen necessary for the catalytic units
Contraction in electricity generation via natural gas
Remuneration rate is not expected to change
Remuneration rate should be at least equal to the cost of capital for these operations