THIS REPORT WAS PREPARED BY RITA BORGES, A MASTERS IN MANAGEMENT STUDENT OF THE NOVA SCHOOL OF BUSINESS AND ECONOMICS, EXCLUSIVELY FOR ACADEMIC PURPOSES.THIS REPORT WAS SUPERVISED BY ROSÁRIO ANDRÉ WHO REVIEWED THE
M
ASTERS IN
M
ANAGEMENT
E
QUITY
R
ESEARCH
FY16 price target is EUR 18.37, a 29% increase over the current price, leading to a buy recommendation.
Crude oil prices are recovering and a more optimistic
scenario is expected as Galp’s upstream projects start to mature.
The decline European refining sector affects negatively the R&M segment. Refining margin are expected to fade as the low oil price scenario vanishes.
The G&P segment remains a stable source of revenues. However, the continuous drop of tariff for special regime production has been harming the power sub segment. In addition, LNG trading activities arbitrage opportunities decline, as natural gas price converge.
Company description
Galp Energia is a Portuguese oil and natural gas integrated operator, whose activities are divided into three business segments: Exploration & Production (E&P); Refining & Marketing (R&M) and Gas & Power (G&P). Galp’s stock is listed on the Euronext Lisbon Stock Exchange since 2006. The R&M segment
represented the largest weight in Galp’s EBITDA in 2015 (39%),
followed by G&P segment (30%).
G
ALP
E
NERGIA
C
OMPANY
R
EPORT
O
IL
&
G
AS
6
J
ANUARY2017
S
TUDENT
:
R
ITA
B
ORGES
18106@novasbe.pt
Rediscovering the Portuguese
Overseas
Brazilian and Mozambican world-class assets lead
the future
Recommendation: BUY
Price Target FY17: 18.37 €
Price (as of 7-Jan-17) 14.28 €
Reuters: Galp.LS, Bloomberg: Galp PL
52-week range (€) 9.1-14.33
Market Cap (€m) 11 895.6
Outstanding Shares 829 250 635
Source: Galp Energia
Source: Galp Energia
(Values in € millions) 2015 2016E 2017F EBITDA 1 200 1 331 1 800
GALP ENERGIA COMPANY REPORT
Table of Contents
COMPANY OVERVIEW ... 3
COMPANY DESCRIPTION ... 3
SHAREHOLDER STRUCTURE ... 3
MARKET OVERVIEW ... 4
E&P ENVIRONMENT ... 4
R&M ENVIRONMENT ... 6
G&P ENVIRONMENT... 7
EXPLORATION & PRODUCTION ... 9
BRAZIL ... 10
ANGOLA ... 13
MOZAMBIQUE ... 14
REFINING & MARKETING (R&M) ...15
REFINING ... 16
MARKETING ... 17
GAS & POWER (G&P) ...18
SUPPLY & TRADING ... 19
INFRASTRUCTURE ... 20
POWER ... 20
VALUATION ...21
SOTP ... 22
VALUATION E&P ... 22
VALUATION R&M ... 24
VALUATION G&P ... 25
FINANCIALS ...27
APPENDIX ...28
FINANCIAL STATEMENTS ...29
GALP ENERGIA COMPANY REPORT
Company overview
Company description
Galp Energia, a company wholly owned by the Portuguese state, was founded in 1999 incorporating the businesses of Petrogal (oil & gas) and Gás de Portugal (utility). The company was established for the purpose of operating in the oil and natural gas businesses after the Portuguese energy sector was restructured and, in that same year, started to be privatised. Galp Energia is now an integrated energy company based in Portugal, with diversified activities worldwide divided into three business segments: Exploration & Production (E&P); Refining & Marketing (R&M) and Gas & Power (G&P).
In the E&P business segment, Galp explores, develops and produces oil and natural gas, operating in over 50 projects across seven countries. The most prominent projects are in Angola, Brazil and Mozambique, being Angola and Brazil the countries where Galp already has production assets. The R&M business segment involves the refining operations and the marketing activities of oil products. Galp operates two recently ungraded refineries in Portugal, namely in Sines and Matosinhos, with a total capacity of 330 kbopd(1). Marketing
activities involve the retail and wholesale commercialisation of refined products predominantly in the Iberian Peninsula, where Galp is a relevant player, but also in Africa. The international export market is an additional route for marketing production from refineries. The G&P business segment comprises several activities including sourcing, storage, distribution and supply of natural gas in the Iberian Peninsula, LNG(2) trading on international markets and electricity
generation and supply.
Galp shares have been traded since 2006 on NYSE(3) Euronext Lisbon, where it
is one of the most traded stocks and has a significant weight in the PSI-20, the
Portuguese market’s main stock index. At the end of 2015, Galp had a market
capitalisation of EUR 8.9bn. It is also relevant to denote Galp’s commitment to sustainable practices, having been included in 2016, for the fifth consecutive year, in the Dow Jones Sustainability Index (DJSI) World and the DJSI Europe.
Shareholder structure
Galp’s share capital is composed of 829 250 635 shares, of which 7% are held by Parpública – Participações Públicas, SGPS, S.A. (Parpública), a state-owned
(1) Thousand barrels of oil per day (2) Liquefied natural gas
(3) New York stock exchange Figure 2: EBITDA by segment
Source: Galp Energia Figure 1: Galp by business segment
GALP ENERGIA COMPANY REPORT
entity that manages the Portuguese state holding in the company. The remaining 93% have been admitted to trading on the Euronext Lisbon Stock Exchange, of which 54.66% is free float and 38.34% are held by Amorim Energia.
Galp’s shareholding structure has evolved over recent years. In 2015, Eni S.p.A. (Eni), which has been reducing its interest since 2012, sold the remaining 8% of its stake, no longer having any shareholding in Galp. Such sale increased free float from 46.66% to 54.66%. Free float exceeding 50% of the share capital means a milestone in Galp’s relationship with the capital market, contributing to its higher liquidity and exposure. Regarding Amorim Energia, 55% of its stake is controlled by Portuguese investor Américo Amorim and the remaining is
controlled by Sonangol, E.P., Angola’s state owned oil company. Furthermore, Galp’s shareholder structure has an increasing representation of international shareholders, close to 80% of total institutional investors, thereby enhancing the
geographic diversity of the company’s investor base.
Market overview
Population expansion has important implications for economic growth potential. Consecutively, economic growth, along with accompanying structural changes, strongly influences world energy consumption. As global population is predicted to rise by 1.8bn since 2015, reaching nearly 9.1bn people by 2040 and, over the same period, global GDP(4) is projected to more than double, the world primary
energy demand (including oil, coal, gas, nuclear, hydro, biomass and other renewable energies) is expected to increase by approximately 40% between 2014 and 2040. Fossil fuels dominate current global primary energy demand and even though their importance is expected to be maintained, its share in the global energy mix shall decrease slightly by 2040, as renewable energies become an increasing trend. In addition, among fossil fuels, natural gas gains importance, whereas oil and coal shares are projected to decline.
E&P environment
According to the World Oil Outlook 2016 published by OPEC(5), world oil demand
continues its upward trend, with 93 mbblpd(6) in 2015 predicted to increase to
109.4 mbblpd by 2040. Much of the increase in world’s oil demand occurs among the developing countries, where strong economic growth and expanding populations lead to a rise of around 60% between 2015 and 2040. In contrast, in
(4) Gross domestic product
(5) Organisation of the petroleum exporting countries
(6) Million barrels of oil per day Figure 3: Shareholder Structure
(31st December 2015)
Source: Galp Energia
Figure 4: World primary energy demand by fuel type (mboepd)
GALP ENERGIA COMPANY REPORT
the more mature energy-consuming and slower-growing OECD(7) economies,
total oil demand decreases by 20% from 2015 to 2040. Oil demand grows steadily, but the decline trend in its share continues, as the pressure to adopt energy efficiency and environmental measures at a global level has been increasing and more governments begin implementing plans to reduce carbon dioxide (CO2) emissions.
Oil prices stayed remarkably stable, regularly around 100 USD/bbl(8) between
2010 and mid-2014, despite many important macroeconomic and geopolitical events during the period. In mid-2014, oil prices started to decline as excess output, primarily of light sweet crudes, entered the market. Prices fell from above 100 USD/bbl in the first half of 2014 to a recent lowest level of 27.88 USD/bbl in January 2016. Low oil prices present significant challenges and uncertainties. Considering the cyclical and long-term nature of the oil industry, it needs stable and healthy oil prices to support investments in new projects. Following that, the price environment of the past two years has had clear downward implications on
the oil industry’s investment activity, with projects being deferred or cancelled. In
2015, global oil upstream investment dropped by USD 130bn and this downward trend is expected to continue in 2016, though it will likely decelerate slightly. This underinvestment may affect supply to a point where producers are unable to respond quickly to future growth in demand, resulting in an expected increase of oil prices to the range of 80 USD/bbl within the next decade. In line with the assumption that oil prices will resume growth in the coming years, it is expected
that the industry’s investment activity will see an upturn. Despite that, the extent of the impact of low oil prices on the world’s future energy mix is uncertain,
raising concerns about the sustainability of adequate supply levels in the coming years, particularly if the lower price environment extends for a longer period. The delayed supply response to lower oil prices drove to the current oversupply of the oil markets and, if anything, they are expected to remain oversupplied in the short term, keeping the forecast for annual average prices below 50 USD/bbl through at least 2017. In previous instances of oil market oversupply, OPEC members have cut production to stabilise or increase prices. However, since prices began falling in mid-2014, OPEC members have not acted together to cut production. Thus, their production has remained stable and even increased, as the members have attempted both to maximise revenue in the near term and to preserve market share. The national economies of many OPEC members are largely dependent on oil revenues, which already have been cut by the price drop, and their producers have so far been unwilling to risk further revenue
(7) Organisation for economic co-operation and development
(8) Barrel of oil
Figure 5: Brent oil price (USD/bbl)
GALP ENERGIA COMPANY REPORT
losses by decreasing production. Such outlook could change should OPEC agree on a significant cut and follow through with taking barrels off the market. But even so, such cut may not necessarily bring about a quick rebalance, given how large the oversupply is, how effectively non-OPEC supply can offset output cuts, and how resilient U.S. shale has been. For OPEC to fix market imbalances, it would have to remain committed to an extended cut that would draw down inventories over a period of at least six months.
R&M environment
Facing a low-oil-price scenario, in 2015, it was observed a boost in the acquisition and placement of crude oil and products into storage in anticipation of future price increase. With incentives to process inexpensive crude, the European refineries recorded increased utilisation rates and improved margins. Data for the first half of 2016 indicated refinery runs and margins staying firm. However, this appears to be changing in the second half of the year and now product inventories are high, which is weighing on refinery runs even though global demand is projected to rise by a healthy 1.2 mbblpd in 2016. Thus, the expectation is that the positive phenomenon that arose in the refining sector in 2015 will start to fade, indicating that it was, in part, a one-off result of market participants reacting to the sudden drop in oil prices. Consequently, those impacts cannot be expected to become a regular event of the industry going forward.
Over the past few years, Europe has been the centre of much refinery closure activity, as European refining margins shrink and hit multi-year lows. To avoid further closures, refiners are now pushing ahead with upgrades of their facilities. Nonetheless, downstream capacity rationalisation is expected in the longer term to 2040, particularly considering the trends and challenges it will face.
Petroleum product demand has been changing significantly. The demand for light products such as transportation fuel has been growing in industrialised regions, while heavy fuel oil consumption for heating and power generation has been declining. Demand has also been shifting geographically, expanding in developing regions, such as Asia and deteriorating in mature economies and industrialised regions, such as Europe, where public authorities are encouraging energy efficiency and climate change initiatives. Both energy efficiency concerns, principally knowing that the petroleum refining industry is a major energy consumer, and growth expectations of non-crude supply (such as LNG or biofuel) are leading to an inevitable slowing in the pace of oil demand growth.
Other trend impacting the refining industry is the dieselisation, an expansion of consumption of diesel, sustained by a tax policy throughout Europe that favours Figure 6: Top 3 world largest oil
refineries
Figure 7: Largest oil refinery capacity countries, worldwide and European,
2015
GALP ENERGIA COMPANY REPORT
diesel over gasoline. Diesel fuel is taxed at lower rates than gasoline both in terms of energy and carbon content. This difference is not justifiable from an environmental perspective. In fact, compared to gasoline, per litre diesel emits higher level of harmful local air pollutants (nitrogen oxide, sulphur dioxide and particulate matter, as well as CO2). In any case, such tax policy’s repercussions
are not only felt environmentally, but also in the refining sector in Europe. Despite
European’s excess refining capacity, the promotion of diesel through taxation has led to excess gasoline production capacity and a corresponding shortage of diesel production in Europe. Following that, Europe relies heavily on diesel and heating gasoil imported from Russia. In addition, export markets, especially the U.S., are less able to absorb excess gasoline. Closing the gap between diesel and gasoline taxes would impact positively the environment, but also help
European refineries to improve its competitiveness while improving Europe’s
energy security and decreasing the dependency on Russian-refined diesel. In Europe, declining demand and refinery closures are likely to result in moderate net-imports of refined products in the long-term, compared to a balanced system around 2020. European refiners are projected to come under increasing pressure not only from a decline in domestic demand, but also competition from elsewhere, such as the U.S., the Middle East and Russia.
In conclusion, facing falling oil demand, excess capacity, increasing competition, inadequate product mix and incapacitating environmental rules, European refining sector is in slow but steady decline.
G&P environment
According to the International Energy Outlook 2016 published by IEA(9),
consumption of natural gas worldwide is projected to increase from 120 tcf(10) in
2012 to 203 tcf in 2040, accounting for the largest increase in world primary energy source consumption. Such optimistic view of gas consumption over the long-term is sustained by a set of reasons, such as, vast recoverable resources, which recorded a total of 6 950 tcf as of January 2016, robust production and climate policies that support and encourage the use of natural gas, reducing both CO2 emissions and energy dependency.
Natural gas consumption in the OECD region grows by an average of 1.1% per year from 2012 to 2040, compared with the annual growth of 2.5% in the non-OECD countries, with emphasis in non-non-OECD Asia, where economic growth leads to an increase in demand. The growing importance of gas is mainly driven by rising energy needs in non-OECD countries and by fuel switching from coal to
(9) International energy agency
(10) Trillion cubic feet Source: European Federation for
GALP ENERGIA COMPANY REPORT
gas in Asia’s power generation sector. So far, economic growth in the region has
mostly been fuelled by coal and to a lesser extent oil and this shift to gas is supported by the aims of emerging nations in the region to reduce emissions.
Though most of the world’s gas demand is expected in the electricity sector,
some opportunities will also arise in the residential sector, the industry sector, including petrochemicals, and the transportation sector. For all these reasons, several energy companies have signalled their intention to shift their portfolios more towards natural gas. To meet the rising natural gas demand, the world’s natural gas producers increase suppliers by nearly 83 tcf (69%) from 2012 to 2040. Much of the increase in supply is projected to come from non-OECD countries, which accounts for 73% of the total increase in world natural gas production.
Currently there is no globally integrated market for natural gas, so pricing mechanisms are subject to regional dynamics. The three natural gas reference markets are the Henry Hub (HH), in the U.S.; the National Balancing Point (NBP), in Europe; and the Japan Korea Marker (JKM), in Asia. The natural gas price divergence observed from 2011 to 2014 has narrowed significantly and gas prices are presently very low. It is noteworthy that even though gas prices have fallen, coal prices are even lower in Europe and Asia, making it difficult for gas to compete economically at present. In the long-term, however, the introduction of environmental policies should favour gas development, given than it burns cleaner than coal or petroleum products. Natural gas emits about half to one-third of the emissions of coal when burned. Following that, a tax on carbon will increase the relative price of coal, while promoting investment in gas extraction and use, making it easier for policymakers to meet emissions targets. Such policies will also result in higher growth rates for renewables and may at times make some renewables competitive with gas as well.
Although LNG trade has grown considerably in recent years, flows of natural gas by pipeline still account for most of the global natural gas trade. In 2014, LNG accounted for 10% of global natural gas consumption and 31% of global natural gas trade. World LNG trade is expected to more than double from about 12 tcf in 2012 to 29 tcf in 2040, as the liquefaction capacity increases and as more countries choose LNG over natural gas, particularly where access to natural gas by pipeline may be limited by geographic or economic conditions. The Asia Pacific region led the world growth in LNG demand over the past decade, where Japan and South Korea continue to be major players with LNG imports representing close to 50% of the world’s total. Japan has experienced dramatic growth in LNG imports since the Fukushima nuclear disaster in March 2011
(large part of Japan’s nuclear generation capacity was shut down after the
Figure 9: Natural gas price (USD/MMBtu)
GALP ENERGIA COMPANY REPORT
Fukushima Daiichi power reactors were severely damaged by an earthquake and tsunami), with total LNG imports in 2012 approximately 25% higher than in 2010.
Beginning in 2015, there has been a gradual restart of Japan’s nuclear capacity
and as nuclear capacity in Japan is restored, world LNG markets are expected to loosen in the near term because of growing supply and weakening demand. In the context of current market circumstances, low prices and oversupply of natural gas, it should be stressed that there is uncertainty associated with the LNG outlook. The major companies that invested heavily are entering a significantly weaker international gas market than first anticipated. This raises questions regarding how much LNG will actually be exported, and how much of an impact it will have on international trade and prices. For instance, the effect on oil-indexed gas markets is still uncertain, due to the different market structures in each region and the high costs associated with liquefaction, shipping and regasification. Against the background of low prices, LNG sellers are striving to bring project costs down.
Exploration & Production
Galp Energia has an E&P portfolio which includes over 50 projects across seven countries – Angola; Brazil; East Timor; Mozambique; Namibia; Portugal and São Tomé and Príncipe – at various stages of exploration, development and production.
In 2015, Galp reached an average working interest production (WIP) of 45.8 kboepd(11), having a net installed capacity of ca. 70 kboepd. The company
expects its WIP to grow at a CAGR(12) of 25% to 30% over the 2015-2020 period,
based on the sanctioned and pre-sanctioned projects. Such growth reflects the
company’s strategic position, aiming to develop and strengthen its E&P segment by directing its resources towards Galp’s main assets, which are placed in the pre-salt Santos Basin in Brazil; in the Rovuma Basin in Mozambique and in offshore blocks in Angola. The development of the Brazilian Lula/Iracema reservoirs contributes largely to Galp’s production target, supported by Iara, Sepia East, Jupiter/Bracuhy and Carcara areas, that are yet to start production. In Angola, production has been decreasing through the natural decline of production fields in block 14. Therefore, the expected new production should be sufficient to offset such phenomenon.
Results from the third quarter of 2016 reported current production in Brazil is at 51.7 kboepd, an increase of 52% YoY, mainly due to the start-up of FPSO(13)
(11) Thousand barrels of oil equivalent per day (12) Compound annual growth rate
GALP ENERGIA COMPANY REPORT
units in Lula/Iracema field in 2015 and 2016, as well as to increased production of FPSO Cidade de Mangaratiba (#3). In Angola, current production is at 7.5 kboepd, an increase of 5% YoY, which is influenced by the start of production in block 14K.
Most of Galp’s projects are still at the initial stage of exploration, therefore their
value is unknown and very difficult to precise. Accordingly, we will focus our analysis on the core projects from which Galp is already extracting value or where there is potential value to be delivered.
Brazil
Galp is present in Brazil since 1999 and participates in 27 projects spread across seven basins, in partnership with Petrobras. Galp Energia holds 70% of Petrogal Brazil, the subsidiary through which the operations in these projects are controlled. Among the seven basins Galp participates in, Santos Basin is the most relevant. The pre-salt Santos Basin is the largest offshore sedimentary basin in Brazil, with a total area of over 350 000 km2. This area is about 300 to
350 km away from the Brazilian coast and its reserves are located beneath a layer of salt that reaches approximately 2 000 metres in thickness. Galp participates in three of its blocks – BM-S-8; BM-S-11 and BM-S-24 – in ultra-deep water, with areas ranging from 825 to 2 297 km2 and water depths between
2 000 and 2 500 metres.
Most of Galp’s development projects are concentrated in Santos Basin, being the remaining either still under the exploration phase or are not substantial enough to be meaningful, considering its size or the available information related to recoverable reserves or commercial viability. Therefore, the only fields being contemplated for valuation purposes are Lula/Iracema, Iara, Sepia East, Jupiter/Bracuhy and Carcara.
Figure 11: Brazil oil fields data
Field Block Galp’s stake Operator Stage
Lula/Iracema BM-S-11 10% Petrobras Production
Iara BM-S-11 10% Petrobras Development
Sepia East BM-S-24 20% Petrobras Development
Jupiter BM-S-24 20% Petrobras Development
Carcara BM-S-8 14% Statoil Development
Lula/Iracema: Lula/Iracema field, situated in block BM-S-11, 5 000 metres under the sea and under a 1 000 metres thick salt layer, is Galp’s main project given its productivity and its recoverable reserves. With total estimated recoverable volume of 8.3bn boe(14) (6.5bn boe in Lula and 1.8bn boe in Iracema), it is among
GALP ENERGIA COMPANY REPORT
the world’s largest offshore oil fields. In comparison, the recoverable oil reserves of the largest offshore oil field in the world, Safaniya, in the Persian Gulf, are more than four times bigger than Lula/Iracema field. In October 2010, commercial production started and, currently, Lula/Iracema counts with six operating units, three replicant under construction and one to be awarded. A list of the top 30 producing wells in the Brazilian pre-salt regarding total production was provided in the ANP(15) monthly production report. Among these 30 wells, 21 are placed in
Lula field and have an average well flow rate of 34.7 kboepd (Appendix 1). Figure 12: Lula/Iracema FPSO deployment schedule
Unit FPSO Field/Location Oil capacity (kbopd) Gas capacity (mm³/d)(16) First
oil
Status of unit
#1 Cidade de Angra dos Reis Lula - 1 100 5 2010 Producing
#2 Cidade de Paraty Lula NE 120 5 2013 Producing
#3 Cidade de Mangaratiba Iracema South 150 8 2014 Producing
#4 Cidade de Itaguaí Iracema North 150 8 2015 Producing
#5 Cidade de Maricá Lula Alto 150 6 2016 Producing
#6 Cidade de Saquarema Lula Central 150 6 2016 Producing
#7 P-66 Lula South 150 6 2017 Sanctioned
#8 P-67 Lula North 150 6 2018 Sanctioned
#9 P-68 Lula Extreme South 150 6 2017 Sanctioned
#10 P-69 Lula West 150 6 2020 To be
awarded Iara: Iara is a giant pre-salt oil field located in block BM-S-11. In 2014, the consortium submitted the Declaration of Commerciality (DoC) for three accumulations in the Iara area and extending to the Entorno de Iara area (Transfer of Rights, 100% Petrobras), designated as Atapu, Berbigão and Sururu. Following that, it was delivered to ANP the development plan for these areas in June 2015. The fields are located some 230 km off the Rio de Janeiro coast, at water depths ranging from 2 000 to 2 300 metres. The total estimated recoverable volumes of these fields exceed 5bn boe, confirming the high potential of the accumulations. The Extended Well Test (EWT) performed in 2014 revealed an average production of 29 kboepd, which we will assume as the average well flow rate.
Figure 13: Iara FPSO deployment schedule
Unit FPSO Field/Location Oil capacity (kbopd) Gas capacity (mm³/d) First oil Status of unit
#1 P-71 Berbigão/Sururu 150 6 2018 Sanctioned
#2 P-70 Atapu South 150 6 2019 Sanctioned
#3 Atapu Atapu North 150 6 2021 To be awarded
Sepia East: Sepia East field, located in block BM-S-24, is at approximately 250 km from the coast of Rio de Janeiro, at a depth of 2 165 metres. The field’s total
(15) Brazilian national agency for oil, natural gas and biofuel
GALP ENERGIA COMPANY REPORT
recoverable volume is estimated at 0.13bn boe. In 2015, a DoC, which revealed excellent porosity, permeability and high-quality oil, was submitted for the Sepia East area to be unitised with Sepia area (Transfer of Rights, 100% Petrobras), whose DoC had already been submitted in September 2014. In 2016, the consortium plans to submit the development plan for Sepia and Sepia East, and so, we assume Sepia East field will produce through Sepia FPSO unit. Due to lack of information from well tests, given that an EWT will only be perform throughout 2016, we will assume a conservative average well flow rate of 15 kboepd.
Figure 14: Sepia East FPSO deployment schedule
Unit FPSO Field/Location Oil capacity (kbopd) Gas capacity (mm³/d) First oil Status of unit
#1 Sepia Sepia 180 5 2020 To be awarded
Jupiter/Bracuhy: Jupiter, in block BM-S-24, is in water depths of approximately 2 200 metres, about 300 km south of Rio de Janeiro. It is an important discovery of oil, condensates and natural gas mixed with CO2. Galp believes that, adjusted
for gas and CO2, it has heavy oil and condensates resources in excess of 3bn
boe, which will be our assumption of estimated recoverable reserves for this field. In 2015, the consortium submitted an application to ANP for a five-year extension of the exploration period before submission of the DoC for the Jupiter area, which was granted in early 2016. This extension will allow time for a more in-depth analysis of current data and further technological studies. Consequently, the DoC submission was extended until 2021, which led us to assume a delay in the deployment of the Jupiter FPSO to 2022. Extending appraisal activities will be fundamental to determine if the consortium should include more than one FPSO unit in the development plan of Jupiter field. Even though we acknowledge that option, we will assume only one FPSO unit for the moment. Due to lack of information from well tests, we will assume a conservative average well flow rate of 15 kboepd.
Figure 15: Jupiter FPSO deployment schedule
Unit FPSO Field/Location Oil capacity (kbopd) Gas capacity (mm³/d) First oil Status of unit
#1 Jupiter Jupiter 150 6 2022 To be awarded
Carcara: Carcara field, the most significant discovery in block BM-S-8, has one of the best rock quality identified in the pre-salt Santos Basin. In 2015, the consortium continued with appraisal activities to better define the development plan for the area and the DoC is expected to be submitted in 2018. Those activities confirmed the extent of the light oil discovery. The sale, in July 2016, of
GALP ENERGIA COMPANY REPORT
decision after 2020, predicting that production from Carcara would begin in the middle of next decade. Given that, and taking into consideration the previous decisions made by Petrobras, we will assume one FPSO unit to be deployed in 2022 and start production in the following year. A Drill Stem Test (DST) was performed at two intervals in the Carcara North reservoir, indicating excellent levels of productivity. Well production potential is estimated to be equivalent to or better than the best producer wells in the pre-salt Santos Basin, and so, we assume average well flow rate of 25 kboepd.
Figure 16: Carcara FPSO deployment schedule
Unit FPSO Field/Location Oil capacity (kbopd) Gas capacity (mm³/d) First oil Status of unit
#1 Carcara Carcara 150 6 2023 To be awarded
Angola
Galp Energia is present in Angola since 1982, an important country in the
company’s strategy, currently participating in 12 projects. Galp’s main assets
consist of two production units: a CPT(17) in the BBLT(18) field (block 14), that also
includes production from Lianzi field in block 14K, and a CPT in the TL(19) field
(block 14). Galp has offshore assets under exploration in blocks 14 and 32. The company is also taking part in Angola LNG II, an integrated natural gas project, still in the initial phase of exploration, whose goal is to research, explore, certify and produce natural gas reserves.
Figure 17: Angola oil fields data
Field Block Galp’s stake Operator Stage
BBLT Block 14 9% Chevron Production
TL Block 14 9% Chevron Production
Lianzi Block 14K 4,5% Chevron Production
Kaombo Block 32 5% Total Development
Block 14: Galp has been producing oil in block 14 since 1999. This block is composed of 8 development areas, namely: Kuito, BBLT, TL; Negage, Gabela, Malange, Lucapa and Menongue. The first three areas correspond to the fields that already reached the production phase, while the remaining five are under a programme for development. At the end of 2013, the FPSO unit for the Kuito field was demobilised, having been in production since 1999. This was due to the maturity of the field and the high costs of maintenance that did not justify further operations. Currently, Galp has two production units in block 14, the CPT in the BBLT field and the CPT in the TL field. Production in the BBLT was initiated in 2006, having already reached a maturity stage. CPT in TL field, one of the
(17) Compliant piled tower
(18) Benguela-Belize-Lobito-Tomboco
GALP ENERGIA COMPANY REPORT
boldest engineering projects ever made, started production in 2009, having capacity for 130 kbopd.
Block 14K: Block 14K is located on the border between Republic of Angola and Republic of Congo. Lianzi field is in a unitised zone between those two countries, about 105 km offshore, at water depths ranging from 820 to 1 070 metres. The technical option adopted for the development of this project was to connect the discovery with the BBLT platform. During 2015, the Lianzi field tie-back to the CPT platform in the BBLT field in block 14 was completed and in the fourth quarter of 2015 Lianzi’s production was initiated.
Block 32: In block 32, 14 discoveries have already been made. Their geographic dispersion requires a technical development concept that unites several discoveries. The Kaombo project is located 260 km offshore of Luanda, in waters with a depth between 1 400 and 1 900 metres. During the last quarter of 2015, the consortium proceeded with the Kaombo field development activities, initiating the drilling.
Figure 18: Kaombo FPSO deployment schedule
Unit FPSO Field/Location Oil capacity (kbopd) First oil Status of unit
#1 Leased Kaombo North 125 2017 Sanctioned
#2 Leased Kaombo South 125 2018 Sanctioned
Mozambique
Galp’s presence in Mozambique in the E&P segment was established in 2007,
when the company signed a farm-in agreement for the exploration of area 4, in the Rovuma Basin’s ultra-deep water, the most important Mozambican discovery so far. Located at 2 000 km away from Maputo, with about 180 tcf of gas, Rovuma Basin is divided in six areas. Area 4, covering 10 000 km2 in the
Rovuma Basin, is the world’s fifth largest natural gas discovery in the last 30 years, with more than 85 tcf estimated natural gas resources in place. Galp is a member of the consortium for area 4 with a 10% stake, along with Eni East Africa (operator) with a 70% interest, and Kogas and Empresa Nacional de Hidrocarbonetos (ENH), each with a 10% interest. China National Petroleum Corporation (CNPC) has an indirect stake of 20% through Eni East Africa.
The initial development plan for area 4 includes the development of the Coral and Mamba fields. In February 2016, the development programme for the first phase of the Coral discovery was approved by the country’s authorities. The project plans to bring 140 bcm(20) of gas into production through the construction of a
FLNG(21) with a capacity of 3.4 mtpa(22), supplied by 6 subsea wells with start-up
(20) Billion cubic metres
GALP ENERGIA COMPANY REPORT
in 2021. Also, the consortium finalised a long-term LNG sales contract with BP, which will last 20 years. Regarding the Mamba project, the unitisation process with the Prosperidade reservoir, placed in area 1, was concluded in 2015, resulting in a reduction of the development costs for the consortium given the combination of efforts. This project foresees, in the initial stage, the construction of two onshore LNG trains with a combined capacity of 10 mtpa and the drilling of 16 subsea wells, with start-up in 2022, for the production of 340 bcm of gas.
To value Galp’s 10% stake in area 4, we will use transaction multiples from recent Rovuma Basin’s deals. Regardless of the still uncertain quantity of natural gas in this basin, such amount has been increasing with recent developments from exploration and appraisal activities.
In 2012, Cove Energy Plc. sold its 8.5% share of area 1 to PTTEP(23) for
USD 1.92bn. At that time, estimated reserves for area 1 were 60 tcf, resulting in multiple of 376.5 USD/MMcf(24). In 2013, Videocon sold its 10% stake in area 1 to
both OVL(25) and OIL(26) (60% and 40%, respectively) by USD 2.475bn. With
2013 appraisal and exploration activities estimating recoverable natural gas resources at 65 tcf, the transaction multiple was 380.8 USD/MMcf. During the same year, another transaction was made in area 1. Anadarko Petroleum Corporation entered into an agreement with OVL to sell its 10% share for USD 2.64bn, resulting in a multiple of 406.2 USD/MMcf.
Regarding area 4, Eni sold a 20% share to CNPC for USD 4.21bn, in 2013. At that time, estimated reserves for area 4 were 75 tcf, resulting in multiple of 280.7 USD/MMcf. More recently, in 2016, it was confirmed that ExxonMobil will be a partner in the exploration of natural gas reserves in area 4. The consortium benefits from such entrance, as the American company is a world class LNG operator that has experience in the development of similar scale LNG in Qatar. Even though the exact value of the deal is still unknown, it is expected to be in the billions, judging by CNPC’s deal. Regardless, an acquisition in a declining prices period may result in a lower cost for ExxonMobil, comparing to CNPC, when oil prices were much higher.
Refining & Marketing (R&M)
Galp operates an integrated refining and marketing business. Its refining system comprises two recently upgraded refineries in Portugal and the largest part of its
(22) Million tonnes per annum
(23) PTT exploration and production public company limited; subsidiary of the Petroleum Authority of Thailand
(24) Million cubic feet
(25) ONGC Videsh Limited; ONGC stands for oil and natural gas corporation
(26) Oil India limited Source: Galp Energia
Figure 19: Galp Energia’s block in
GALP ENERGIA COMPANY REPORT
marketing activities are located in Iberia, which allows for relevant synergies and competitive advantages. Its vast oil product distribution network makes Galp one of the leading operators in the region. The company is also present in selected African markets in oil marketing activities.
Galp seeks to extract more value from its R&M business by improving its competitive position within the European refining industry and in marketing oil products and related services in Iberia and Africa. The R&M business is an important source of cash flow for Galp. Planned initiatives will focus on increasing the profitability of its activities in order to maximise cash flows to support the
company’s growth plan, currently focused on E&P.
Refining
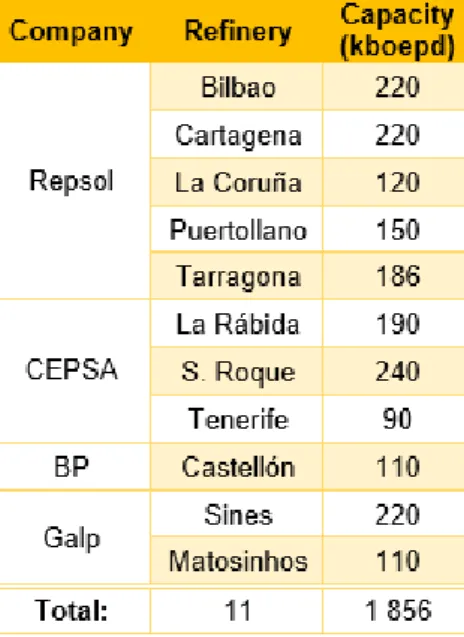
Galp Energia has a fully integrated refining system, that comprises two refineries on the Portuguese coast, namely in Sines and in Matosinhos. With a current refining capacity of 220 kboepd, Sines refinery, a hydrocracking refinery, is the main in Portugal and one of the largest in Europe. Matosinhos refinery, with a refining capacity of 110 kboepd, is a hydroskimming refinery and has an aromatic plant, a base oil plant and a lubricant plant inside. Even though Galp owns the only two refineries located in the Portuguese territory, the company represents solely 18% of the Iberian capacity, as another 9 refineries, owned by Repsol, CEPSA and BP, are placed in Spain with capacities ranging between 90 and 240 kboepd. The largest one in the Iberian Peninsula, the Gibraltar-San Roque, is owned by CEPSA.
Acknowledging the declining situation in the European refining sector and the need to improve energy efficiency and to better respond to consumption trends, Galp invested EUR 1.4bn in its refineries upgrade project, that has been at the commercial production stage since January 2013. This investment aimed to optimise and maximise the refineries’ capacity utilisation, through the adjustment of its production profile to the needs of the Iberian market, by increasing the production of diesel, mostly at the expense of fuel oil, whose market value is lower. During the third quarter of 2016, the production of middle distillates (diesel and jet) accounted for 46% of total production, whereas gasoline production accounted for 21%, in line with the previous year. In addition, Galp is now able to adapt more efficiently to the market conditions due to the technology used, that boosts the flexibility on the selection of crude oil to be processed. Therefore, the increased use of heavy crude oil, which is usually available on the market at lower prices than light crude oil, reduces raw material costs. In the third quarter of 2016, crude oil accounted for 90% of raw materials processed, of which 92% corresponded to medium and heavy crudes.
Figure 20: Refineries in Spain
Figure 21: Iberian Peninsula refining capacity
GALP ENERGIA COMPANY REPORT
Higher diesel production, greater relevance of medium and heavy crudes in the basket of crudes processed together with the increased utilisation rate are the elements that ensure Galp’s competitiveness in the medium/long run. The total investment is expected to contribute to a 3 USD/bbl positive impact in refining margin, attainable in the long run as the company remains focused on the strategic objective of maximising energy efficiency and optimising refining processes. However, Galp has been experiencing a lower premium to the benchmark margin, yet positive, recording, during the third quarter of 2016, 1.1 USD/bbl.
Despite Galp’s effort to achieve its expectations, it is not the only determining factor, as refining margins are also affected by cracks, that are, in turn, influenced by crude oil and refined product prices. During the third quarter of
2016, Galp’s benchmark refining margin decreased YoY to 2.3 USD/bbl following the lower gasoline and diesel cracks. In that sense, Galp’s refining margin over that period was 3.4 USD/bbl. To support better margins than its benchmarks, Galp also counts with the geographic location of the refineries and a robust logistic system. The refineries are strategically positioned to satisfy the immediate demand (the two main cities in Portugal, Lisbon and Oporto) and near the coast, making it ideal for crude supply and exporting the excess products.
Marketing
Marketing oil products involves selling refined products and LPG(27) to direct
clients, through retail and wholesale channels. Although Galp’s focus is on sales to direct clients, the company also guarantees suppliers to other operations in the Iberian Peninsula and operates in the international export market. In 2015, the company sold 18.6 mton(28) of oil products.
Sales to direct clients in Iberia and some selected African markets are a primary
focus of Galp’s marketing business, in opposition to international exports, given that the company prioritises markets closer to the refining system. In that sense, these markets are believed to have the greatest value creation potential based
on the company’s geographic advantages of refining and logistics assets. In spite of Galp’s largest part of transportation infrastructures and storage facilities of crude oil and oil products are situated in the Iberian Peninsula, the company has around 150 service stations and 21 storage facilities outside Iberia, with a growing international presence in African countries. Galp’s Iberian logistics network comprises several wholly owned storage parks, port facilities access and
(27) Liquefied petroleum gas
(28) Million tonnes
Source: Galp Energia Figure 22: Galp Energia’s storage
GALP ENERGIA COMPANY REPORT
equity holdings in logistics companies in Portugal and Spain, promoting efficient product delivery and assuring high flexibility in sales and distribution.
In 2015, sales to direct clients totalled 9.1 mton (ca. 49% of total sales volume), with 8% of these sales deriving from African markets, where Galp’s marketing of oil products activities have been growing in recent years, particularly in Angola, Cape Verde, Gambia, Guinea-Bissau Mozambique and Swaziland.
By the end of 2015, the Iberian market for oil products was estimated at 60.1 mton and Galp Energia, with a network comprising around 1 297 service stations in Iberia, leads the way in marketing oil products within Portugal and has a
growing presence in Spain. The company’s retail market share based on sales volumes in Portugal was around 30%, maintaining its leadership position, and 5% in Spain. According to IEA, in 2014, Galp’s main competitors were Repsol, CEPSA and BP, accounting these four operators around 67% of the Portuguese retail market. Several small independent players are also involved in the retail market (20%) alongside the major supermarket chains (13%). Marketing activities have been generating stable earnings over the years and to sustain its leadership in the Portuguese retail market, Galp maintained its successful partnership with the largest food retail group in Portugal (Sonae), reaching 1.35 million customers, in 2015. Galp's wholesale business markets oil products to the aviation, contractors, industry sub segments, lubricants marine and transportation.
Taking advantage of the location economic benefit, Galp also assures, through a stable share of the production from its refineries, sourcing to other operators in Iberia, at the expense of the export market. In 2015, sales to other operators totalled 3.4 mton (ca. 18% of total sales volume).
As an additional route for marketing production from refineries, Galp exports outside of the Iberian Peninsula reached 6.1 mton (ca. 33% of total sales volume), an increase of 46% YoY, with the turnaround at the Sines refinery during 2014 affecting the volume of products available for export in that period. In that sense, exports’ contribution is less stable than the others, as it is a way of offloading production from Galp’s refineries, although it continues to explore opportunities in other markets.
Gas & Power (G&P)
GALP ENERGIA COMPANY REPORT
currently the only Iberian operator with a triple offering of oil products, natural gas and electricity. The share of natural gas and electricity in the European and global energy is expected to continue to grow over the coming decades, making Galp's G&P business an essential pillar in its strategy as an integrated energy player.
Supply & Trading
Galp’s supply & trading activities encompass liberalised and regulated natural gas supply to the end users in the Iberian Peninsula and the LNG trading on international markets, where it has been consolidating its trading activities, reaching a total of approximately 7.7 bcm of natural gas sold in 2015. To satisfy its natural gas demand and assure its supplier position, Galp has long-term sourcing contracts with Sonatrach (Algeria) and NLNG (Nigeria) and maintains an active presence in the spot market.
Galp’s activities concerning natural gas sales to direct clients in Iberia are mainly addressed to the industrial, electrical and retail segments. The natural gas in the Iberian market was estimated at 31.5 bcm in 2015 and Galp maintains a stable demand of approximately 4 bcm per year, with a significant client base of around 606 thousand clients at the end of 2015. In 2015, natural gas sales to the industrial segment decreased to 2 397 mm3(29), caused by a decline in demand
from large industrial customers, particularly in Portugal. Natural gas consumption in the electrical segment increased to 1 082 mm3, in consequence of higher
consumption of natural gas for power generation in Portugal, in replacement of other energy sources, such as hydropower. In the retail segment, natural gas volumes declined to 365 mm3, due to stronger competition in Iberia and, also,
due to the sale of its residential natural gas supply business in Madrid, Spain. In 2010, Galp Energia and Morgan Stanley Infrastructure acquired jointly the gas distribution and supply businesses in the region of Madrid for EUR 800 million, being Galp responsible for the commercialization activity, whose acquisition cost totalled EUR 55.9 million. Five years later, Galp sold its natural gas trading activities to Endesa by EUR 34.7 million, resulting in a net capital loss of EUR 12.6 million. This transaction follows Galp’s objective of focusing Spain’s marketing operations on the commercial and industrial segments. In addition, Galp reduces its exposure to the gas segment and rises capital to invest in its strategic priority, the E&P segment.
The international LNG trading is a growing business that has been allowing Galp to develop relevant expertise and to successfully access and expand into important LNG markets. The company has been intensifying its LNG trading
(29) Million cubic metres Figure 24: Portuguese natural gas supply structure in the liberalised
market by supplier, 2015
Source: ERSE Source: Galp Energia Figure 23: Natural gas sourcing in
GALP ENERGIA COMPANY REPORT
activities in high-value markets, such as Asia and Latin America, and, more recently, it has been pursuing new opportunities in the international market, including network trading opportunities in Spain and France. In 2015, Galp recorded a new high in volumes sold in this segment, 3 822 mm3.
Infrastructure
Galp’s operations concerning natural gas storage and distribution infrastructures are regulated by ERSE(30), the Portuguese energy market regulator that sets the
rules for the level of return allowed from the energy sector’s regulated activities. Allowed revenues, on which natural gas distribution tariffs are calculated, are a function of the cost of capital of the investments made, the recovery of operating costs, and other adjustments. The cost of capital is calculated as the product of the regulatory asset base (RAB), which was approximately EUR 1.1bn in 2015, by the rate of return (RoR) plus asset amortisation. Other adjustments included mainly the tariff deficit that is defined as the difference between actual and estimated allowed revenues for year n-2. The RoR is set by the regulator and is indexed to the average Portuguese sovereign 10-year bond yields. Regarding the 2015-2016 regulatory gas year, the established RoR was 7.94%, 0.47% lower than the one determined for the 2014-2015 regulatory gas year, reflecting the yields of benchmark bonds in that period.
Galp has stakes in nine natural gas distribution companies in Portugal, five of which are regional distribution operators that operate under 40-year concession contracts (Beiragás, Lisboagás, Lusitaniagás, Setgás and Tagusgás) and the remaining four are local distribution operators that operate under 20-year licence agreements (Dianagás, Duriensegás, Medigás and Paxgás). In 2015, Galp’s distributor network had 12 533 km with subsidiaries distributing around 1.4 bcm of natural gas by their infrastructure.
Power
Galp’s power business aims to develop a competitive power generation portfolio and the trading and supply of electricity. The company develops its presence in the power generation business mainly through its two cogeneration plants in Portugal, each with an installed capacity of 82 MW(31), in Sines (Sinecogeração)
and in Matosinhos (Portcogeração). Cogeneration consists of the local recycling of residual heat generated in the thermodynamic processes of electric power generation that might otherwise be lost. In 2015, Galp’s total installed capacity was 173 MW, including other partially owned cogeneration plants (Carriço and
(30) Entidade reguladora dos serviços energéticos (Portuguese energy market regulator)
GALP ENERGIA COMPANY REPORT
Agroger), and electrical power totalled 1 268 GWh(32), corresponding to a natural
gas consumption of 450 mm3.
Currently, these cogeneration plants are Galp's single source of electric power generation under special regime production. Special regime production is a type of electrical production through sources recognised as renewable along with cogeneration. And so, it is environmentally advantageous and in certain cases more efficient (particularly in the case of cogeneration, a process based on recovering wasted heat), with the important goal to diversify primary energy sources, reducing external dependency. Due to this advantages, energy produced through special regime production has priority access to the grid and is sold at a regulated tariff, which are responsibilities managed by the Portuguese entity ERSE.
However, the Portuguese tariff deficit has been increasing substantially, recording EUR 4.69bn by 2014. The accumulated tariff debt emerged more deeply in 2007 and 2008, with a major mismatch between the wholesale energy price and the price implied in the tariff, corrected since 2009, and, more recently, with rising subsidies to renewable energy and legacy support to thermal electricity generation. The guarantee of attractive tariffs (feed-in tariffs) resulted in an increase of both installed capacity and electricity supply, considered by many as excessive. In that sense, such favourable circumstances shall change, as the Memorandum of Understanding (2011) mentioned the need to review the efficiency of support schemes for cogeneration and propose possible options for
adjusting downward the feed-in tariff used in cogeneration (reduce the implicit
subsidy).
Galp operates in the MIBEL(33) for the purchase of electricity and its sale,
afterwards. The company currently supplies power to clients, mostly in the manufacturing and service sectors, in very high, high, medium and special low voltages. Electricity supply allows Galp to further complement its natural gas activity and supports a combined offering in the Portuguese market, namely to the residential segment. The Energia3 programme launched in 2014, in which oil
products, natural gas and electricity are offered at a discount, has been a differentiator in the market, with a positive impact in customer acquisition and retention. In 2015, electricity sales totalled 3 336 GWh and Galp recorded around 267 thousand contracts.
Valuation
(32) Gigawatt-hour
(33) Iberian electricity market Source: ERSE Figure 25: Portuguese electricity supply structure in the liberalised
GALP ENERGIA COMPANY REPORT
SOTP
To value Galp Energia we followed the sum-of-the-parts (SOTP) approach. As the business environment to which each segment is subjected differs, so does the risk and the challenges faced by Galp. And so, by breaking up the company, valuing separately each of the business segments, we can more accurately identify the market trends and the value drivers of each activity.
To obtain the WACC(34) used as discount rate, we computed the cost of equity for
each segment by applying the CAPM(35). As a risk-free rate, we used the yields
from the 10-year U.S. Treasury Bond for the E&P segment, since the transactions occur mainly in USD, and the 10-year Germany Government Bond for the R&M and the G&P segments, where the transactions are in Euros. The market risk premium was set at 6%, a consensus among the financial literature. Finally, to obtain the beta used in CAPM we unlevered the betas from comparable companies with similar business and risk and, then, relevered them using a target debt-to-equity ratio, which it is assumed to be the debt-to-equity average of each industry comparable companies. For the cost of debt, we added a default spread to the risk-free rate. As Galp is not rated by rating agencies, we relied on comparable companies’ ratings, such as EDP, REN and Iberdrola, to arrive at a Baa2/BBB rating, with an associated default rate of 2.25%. The taxed rates used are different depending on the activities’ respective markets.
Figure 26: Valuation assumptions
β
UD/E
β
Lr
fMRP
r
er
dt
cWACC Growth
E&P Brazil 0.92 29% 1.19 2.45% 6% 9.58% 4.7% 34% 8.19% Angola 0.92 29% 1.19 2.45% 6% 9.58% 4.7% 50% 8.03%
R&M R&M 0.66 57% 1.03 0.27% 6% 6.44% 2.5% 23% 5.48% 1% G&P Gas 0.47 104% 0.95 0.27% 6% 5.99% 2.5% 23% 5.12% 1% Power 0.37 109% 0.77 0.27% 6% 4.91% 2.5% 23% 4.28% 1%
Valuation E&P
In our valuation of E&P segment, each field was valued separately, discounting
Galp’s cash flows at the WACC estimated for Brazil and Angola. The cash flows last until the end of the project life and take into consideration the company’s participation in each consortium. In addition, the projects in Brazil need to be adjusted considering that Sinopec owns 30% in Petrogal Brazil.
Regarding taxes, Galp deals with two different tax regimes. In Brazil, Galp operates under concession contracts and governmental payments include royalties (10% of gross revenue), special participation tax (SPT - between 0%
(34) Weighted average cost of capital
GALP ENERGIA COMPANY REPORT
and 40% of taxable income, depending on annual production) and corporate tax (34% of taxable income post SPT). In Angola, the tax regime is applied to Production Sharing Agreement (PSA), where the oil produced is divided in two parts, the cost oil and the profit oil. The cost oil is the fraction of production that is allocated to recovering Galp’s costs, while the profit oil is shared between the concessionaire (Sonangol) and Galp, the latter being subject to oil income tax. As this tax is similar to a corporate income tax, Galp is not subject to other income taxes in Angola.
To decide on the reserves estimates, the first oil, the number of FPSO and its deployment schedule, we rely on the guidance from Galp Energia and its consortium partners. We assumed a ramp-up period of 13 months, given the recent progress made in Lula/Iracema field, followed by 7 years at plateau before production experiences a decline until the concession period ends. The production phase is expected to last up to 27 years in Brazil and 20 years in Angola. Capacity installed is influenced by the number of FPSO units deployed in each field and their respective capacity. Further, we will assume 90% as the maximum utilisation rate of that capacity. Regarding well productivity, the average well flow rate ranges between 15 and 35 kboepd. The quantity of producer and injection wells required in each field is conditioned by the number of FPSO units and by the well productivity of each field. We will assume that, on average, for one FPSO unit with capacity of 150 kbopd (188 kboepd including natural gas capacity) and considering an average well flow rate of 20 kboepd, it is required a total of 18 wells (9 producer and 9 injection).
Regarding capital expenditures, the consortium investments include finding costs, well development, subsea equipment and FPSO units. Galp guides finding costs for ca. 1.1 USD/boe in CMD(36) 2014. The well development costs are a
function of the cost of drilling a well, which is, on average, ca. USD 1 million per day; the number of days spent on drilling operations and the number of wells drilled. The consortium benefits from learning curve and is optimising well design, which led to a reduction in average well drilling and completion duration from 239 days in 2010 to 110 days in 2015. We expected such improve to proceed, knowing that the best performance up to now and long-term ambition is 75 days. Petrobras states that a FPSO unit price ranges between USD 1.5bn and USD 1.8bn, so we will assume a cost of USD 1.7bn. Regarding subsea
equipment, on average, a subsea tree costs USD 5.5 million, but Petrobras’
ability to negotiate lower contract values of ca. USD 3 million is due to large volume orders.
GALP ENERGIA COMPANY REPORT
In 2015, production costs stood at 9.8 USD/boe and DD&A(37) at 14.8 USD/boe.
Nevertheless, these are expected to decrease, standing at 7.8 USD/boe and 14 USD/boe, respectively, by 2020, benefiting from the dilution effect, as production intensifies. In relation to Brent crude oil prices, the segment’s major value driver, it follows the crude oil futures price and is expected to be around 59 USD/bbl by 2017 and, following an increasing trend, reach around 61 USD/bbl by 2024, remaining stable afterwards. Considering the differences in API gravity(38),
we have traded the Brazilian oil at a 5% discount to Brent prices and the Angolan oil at 3%.
Regarding Galp’s project in Mozambique, our valuation is based on the previously obtained transaction multiples. We will assume a multiple of 280.7 USD/MMcf, as it is the Eni’s closest estimation for area 4. The operator’s investment plans and the expectation of rising energy prices in next few years intend to mitigate the current volatility in energy markets. However, given the unpredictability that poses some downside risks, we will consider a discount over the multiple of 20%, resulting in a valuation of EUR 1.7bn for Galp’s stake. And so, we obtained an enterprise value for the E&P segment of EUR 8 918 million.
Valuation R&M
In our valuation of Galp’s R&M segment, we use a DCF approach to value the
two activities separately, as they make sense as an integrated business but are subject to different value drivers. The forecasted period considered was until 2021, using the WACC as the cash flow discount rate. From then onwards, the terminal value considers a terminal growth rate of 1% in line with inflation rate. The key value drivers of EBITDA refining business are refining capacity utilisation
rate, benchmark refining margin, Galp’s premium to the benchmark and refining
cash costs. Even though Galp is benefiting from its refining system upgrade through a premium to the benchmark refining margin, the company is still exposed to the risk of low refining margins. The European environment, embodying Galp, is currently dealing with excess capacity, falling oil demand and rigid environmental rules, pressuring downwardly the refining margins. Nevertheless, the current low oil prices environment may be determinant to regain the industry competitiveness, increasing the refining margin and decreasing refining cash costs. Galp foresees a capacity utilisation rate ranging
(37) Depreciation, depletion and amortisation
(38) American petroleum institute. API gravity measures the density of liquid petroleum products. The higher the API
gravity, the less dense oil is, therefore, the lighter it is. Light oil is preferable to heavy oil and receives a higher price on commodity markets, as it contains greater quantities of hydrocarbons, producing a higher percentage of gasoline and diesel fuel when converted by an oil refinery.
Source: Chicago Mercantile Exchange Figure 27: Brent crude oil futures
GALP ENERGIA COMPANY REPORT
between 80% and 85% in the medium/long term. The refinery’s utilisation rate of Galp in 2015 was 85%, with 102 012 kbbl(17) of crude processed, the highest
value recorded up to now. Following that utilisation rate record and the purpose of the recent upgrade to maximise the refineries’ capacity utilisation, we will assume such range in our valuation. Crude oil prices are expected to increase, consequently rising the input costs of refineries, leading refining margins down. In line with Brent price assumption below 65 USD/bbl, refining margin benchmark will gradually decline towards 2.5 USD/bbl by 2021. Additionally, considering its
competitive advantages, Galp’s premium to the benchmark shall increase to
1.5 USD/bbl, suggesting a refining margin of 4 USD/bbl by 2021. The refinery cash costs, should stabilise at 2.6 USD/bbl, following, on one hand, the increase in utilisation rates, diluting fixe costs, and, on the other, the higher costs of inputs. Concerning marketing, it is a stable business and we expect it to continue that way. The forecasted EBITDA marketing business is mainly driven by total sales of refined products, which should stay close to 18 mton. These are dependent on both Brent prices and the evolution of demand in the markets Galp is inserted in. The economic recovery in Iberia shall allow not only an expansion in demand, but also a higher willingness to pay, as Brent prices are expected to rise. In addition, assuming Galp retains its position in the market, marketing margins should remain stable as the company has a high degree of control over them and is able to reflect possible increases in operating costs in higher final prices. On the other hand, it is important to state that renewable energy is an increasing trend that should pressure oil products sales downwards in the medium/long run.
Regarding capital expenditures, significant investments are not anticipated, now that refineries were recently upgraded. Therefore, investments will be mainly due to maintenance and to cover depreciations.
We obtained an enterprise value for the R&M segment of EUR 2 751 million.
Valuation G&P
In our valuation of Galp’s G&P segment, we use a DCF approach to value the
supply & trading, the infrastructure and the power business separately. The forecasted period considered was until 2021, using the WACC for gas and for power business as the cash flow discount rate. From then onwards, the terminal value considers a terminal growth rate of 1% in line with inflation rate.
Galp’s supply & trading business is centred on two markets, the Iberian and the international. The Iberian market evolution, comprising the development of each segment (retail, industrial and electrical), contributes to a Galp’s stable demand