Genetic characterization of the population of São Luís, MA, Brazil
Francileide Lisboa Ferreira
1, Emygdia Rosa Leal-Mesquita
1, Sidney Emanuel Batista dos Santos
2and Ândrea Kely Campos Ribeiro-dos-Santos
21
Universidade Federal do Maranhão, Laboratório de Genética e Biologia Molecular,
São Luís, Maranhão, Brazil.
2
Universidade Federal do Pará, Laboratório de Genética Humana e Médica, Belém, Pará, Brazil.
Abstract
Five loci (vWA1, F13A1, D12S67, Apo-B and D1S80) were investigated by polyacrylamide gel electrophoresis followed by silver staining in a sample of 177 individuals from the population of São Luís, State of Maranhão, Brazil. A total of 70 different alleles were identified. A statistically significant deviation from the Hardy-Weinberg equilibrium was observed in a single locus (F13A1, p = 0.0075). The average heterozygosity (H) was estimated at 77.7%, the mean number of alleles per locus as 14. The PD (capacity of genotype differentiation at each locus) ranged from 88.9% (vWA1) to 96.7% (F13A1). The combined PE (power of exclusion) of these five loci was 99.8%. In terms of racial admixture (42% European, 39% Indian, and 19% African Black ancestry), São Luís presented an estimate similar to Belém, another trihybrid Amazonian population.
Keywords:Amazon region, DNA, polymorphisms, VNTRs, STRs, interethnic admixture. Received: July 22, 2003; Accepted: September 3, 2004.
Introduction
The city of São Luís, capital of the State of Maranhão, Brazil, was founded in 1612 by the French, the first Europe-ans who had contact with the native people of the region, i.e., Indians of the Jê and Tupi-Guarani groups. Three years later came the Portuguese, who expelled the French and set-tled in the city, bringing along their model of manufactur-ing colonization with the use of slave labor (Tavares, 1979; Mota and Mantovani, 1998). Dutch colonizers also partici-pated in the colonization of the city in 1641, but were ex-pelled by the Portuguese in 1643 (Moraes, 1987).
The first record of African slaves trading to Maranhão dates back to 1655. Those people were compulsorily intro-duced from Guinea-Bissau, Togo, Benin, Nigeria and An-gola, and, to a lesser extent, from Senegal, Gambia, Guinea, Upper Volta, Ghana, Congo and the Cabo Verde, São Tomé and Principe archipelagoes (Meireles, 1994). Slave trading lasted a total of two hundred years in Maranhão. In 1822, the population of the Province of São Luís consisted of 152,893 inhabitants, 77,914 (51%) of which were slaves. The final estimate of the number of African slaves brought to Maranhão during the period from 1655 to 1822 was
187,000, corresponding to 8.3% of the 2,250,000 slaves imported to Brazil during that period (Meireles, 1994).
Santos and Guerreiro (1995) investigated 13 genetic markers (HP, CP, TF, ALB, CHE1, CHE2, ABO, RH, ESD, CA2, ACP, GLO and HBB) in a total of 5,417 indi-viduals from 11 populations of the Brazilian Amazon Re-gion (Manaus, Parintins, Caari, Oriximiná, Óbidos, Santarém, Castanhal, Belém, Alenquer, Monte Alegre and Bragança). Their results showed that in most towns the Amerindian contribution (41%) was greater than the Afri-can Black (12%), but smaller than the Caucasian (47%). The authors suggested the existence of approximately four million Amerindians amalgamated into the urban popula-tion of the Amazon Region.
Since 2002, many papers have been published de-scribing the variability of STRs and VNTRs in the Brazil-ian population: for the Northeast, data from the States of Alagoas and Bahia (Ferreira-da-Silvaet al.,2002; Santoset al., 2004); for the Southeast, from São Paulo and Rio de Ja-neiro (Bydlowskiet al., 2003; Góeset al., 2004), and for Brazil as a whole (Whittleet al., 2004). However, there was only one paper (Callegari-Jacqueset al., 2003) reporting a spaciotemporal analysis to estimate the relative proportions of continental ancestral contributions to the Brazilian popu-lation. These authors studied 12 STR markers in 1,037 indi-viduals living in different regions of Brazil (North, Northeast, Midwest, Southeast and South). The relative
www.sbg.org.br
Send correspondence to Ândrea Kely C. Ribeiro-dos-Santos. Uni-versidade Federal do Pará, Centro de Ciências Biológicas, Depar-tamento de Patologia, Caixa Postal 8615, 66.075-970 Belém, Pará, Brazil. E-mail: [email protected] or [email protected].
proportions of ancestral contributions showed values be-tween 68%-71% of European, 12%-14% of African and 12%-17% of Amerindian ancestry in the Northern Region, values which are different from those estimated by Santos and Guerreiro (1995).
In the present study, genomic DNA markers (variable number of tandem repeats - VNTRs - and short tandem re-peats - STRs) were analyzed in a Brazilian population, with determination of heterozygosity, power of discrimination (PD), power of exclusion (PE) and polymorphism informa-tive content (PIC), and interethnic admixture estimations were made.
Material and Methods
The present study was conducted in the population of São Luís, capital of the State of Maranhão, in the Amazon Region of Northeastern Brazil. Peripheral blood (10 mL) was collected from 177 unrelated individuals born in that city, with Vacutainer tubes containing EDTA as anticoagu-lant. DNA was extracted by the phenol-chloroform method (Sambrooket al., 1989). The following DNA loci were ana-lyzed by PCR: i) STRs (vWA1, F13A1 and D12S67); ii) VNTRs (Apo-B and D1S80). PCR was carried out with a model PTC 100 apparatus (MJ Research). All reactions were performed in a total volume of 25µL, the solutions containing 100 ng of genomic DNA template. The PCR protocols used for the amplification of the five loci have been described elsewhere (Nakamura et al., 1988; Boerwinkleet al., 1989; Peakeet al., 1990; Hegeleet al., 1996; Polymeropouloset al., 1991; Thymannet al., 1993; Santos, 1999). The VNTRs and STRs were genotyped by polyacrylamide gel electrophoresis (PAGE), using silver nitrate stain.
Statistical analysis
Allele and genotype frequencies were assessed by gene counting, using the GENEPOP program, version 3.4 (Raymond and Rousset, 1995). The same software was used to calculate the observed and the expected number of homozygotes and heterozygotes. The allele frequencies for each locus were compared with those found in the popula-tion of Alagoas, another northeastern state of Brazil (Ferreira-da-Silva et al., 2002), and with the weighted means of previously observed European, Asian, African and Amerindian frequencies, using the CLUMP program (Sham and Curtis, 1995).
The genetic distances between the population of São Luís and the others that were compared were estimated by the method of Neiet al.(1983), using the DISPAN pro-gram.
Admixture estimates were calculated by the gene identity method (Chakraborty, 1985), using the ADMIX95 (Admixture Analysis for Hybrid Populations - www. genetica.fmed.edu.uy) program. Heterozygosity (H), PIC
(Polymorphism Informative Content), PE (Power of Exclu-sion) and PD (Power of Discrimination, capacity of geno-type differentiation at each locus) were calculated according to the methods described by Neiet al. (1983), Boldsteinet al. (1980), Chakraborty and Stivers (1996), and Guo and Elston (1999). Each locus was tested for the Hardy-Weinberg equilibrium using Fisher’s Exact Test as calculated by the Genetic Data Analysis (GDA) program (Lewis and Zavkin, 2001).
Results and Discussion
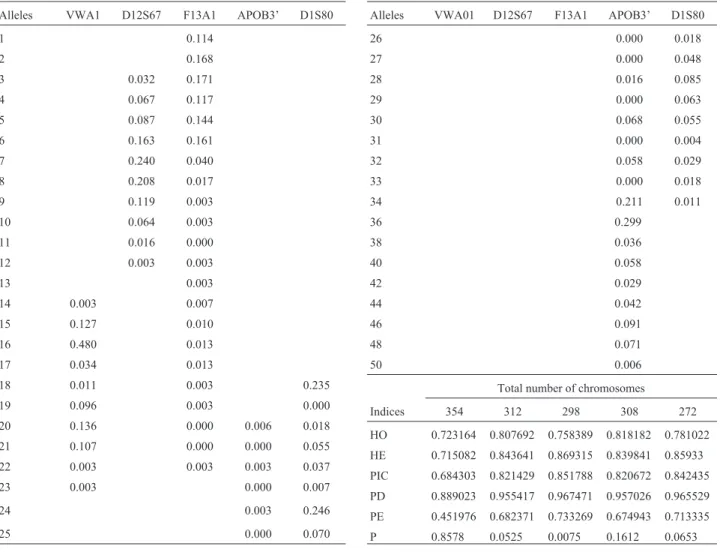
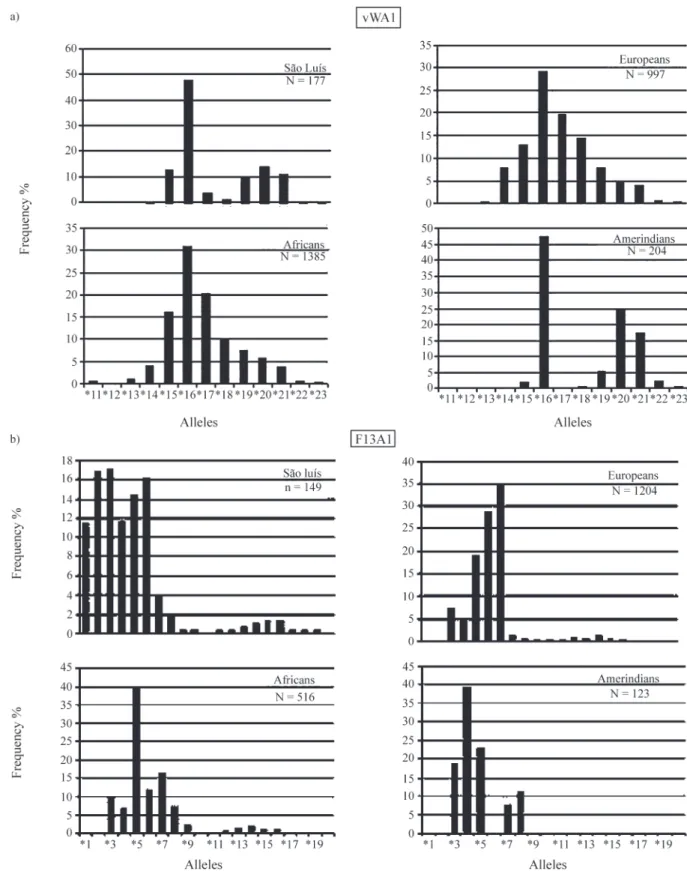
A total of 70 different alleles, an average of 14 alleles per locus, were identified in the 177 individuals. The allele frequencies at the five loci analyzed are given in Table 1 and Figure 1. To compare the present study with that from Alagoas, mention should be made that, in that investiga-tion, 598 individuals were tested and 85 different alleles were observed, an average of 9.4 alleles per locus (Ferreira-da-Silvaet al., 2002).
VWA1
Ten alleles were detected for the vWA1 locus in the São Luís population (Table 1), which showed a bimodal pattern of distribution, with frequency peaks for the vWA1*16 and vWA1*20 alleles (Figure 1a). In the Ala-goas population, only one modal peak, in vWA1*16, was observed.
We observed the presence of vWA1*14, an allele as yet not described in Brazil, which shows relevant frequen-cies among Portuguese (11.8%) and West-Africans (6.9%) (Gameroet al., 2003; Whittleet al., 2004). This allele was also observed by Rangel-Villaloboset al.(1999) in a Mexi-can population (Jalisco), at a frequency of 7.5%.
F13A1
Nineteen different alleles were found. The electro-phoretic migration pattern revealed the presence of three al-leles as yet not described in Brazilian populations, F13A1*18, F13A1*19 and F13A1*22 (Table 1).
F13A1*5 and F13A1*7 are the most frequent alleles in West-African populations (Gameroet al., 2003). In Por-tuguese populations, F13A1*7 and F13A1*6 are the most frequent (Gameroet al., 2003; Bell et al., 2000), while F13A1*3, and F13A1*6 and F13A1*4 are the most fre-quent alleles in Asian and Amerindian populations, respec-tively (Hammond et al., 1994; Robertson et al., 1995; Péres-Lezaun et al., 1997; Santos, 1999; Halos et al., 1999).
D12S67
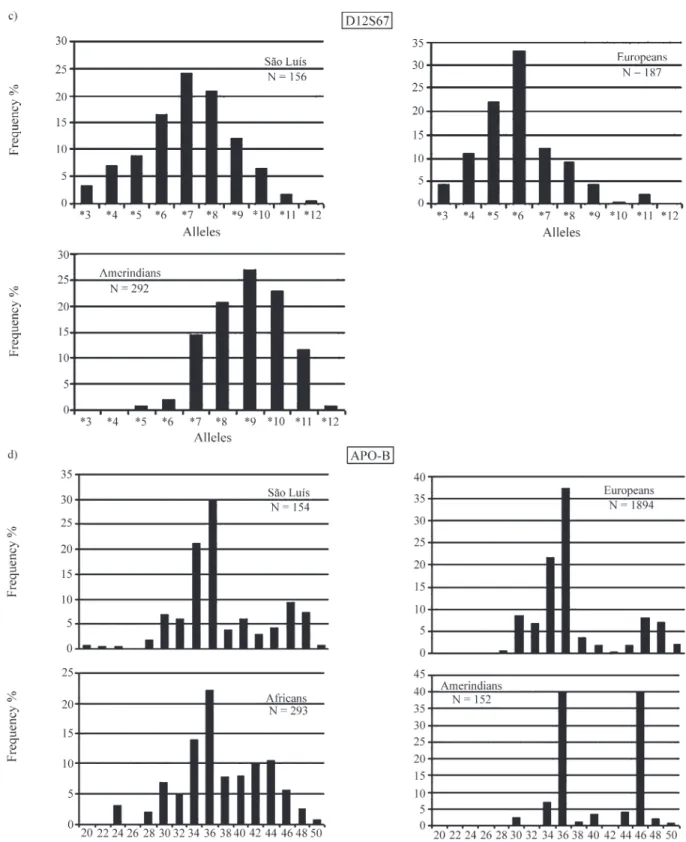
Ten alleles were identified at the D12S67 locus in the São Luís population (Table 1). The allele distribution showed a unimodal pattern, the highest frequency being ob-served for D12S67*7 (Figure 1c). These results disagree with those reported for a European sample, which showed 11 alleles and a bimodal distribution, with frequency peaks for D12S67*6 and D12S67*5 (Falcone et al., 1995). Studies conducted on Brazilian indigenous tribes from Maranhão, Awá-Guajá and Urubu-Kaapor, presented bi-modal distributions, with peaks for the D12S67*9 and D12S67*7 alleles, and for the D12S67*9 and D12S67*10 alleles, respectively (Santos, 1999).
The lack of similarity between the São Luís popula-tion and other populapopula-tions investigated previously may be related to the small number of studies using this marker, de-spite the fact that it represents one of the most polymorphic systems. Especially lacking are data from African
popula-tions, which significantly contributed to the formation of the population studied here.
Apo-B
Apo-B is one of the most widely studied VNTRs. In general, African and European populations show a unimodal distribution for the Apo-B*36 allele (Ludwiget al., 1989; D’Alojaet al., 1992; Hixonet al., 1993; Latorra et al., 1994; Pinheiroet al., 1996; Mavigliaet al., 2001), while in Asian populations the most frequent allele is Apo-B*34 (Dekaet al., 1992; Rengeset al., 1992; Evanset al., 1993). Amerindian populations show two frequency peaks, one for the allele Apo-B*36 and one for Apo-B*46 (Zagoet al., 1996; Vallinoto, 1996).
The São Luís population showed 15 alleles at this lo-cus. These alleles and their frequencies are shown in Table 1. The allele distribution presented a bimodal pattern with peaks for the alleles Apo-B*36, Apo-B*34 and Apo-B*46, with Apo-B*36 being the most frequent (Figure 1d). The São Luís frequencies (Apo-B*34, 21%; Apo-B*36, 30%)
Table 1- Allele frequencies and variability measures at the five loci analyzed in the São Luís population.
Alleles VWA1 D12S67 F13A1 APOB3’ D1S80
1 0.114
2 0.168
3 0.032 0.171
4 0.067 0.117
5 0.087 0.144
6 0.163 0.161
7 0.240 0.040
8 0.208 0.017
9 0.119 0.003
10 0.064 0.003
11 0.016 0.000
12 0.003 0.003
13 0.003
14 0.003 0.007
15 0.127 0.010
16 0.480 0.013
17 0.034 0.013
18 0.011 0.003 0.235
19 0.096 0.003 0.000
20 0.136 0.000 0.006 0.018 21 0.107 0.000 0.000 0.055 22 0.003 0.003 0.003 0.037
23 0.003 0.000 0.007
24 0.003 0.246
25 0.000 0.070
Alleles VWA01 D12S67 F13A1 APOB3’ D1S80
26 0.000 0.018
27 0.000 0.048
28 0.016 0.085
29 0.000 0.063
30 0.068 0.055
31 0.000 0.004
32 0.058 0.029
33 0.000 0.018
34 0.211 0.011
36 0.299
38 0.036
40 0.058
42 0.029
44 0.042
46 0.091
48 0.071
50 0.006
Total number of chromosomes
Indices 354 312 298 308 272 HO 0.723164 0.807692 0.758389 0.818182 0.781022 HE 0.715082 0.843641 0.869315 0.839841 0.85933 PIC 0.684303 0.821429 0.851788 0.820672 0.842435 PD 0.889023 0.955417 0.967471 0.957026 0.965529 PE 0.451976 0.682371 0.733269 0.674943 0.713335 P 0.8578 0.0525 0.0075 0.1612 0.0653
are very similar to those of African (Apo-B*36, 22.1%; Apo-B*34, 13.8%) and European (Apo-B*36, 37.9%; Apo-B*34, 21.2%) populations.
Although the Apo-B locus showed variable allele fre-quencies among different human populations, homogene-ity was observed for the most frequent alleles, suggesting
that the polymorphism at this locus preceded the geo-graphic dispersal of the main ancestral population groups (Dekaet al., 1992).
D1S80
The pattern of allele distribution at this locus is gener-ally polymodal in African populations, with frequency
peaks for D1S80*18, D1S80*21, D1S80*24, D1S80*28 and D1S80*34. Together, these alleles account for approxi-mately 70% of the alleles observed there (Vallinoto, 1996; Heidrich et al., 1995). Among European populations, D1S80*18 and D1S80*24 are the most frequent (Falconeet al., 1995; Floreset al., 2001). Amerindians show a trimodal pattern, with peaks for D1S80*18, D1S80*24 and D1S80*30 (Budowle et al., 1991; 1995; Latorra et al., 1994; Zagoet al., 1996).
In the São Luís population, 16 alleles were identified at the D1S80 locus (Table 1), showing a trimodal pattern of dis-tribution with peaks for D1S80*18, D1S80*24 and D1S80*28, the most frequent being D1S80*24 (Figure 1e). The greatest similarity was observed with Asian populations.
Genetic distances
The allele frequencies obtained in the present study were used to generate a genetic distance matrix (Table 2) that revealed a great similarity between the populations of São Luís and Belém. This finding was expected, since both populations live in the same geographic region (Amazon) and therefore share similar social, interethnic and demo-graphic processes.
Genotype distribution
The 10 alleles detected at the vWA1 locus allowed the identification of 22 different genotypes. The most fre-quent were 6-6 (22.6%), 6-10 (12.4%), 5-6 (11.9%), 6-11
(10.2%) and 6-9 (9.6%), corresponding to 67% of the sample. The F13A1 locus showed 19 alleles, with 49 geno-types, the most frequent being 2-5 (8.1%), 3-6 (7.4%), 2-4 (6.0%), 3-3 (6.0%) and 6-6 (5.5%), which accounted for 33% of all individuals in the sample. At the D12S67 locus, 10 alleles were identified, in a total of 33 genotypes, the most frequent being 7-8 (11.5%), 6-7 (9.0%), 8-9 (6.4%), 7-7 (5.8%) and 6-8 (5.1%), corresponding to 38% of all in-dividuals analyzed. The combination of 49 genotypes for Apo-B was obtained based on 15 alleles, the most frequent being 34-36 (11.7%), 36-36 (9.7%), 36-40 (5.8%) and 36-46 (5.8%), corresponding to 33% of all individuals ana-lyzed. Sixteen alleles were identified at the D1S80 locus, which corresponded to a total of 56 genotypes, the most fre-quent being 18-24 (10.9%), 24-24 (8.0%), 24-28 (4.4%) and 18-29 (4.4%), representing 35% of the individuals ana-lyzed.
Figure 1 (cont.)- Allele frequencies in the São Luís population and in the main ethnic groups that contributed to its formation.
Table 2- Genetic distance matrix calculated according to Neiet al.
(1983). based on the allele frequencies for the vWA1. F13A1. Apo-B and D1S80 loci.
Populations São Luís Belém Europeans Asians Africans Belém 0.0992
Europeans 0.1214 0.1237
Asians 0.1760 0.2129 0.0814
Africans 0.1263 0.1205 0.0743 0.1351
STRs
and
VNTRs
in
the
São
Luís
population
Table 3- Gene frequencies in the parental populations used to estimate the ethnic admixture in the São Luís population.
Populations and systems
Observed Alleles
vWA1 #-13 *14 *15 *16 *17 *18 *19 *20 *21 *22 *23
São Luís 0.0000 0.0030 0.1270 0.4800 0.0350 0.0110 0.0960 0.1350 0.1070 0.0030 0.0030
European 0.0014 0.1221 0.1148 0.2224 0.2762 0.1817 0.0669 0.0102 0.0043 0.0000 0.0000 Amerindian 0.0000 0.0000 0.0190 0.4700 0.0000 0.0050 0.0530 0.2500 0.1730 0.0250 0.0050
African 0.0300 0.0450 0.1600 0.3100 0.1950 0.0920 0.0700 0.0600 0.0320 0.0050 0.0010
F13A *1 *2 *3 *4 *5 *6 *7 *8 *9 *10 *11 *12 *13 *14 *15 *16 *17 *18 *19 *22
São Luís 0.1150 0.1700 0.1710 0.1200 0.1450 0.1610 0.0400 0.0210 0.0030 0.0030 0.0000 0.0030 0.0030 0.0100 0.0100 0.0130 0.0030 0.0030 0.0030 0.0030
European 0.0000 0.0000 0.0843 0.0291 0.1817 0.3052 0.3575 0.0116 0.0000 0.0000 0.0000 0.0000 0.0000 0.0102 0.0000 0.0160 0.0044 0.0000 0.0000 0.0000
Amerindian 0.0000 0.0000 0.1880 0.3920 0.2300 0.0000 0.0790 0.1110 0.0000 0.0000 0.0000 0.0000 0.0000 0.0000 0.0000 0.0000 0.0000 0.0000 0.0000 0.0000 African 0.0000 0.0000 0.0980 0.0670 0.3940 0.1200 0.1640 0.0710 0.0230 0.0020 0.0020 0.0060 0.0140 0.0170 0.0100 0.0120 0.0000 0.0000 0.0000 0.0000
ApoB *22 *24 *26 *28 *29 *30 *31 *32 *33 *34 *35 *36 *37 *38 *40 *42 *44 *46 *47 *48 *50 *52 *54 *56 *58
São Luís 0.0100 0.0030 0.0030 0.0170 0.0000 0.0700 0.0000 0.0600 0.0000 0.2010 0.0000 0.2900 0.0000 0.0410 0.0610 0.0300 0.0420 0.0910 0.0000 0.0710 0.0100 0.0000 0.0000 0.0000 0.0000 European 0.0000 0.0000 0.0000 0.0030 0.0000 0.0800 0.0000 0.0650 0.0000 0.2300 0.0000 0.3800 0.0000 0.0400 0.0240 0.0020 0.0100 0.0700 0.0000 0.0750 0.0210 0.0000 0.0000 0.0000 0.0000
Amerindian 0.0000 0.0000 0.0000 0.0000 0.0000 0.0229 0.0000 0.0000 0.0000 0.0664 0.0000 0.4036 0.0000 0.0098 0.0328 0.0000 0.0398 0.4017 0.0000 0.0165 0.0065 0.0000 0.0000 0.0000 0.0000 African 0.0000 0.0310 0.0000 0.0180 0.0006 0.0680 0.0001 0.0490 0.0001 0.1474 0.0000 0.2314 0.0000 0.0770 0.0790 0.1010 0.1060 0.0560 0.0150 0.0200 0.0000 0.0001 0.0000 0.0000 0.0001
D1S80 #-17 *18 *20 *21 *22 *23 *24 *25 *26 *27 *28 *29 *30 *31 *32 *33 *34 *35 *36 *37 *38 *39 *40 *41
São Luís 0.0000 0.2400 0.0180 0.0550 0.0360 0.0070 0.2410 0.0730 0.0200 0.0500 0.0840 0.0620 0.0550 0.0040 0.0300 0.0140 0.0110 0.0000 0.0000 0.0000 0.0000 0.0000 0.0000 0.0000 European 0.0110 0.2210 0.0230 0.0400 0.0380 0.0130 0.3400 0.0450 0.0200 0.0100 0.0570 0.0660 0.0090 0.0600 0.0080 0.0050 0.0050 0.0010 0.0140 0.0120 0.0000 0.0000 0.0010 0.0010
Amerindian 0.0000 0.3920 0.0000 0.0003 0.0000 0.0250 0.0970 0.1000 0.0010 0.0000 0.0360 0.0150 0.3000 0.0330 0.0000 0.0007 0.0000 0.0000 0.0000 0.0000 0.0000 0.0000 0.0000 0.0000
African 0.0330 0.0860 0.0180 0.1360 0.0730 0.0280 0.2520 0.0450 0.0080 0.0210 0.1000 0.0220 0.0200 0.0430 0.0100 0.0070 0.0940 0.0020 0.0000 0.0000 0.0000 0.0020 0.0000 0.0000
#- the vWA1*13 and D1S80*17 less frequent alleles have been collapsed for this analysis.
[Alonsoet al.(1993); Bellet al.(2000); Boerwinkleet al.(1989); Budowleet al.(1995); Buresiet al.(1995); Chakrabortyet al.(1991); D’Alojaet al.(1992); Dekaet al.(1992; 1994); Destro-Bisolet al.(1994; 2000); Evanset al.(1993); Falconeet al.(1995); Floreset al.(2001); Gameroet al.(2000; 2003); Genéet al.(1993; 1995); Gusmãoet al.(1997; 2001); Gutowskiet al.(1995); Haloset al.(1999); Hammondet al.
(1994); Heidrichet al.(1995); Hixonet al.(1993); Latorraet al.(1994); Mavigliaet al.(2001); Peakeet al.(1990); Penaet al.(1994); Péres-Lezaunet al.(1997); Pinheiroet al.(1996); Rangel-Villaloboset al.
A total of 70 alleles, and 209 of the 556 expected ge-notype combinations, were identified.
Variability measures
Heterozygosity values are shown in Table 1. The F13A1 frequencies were not in Hardy-Weinberg equilib-rium (p = 0.0075), due to an excess of homozygotes. Since the number of alleles was high (19) and the number of indi-viduals studied relatively small (171), this result is proba-bly due to sampling.
The highest heterozygosity value (81.8%) was ob-served for Apo-B, and the lowest (72.3%) for the vWA1 lo-cus. The average heterozygosity for the analyzed markers was 77.7%, with a mean number of 14 alleles per locus. These values are higher than those obtained for another northeastern population (Alagoas), which showed an aver-age heterozygosity of 75.4% and a mean number of alleles of 9.4. High heterozygosity is expected in miscegenated populations (Byardet al., 1985), and this was confirmed by the present study.
PD is defined as the capacity of genotype differentia-tion at each locus. The PD observed for the São Luís popu-lation ranged from 88.9% for vWA1 to 96.7% for F13A1. The median power of exclusion (PE) ranged from 45.2% for vWA1 and 73.3% for F13A1. The combined PE for these five loci was 99.8%.
Paternity and forensic applications require markers with high average heterozygosity, cumulative PE and cu-mulative PIC values. Therefore, the five DNA markers ana-lyzed in the present study can be safely employed for these purposes.
Interethnic admixture
Estimates of interethnic admixture were based on four loci, due to lack of previous studies on D12S67 in African populations. The comparisons made are displayed in Table 3. The results indicated a high contribution of European genes (42% ± 1%), followed by Amerindian (39% ± 7%), and a low contribution of African genes (19% ± 7%). These results are similar to those obtained for the average of the Brazilian Amazon Region (47% Caucasian, 41% Amerin-dian, and 12% African) by Santos and Guerreiro (1995). The values reported by Callegari-Jacqueset al.(2003) are differ-ent (as detailed in a previous section), which could be due to the fact that they studied a different Amazonian population (Manaus) or to the fact that the bulk of their samples was composed of individuals who could pay for paternity deter-minations. The difference, therefore, could reflect the marked socio-economic differentials that exist among peo-ple of different ethnies in Brazil.
Acknowledgements
We thank the subjects of this investigation. This study was supported by PRONEX (Programa de Apoio a Núcleos de Excelência), CNPq (Conselho Nacional de
Desenvol-vimento Científico e Tecnológico), FUNTEC (Secretaria Executiva de Ciência, Tecnologia e Meio Ambiente/Fundo Estadual de Ciência e Tecnologia) and UFPA (Univer-sidade Federal do Pará).
References
Alonso A, Martin P, Albarran C and Sancho M (1993) Amplified fragment length polymorphism analysis of the VNTR locus D1S80 in central Spain. Int J Legal Med 105:311-314. Bell B, Nievas P, Abecia E, Martínez-Jarreta B, Hinojal R and
Martínez-Cordero A (2000) Population genetics of the STR loci HUMCSF1PO, HUMF13A01, HUMFES/FPS and D12S391 in Asturias (northern Spain). Forens Sci Int 113:21-23.
Boerwinkle E, Xiong W, Fourest E and Chan L (1989) Rapid typ-ing, of tandemly repeated hypervariable loci by the polymer-ase chain reaction: Application to the apolipoprotein B 3’ hypervariable region. Proc Natl Acad Sci USA 86:212-216. Boldstein D, White RL, Skolnich M and Davis RW (1980)
Con-struction of a genetic linkage map in man using restriction fragment length polymorphisms. Am J Hum Genet 32:314-331.
Budowle B, Bacchtel S, Smerick JB, Presley KW, Giusti AM, Parsons G, Alevy MC and Chakraborty R (1995) D1S80 population data in African Americans, Caucasians, South-eastern, Hispanics, Southwestern Hispanic, and Orientals. J Forens Sci 40:38-44.
Budowle B, Chakaborty R, Giusti AM, Eisenberg AJ and Allens RC (1991) Analysis of the VNTR locus D1S80 by PCR fol-lowed high resolution PAGE. Am J Hum Genet 48:137-144. Buresi C, Desmarais E, Vigneron S, Rayana CB, Chaabouni H
and Roizes G (1995) Polymorphism at VNTR locus 3’ to apolipoprotein B gene in a Tunisian population: Difference from other ethnic groups. Genet Epidemiol 12:381-389. Byard PJ, Schanfield MS and Crawford MH (1985) Admixture
and heterozygosity in West Alaskan populations. J Biosoc Sci 15:207-216.
Bydlowski SP, De Moura-Neto RS, Soares RP, Silva R, Debes-Bravo AA and Morgante L (2003) Genetic data on 12 STR’s (F13A1, F13B, FESFPS, LPL, CSF1PO, TPOX, TH01, vWA, D16S539, D7S820, D13S317, D5S818) from four ethnic groups of São Paulo, Brazil. Forens Sci Int 135:67-71. Callegari-Jacques SM, Grattapaglia D, Salzano FM, Salamoni SP, Crossetti SG, Ferreira ME and Hutz MH (2003) Historical genetics: Spatiotemporal analysis of the formation of the Brazilian population. Am J Human Biol 15:824-834. Chakraborty R (1985) Gene identity in racial hybrids and
estima-tion of admixture rates. In: AhujaYR and Neel JV (eds) Ge-netic Differentiation in Human and Other Animal Populations. Indian Anthropological Association, Delhi, pp 171-180.
Chakraborty R, Fornage R, Gueguen R and Boerwinkle E (1991) Population genetics of hypervariable loci analysis of PCR based VNTR polymorphism within a population. In: Burke T, Dolf G, Jeffreys AJ and Wolff R (eds) DNA
Finger-printing approaches and Applications. Switzerland
Birkhäuser Verlag, Switzerland, pp 127-143.
D’Aloja E, Dobosz M, Pescarmona A, Moscetti A and Pascali VL (1992) Gene frequencies of APO B alleles in a sample of random Italian individuals (Central and Southern Italy). Adv For Haemogenet 4:67-69.
Deka R, Chakraborty R, Decroo S, Rothhammer F, Barton SA and Ferrell RE (1992) Characteristics of polymorphism at a VNTR locus 3’ to the Apolipoprotein B gene in five human populations. Am J Hum Genet 51:1325-1333.
Deka R, Decroo S, Jin L, Mcgarvey ST, Rothhammer F, Ferreli RE and Chakraborty R (1994) Populations genetic charac-teristics of the D1S80 locus in seven human populations. Hum Genet 94:252-258.
Destro-Bisol G, Boschi I, Caglià A, Tofanelli S, Pascali V, Paoli G and Spendini G (2000) Microsatellite variation in Central Africa: An analysis of intrapopulational and inter-populational genetic diversity. Am J Phys Anthropol 112:319-337.
Destro-Bisol G, Presciuttini S, D’Aloja E, Dobosz M, Spendini G and Pascali VL (1994) Genetic variation at the Apo B 3’ HVR, D2S44, and D7S21 loci in the Ewondo ethnic group of Cameroon. Am J Hum Genet 55:168-174.
Evans AE, Zhang W, Moreel JFR, Bard JM, Ricard S, Poirier O, Tiret L, Fruchart JC and Cambien F (1993) Polymorphisms of the apolipoprotein B and E genes and their relationship to plasma lipid variables in healthy Chinese men. Hum Genet 92:191-197.
Falcone E, Spadafora P, De Luca M, Ruffolo R, Brancati C and De Benedicts G (1995) DYS19 and D1S80 polymorphisms in population samples from southern Italy and Greece. Hum Biol 67:689-701.
Ferreira-da-Silva LA, Pimentel BJ, Azevedo DA, Silva ENP and Santos SS (2202) Allele Frequencies of Nine STR loci -D16S539, D7S820, D13S317, CSF1PO, TPOX, TH01, F13A01, FESFPS and vWA - in the Population of Alagoas, Northeast Brazil. Forens Sci Int 130:187-188.
Flores I, Frias I, Prieto V, Andrés I and Sanz P (2001) Population data for southern Spain and Canary Islands of HLADQA1, PM and D1S80 loci. Forens Sci Int 119:116-118.
Gamero JJ, Romero JL, Gonzalez JL, Anjos MJ, Corte-Real F and Vide MC (2003) A study of four short repeat systems: Afri-can immigrant, Portuguese and Spanish population data. Int Congr Ser 1239:159-162.
Gamero JJ, Romero JL, Gonzalez JL, Arufe MI, Cuesta MI, Corte-Real F, Carvalho M, Anjos MJ, Vieira DN and Vide MC (2000) A study on ten short tandem repeat systems: Af-rican immigrant and Spanish population data. Forens Sci Int 110:167-177.
Gené M, Huguet E, Sánchez-Garcia C, Moreno P, Corbella J and Mezquita J (1995) Study of 3’ ApoB minisatellite performed by PCR in the population of Catalonia (North Spain). Hum Hered 45:70-74.
Gené M, Moreno P, Huguet E, Corbella J and Mezquita J (1993) D1S80 polymorphism, including a new variant, in a popula-tion sample from Barcelona (Spain) using polymerase chain reaction. Am J Human Biol 5:691-695.
Góes ACS, Silva DA, Gil EHF, Silva MTD, Pereira RW and Carvalho EF (2004) Allele frequencies data and statistic pa-rameters for 16 STR’s - D19S433, D2S1338, CSF1PO, D16S539, D7S820, D21S11, D18S51, D13S317, D5S818, FGA, Penta E, TH01, vWA, D8S1179, TPOX, D3S1358 - in
the Rio de Janeiro population, Brazil. Forensic Sci Int 140:131-132.
Guo X and Elston RC (1999) Linkage information content of polymorphic genetic markers. Hum Hered 49:112-118. Gusmão L, Prata MJ, Amorim A, Silva F and Bessa I (1997)
Char-acterization of four short tandem repeat loci (THO1, VWA31/A, CD4, and TP53) in northern Portugal. Hum Biol 69:31-40.
Gusmão L, Prata MJ, Miranda C, Trovoada MJ and Amorim A (2001) STR data from S. Tomé and Príncipe (Gulf of Guinea, West Africa). Forens Sci Int 116:53-54.
Gutowski S, Budowle B, Auer J and Oorschot RV (1995) Statisti-cal analysis of Australian population for the loci Gc, HLA-DQA1, D1S80 and HUMTH01. Forens Sci Int 76:1-6. Halos SC, Chu JY, Ferreon ACM and Magno MMF (1999)
Philip-pine population database at nine microsatellite loci for fo-rensic and paternity applications. Forens Sci Int 101:27-32. Hammond HA, Jin L, Zhong Y, Caskey CT and Chakraborty R (1994) Evaluation of 13 Short Tandem Repeat loci for use in personal identification applications. Am J Hum Genet 55:175-189.
Hegele RA, Huang LS, Herbert PN, Blum CB, Burning JF, Hennekens CH and Breslow JL (1996) Apolipoprotein B gene DNA polymorphisms associated with myocardial in-farction. N Engl J Med 315:1509-1515.
Heidrich EM, Hutz MH, Salzano FM, Coimbra Jr CE and Santos RV (1995) D1S80 locus variability in three Brazilian ethnic groups. Hum Biol 67:311-319.
Hixon JE, Powers PK and Mcmaham CA (1993) The human apolipoprotein B 3’ hypervariable region: Detection of eight new alleles and comparisons of allele frequencies in blacks and whites. Hum Genet 91:475-479.
Latorra D, Stern CM and Schanfield MS (1994) Characterization of human AFLP systems apolipoprotein B, phenylalanine, hydroxylase, and D1S80. PCR Meth Appl 3:351-358. Lewis PO and Zavkin D (2001) Genetic data analysis: Computer
program for the analysis of allelic data, version 1.0 (d16c). Free program distribution by the authors over the internet from http://lewis.eeb.uconn.edu/lewishome/software.html. Ludwig EH, Friedl W and MCCarthy BJ (1989) High resolution
analysis of a hypervariable region in the human apolipoprotein B gene. Am J Hum Genet 45:458-464. Maviglia R, Dobosz M, Boschi I, Calià A, Hall D, Capelli C,
d’Aloja E, Pescarmona M, Moscetti A, Pascali VL and Destro-Bisol G (2001) A repository of 14 PCR-loci Italian gene frequencies in the world wide web. Forens Sci Int 115:99-101.
Meireles M (1994) Dez Estudos Históricos. Companhia Editora Alumar, São Luís, 43 pp.
Moraes J (1987) História da Companhia de Jesus na Extinta Província do Maranhão e Pará. Companhia Editora Alham-dra, Rio de Janeiro, 183 pp.
Mota AS and Mantovani JD (1998) São Luís do Maranhão no Século XVIII: A Construção do Espaço Urbano sob a Lei das Sesmarias. Companhia Editora FUNC, São Luís, 104 pp.
Nei M, Tajima R and Tateno Y (1983) Accuracy of estimated phylogenetic trees from molecular data. J Mol Evol 19:153-170.
Peake IR, Bowen D, Bignell P, Liddell MB, Sadler JE, Standen G and Bloom AL (1990) Family studies and prenatal diagnosis in severe von Willebrand disease by polymerase chain reac-tion amplificareac-tion of a variable number Tandem repeat re-gion of the von Willebrand factor gene. Blood 76:555-561. Pena SDJ, Souza KT, Andrade M and Chakraborty R (1994)
Allelic associations of two polymorphic microsatellites in intron 40 of the human von Willebrand factor gene. Proc Natl Acad Sci USA 91:723-727.
Péres-Lezaun A, Calafell F, Mateu E, Comas D, Bosch E and Bertranpetit J (1997) Allele frequencies for 20 micro-satellites in a worldwide population survey. Hum Hered 47:189-196.
Pinheiro MF, Pontes ML, Gené M, Huguet E, Pinto da Costa J and Moreno P (1996) Study of three AmpFLPs (D1S80, 3’ApoB and YNZ22) in the population of the North of Portugal. Forens Sci Int 79:23-29.
Polymeropoulos MH, Rath DS, Xiao H and Merril CR (1991) Tetranucleotide repeat polymorphism at the human coagula-tion factor XIIIA subunit gene (F13A1). Nucl Aci Res 19:4306.
Rangel-Villalobos H, Rivas F, Torre-Rodríguez M, Jaloma-Cruz AR, Gallegos-Arreola MP, López-Satow J, Cantú JM and Figuera LE (1999) Allele frequency distributions of six Amp-FLPS (D1S80, Apo-B, vWA1, CSF1PO and HPRTB) in a Mexican population. Forens Sci Int 105:125-129. Raymond M and Roussett F (1995) Population genetics for exact
tests and ecumenicism. J Hered 86:248-249.
Renges HH, Peacock R, Dunning AM, Talmud P and Humphries SE (1992) Genetic relationship between the 3’ VNTR and diallelic apolipoprotein B gene polymorphisms: Haplotype analysis in individuals of European and South Asian origin. Ann Hum Genet 56:11-33.
Robertson JM, Sgueglia JB, Badger CA, Juston AV and Ballantyne J (1995) Forensic applications of a rapid, sensi-tive, and precise multiplex analysis of the four short tandem repeat loci HUMVWF13/A1, HUMTH01, HUMF13A1 and HUMFES/FPS. Electrophoresis 16:1568-1576.
Sala A, Penacino G and Corach D (1998) Comparison of allele frequencies of eight STR loci from Argentinean Amerindian and European populations. Hum Biol 70:937-947.
Sambrook J, Fritsch EF and Maniatis T (1989) Molecular Clon-ing: A Laboratory Manual. Cold Spring Harbor, New York, 1.626 pp.
Santos EJM (1999) Os últimos 5000 anos de história ameríndia na Amazônia: Recente expansão, migração e deriva genética. PhD Thesis, Universidade Federal do Pará, Belém. Santos MV, Anjos MJ, Andrade L, Vide MC, Corte-Real MF and
Vieira DM (2004) Population genetic data for the STR loci using the AMPF1STR identifiler kit in Bahia. Int Congr Ser 1261:219-222.
Santos SEB and Guerreiro JF (1995) The indigenous contribu-tions to the formation of the population of the Brazilian Am-azon region. Braz J Genet 18:301-315.
Schnee-Griese J, Herrmann S, Schneider HR, Förster R, Bäbler G and Pflug W (1993) Frequency distribuition of D1S80 al-leles in the German population. Forens Sci Int 59:131-136. Sham PC and Curtis D (1995) Monte Carlo tests for associations
between disease and alleles at highly polymorphic loci. Ann Hum Genet 59:97-105.
Tavares AL (1979) Brasil e França ao Longo de 5 Séculos. Coleção General Benício, Rio de Janeiro, 89 pp.
Thymann M, Nellemann LJ, Masumba G, Irgens-Moller L and Morling N (1993) Analysis of the locus D1S80 by amplified fragment length polymorphism technique (AMP-FLP). Fre-quency distribution in Danes. Intra and Inter laboratory reproducibility of the technique. Forens Sci Int 60:47-56. Trabetti E, Galavotti R and Pignatti P (1992) Genetic variation in
the Italian population at five tandem repeat loci amplifiedin vitro: Use in paternity testing. Mol Cell Prob 65:81-87. Vallinoto AC (1996) Estudo da variabilidade genética de cinco
populações indígenas da Amazônia, através da análise de quatro loci hipervariáveis. Master Thesis, Universidade Fe-deral do Pará and Museu Paraense Emílio Goeldi, Belém. Whittle MR, Romano NL and Negreiros VAC (2004) Updated
Brazilian genetic data, together with mutation rates, on 19 STR loci, including D10S1237. Forens Sci Int 139:207-210. Zago MA, Silva WA, Tavella MH, Santos SEB, Guerreiro JF and
Figueiredo MS (1996) Interpopulational and intra-populatinal genetic diversity of Amerindians as revealed by six variable number of Tandem repeats. Hum Hered 46:274-289.