Heterologous microsatellite primer pairs informative for the whole genus
Arachis
Andrea Akemi Hoshino
1, Juliana Pereira Bravo
1, Carla M.L.C.D. Angelici
1, Andréa V. Gobbi Barbosa
1,
Catalina Romero Lopes
1and Marcos A. Gimenes
1,21
Laboratório de Biotecnologia e Genética Molecular, Departamento de Genética,
Instituto de Biociências, UNESP - Universidade Estadual Paulista, Botucatu, SP, Brazil.
2
Centro de Pesquisa e Desenvolvimento de Recursos Genéticos e Vegetais,
Instituto Agronômico de Campinas, Campinas, SP, Brazil.
Abstract
The genusArachis currently comprises 69 described species, some of which have potential and real value as human and animal foods. TheseArachis species have been collected and maintained in germplasm banks to provide mate-rial that can be used as sources of genes in breeding programs and for the selection of new cultivars. One of the prin-cipal objectives of germplasm conservation is the evaluation of genetic variability, which is best conducted using molecular markers. We investigated the use of heterologous primers to amplify microsatellite loci that could be used to evaluate genetic variability inArachis germplasm. Fifteen microsatellite primer pairs were tested in 76 accessions of 34 species from the nineArachis sections. The data indicated that heterologous primers were very useful in Arachis since they had high transferability among the species (91%) and allowed the amplification of very polymor-phic putative loci, which allowed both the characterization of most accessions and to make inferences about the mat-ing systems of some species analyzed. Our data also revealed that the germplasm analyzed showed high variability, even when represented by few accessions.
Key words:peanut, genetic relationship, molecular markers, wild relatives.
Received: October 25, 2005; Accepted: March 9, 2006.
Introduction
The genusArachisis comprised of 69 described and some undescribed species, all of which are native to Latin America. This genus is divided into nine sections (Arachis,
Erectoides, Heteranthae, Caulorrhizae, Rhizomatosae,
Extranervosae, Triseminatae, Procumbentes and
Trierectoides) based on morphology and cross-incompati-bility (Krapovickas and Gregory, 1994). The genus con-tains several species of economic value, including the culti-vated peanut A. hypogaea (section Arachis), A. pintoi
(section Caulorrhizae) and A. glabrata (section
Rhizomatosae), which have been used for forage produc-tion (Otero, 1952, Valls and Simpson, 1994, Gimeneset al., 2000). Other species with high agronomic potential, mainly for forage production, are also found in the other sections of the genus (Conagin, 1962).
Accessions of all species of the genusArachishave been collected and maintained in germplasm banks but the
appropriate conservation of this material depends on the characterization and evaluation of its genetic variability. Appropriate evaluation contributes to many steps of the germplasm conservation process, including the identifica-tion of geographical locaidentifica-tions showing high germplasm variability that could be chosen as priority locations for conservation. Information concerning variability can also help to improve the management and evaluation of the mul-tiplication processes used for maintainingArachis germ-plasm and thus prevent genetic losses. Furthermore, knowledge of genetic variation in a species can provide in-sights into the type of mating system operating in the spe-cies, this being particularly important in the genusArachis
because in most species the type of mating system is un-known because most studies have been focused on species of theArachissection (Kochertet al., 1996, Hopkinset al., 1999, He and Prakash, 2001, Gimeneset al., 2002a, Fergu-sonet al., 2004), which includesA. hypogaeaand most of related species.
Molecular methods such as amplified fragment length polymorphism (AFLP) and random amplified poly-morphism DNA (RAPD) have been used to evaluate
germ-Genetics and Molecular Biology, 29, 4, 665-675 (2006) Copyright by the Brazilian Society of Genetics. Printed in Brazil www.sbg.org.br
Send correspondence to Andrea Akemi Hoshino. Laboratório de Biotecnologia e Genética Molecular, Departamento de Genética, Instituto de Biociências, UNESP, Distrito de Rubião Jr., 18618-000 Botucatu, SP, Brazil. Email: akemi@ibb.unesp.br.
plasm bank accessions (He and Prakash, 1997, Gimeneset al., 2000, Dwivediet al., 2001). Data obtained with such markers has permitted the characterization and quantifica-tion of the genetic variability of germplasm but since these markers are dominant only one allele per locus can be de-tected, leading to an underestimation of the genetic vari-ability. Furthermore, results from such markers are difficult to interpret when compared with data obtained by other re-searchers. These types of markers have problems regarding repeatability and can result in the detection of many loci in a single assay, making it more difficult to assign alleles to their loci (Powellet al., 1996). The integration of data from different studies is crucial to the genusArachisbecause the number of accessions and described species has increased greatly in the last few years. The disadvantages of RAPD and AFLP markers have been circumvented by the devel-opment of simple sequence repeat (SSR or microsatellite) markers because such markers are detected by long primers which have increased specificity and, consequently, repeat-ability, allowing the evaluation of individual loci. Another advantage of microsatellite markers is that they are co-dominant and can therefore detect heterozygosity (Yu et al., 1999). Furthermore, microsatellite markers have also
shown to be more polymorphic than other molecular mark-ers (Ciprianiet al., 1999, López-Seséet al., 2002) and can be analyzed using primers developed for related species (Plieske and Struss, 2001, Shepherdet al., 2002),i.e. hete-rologous primers can be used.
The objective of the study described in this paper was to evaluate the use of heterologous SSR primers to the char-acterization of the genetic variability in germplasm of some species of the genusArachis, to contribute to the germ-plasm knowledge and utilization ofArachisgenus species.
Material and Methods
Material
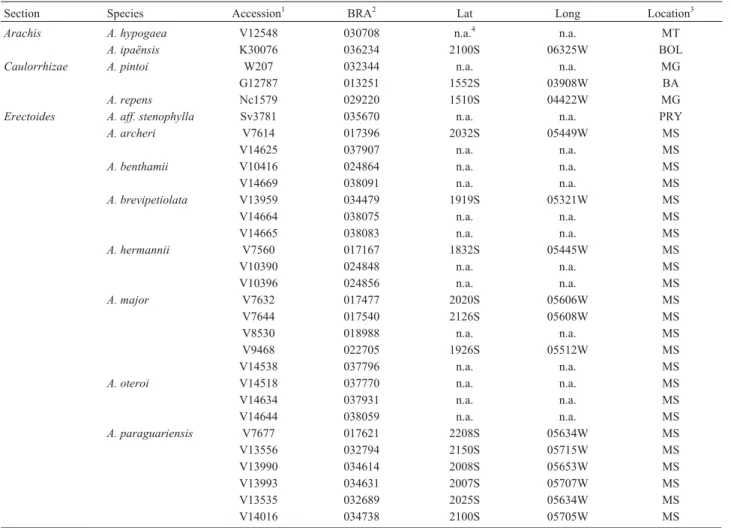
We investigated 76 accessions of 34 species from the nine sections of the genusArachis(Table 1). These acces-sions were obtained from Dr. José F. M. Valls, curator of the Peanut Germplasm Bank of the Genetics and Biotech-nology unit of the Brazilian agricultural company Embrapa (Empresa Brasileira de Pesquisa Agropecuária - Recursos Genéticos e Biotecnologia, Brasília, DF, Brazil). The loci were validated using an F2population (n = 93 plants)
result-Table 1- Accessions of 34 species from the nineArachissections that were investigated in this study.
Section Species Accession1 BRA2 Lat Long Location3
Arachis A. hypogaea V12548 030708 n.a.4 n.a. MT
A. ipaënsis K30076 036234 2100S 06325W BOL
Caulorrhizae A. pintoi W207 032344 n.a. n.a. MG
G12787 013251 1552S 03908W BA
A. repens Nc1579 029220 1510S 04422W MG
Erectoides A. aff. stenophylla Sv3781 035670 n.a. n.a. PRY
A. archeri V7614 017396 2032S 05449W MS
V14625 037907 n.a. n.a. MS
A. benthamii V10416 024864 n.a. n.a. MS
V14669 038091 n.a. n.a. MS
A. brevipetiolata V13959 034479 1919S 05321W MS
V14664 038075 n.a. n.a. MS
V14665 038083 n.a. n.a. MS
A. hermannii V7560 017167 1832S 05445W MS
V10390 024848 n.a. n.a. MS
V10396 024856 n.a. n.a. MS
A. major V7632 017477 2020S 05606W MS
V7644 017540 2126S 05608W MS
V8530 018988 n.a. n.a. MS
V9468 022705 1926S 05512W MS
V14538 037796 n.a. n.a. MS
A. oteroi V14518 037770 n.a. n.a. MS
V14634 037931 n.a. n.a. MS
V14644 038059 n.a. n.a. MS
A. paraguariensis V7677 017621 2208S 05634W MS
V13556 032794 2150S 05715W MS
V13990 034614 2008S 05653W MS
V13993 034631 2007S 05707W MS
V13535 032689 2025S 05634W MS
Microsatellite markers for genusArachis 667
Table 1 (cont.)
Section Species Accession1 BRA2 Lat Long Location3
V14024 034789 2145S 05657W MS
V14025 034797 2143S 05700W MS
V14045 034860 2209S 05732W MS
V14056 034916 2149S 05717W MS
Sv3807 035882 n.a. n.a. PRY
Sv3809 035904 n.a. n.a. PRY
Sv3833 036391 n.a. n.a. PRY
A. porphyricalix V7303 016039 1958S 04746W MG
A. stenophylla V14021 034771 2124S 05627W MS
V14026 034801 2143S 05700W MS
Extranervosae A. macedoi V9912 022900 2026S 05554W MS
V14114 036081 n.a. n.a. MT
A. retusa Sv4966 037982 n.a. n.a. BRA
Heteranthae A. dardani V13383 031607 0758S 03606W PE
A. pusilla V6676 014796 1714S 04426W MG
A. seridoensis V10969 025623 0621S 03637W RN
A. sylvestris V6001 012220 1513S 04709W GO
Procumbentes A. aff. matiensis V8910 020435 n.a. n.a. MT
A. appressipila V9060 022721 1901S 05729W MS
G100025 013099 1901S 05739W MS
G10002S5 013099 1901S 05739W MS
A. hassleri Sv3818FA 035971 n.a. n.a. PRY
A. kretschmeri V7631 017469 2022S 05600W MS
V9917 022918 n.a. n.a. MS
V13980 034584 2011S 05630W MS
A. lignosa V13570 032808 2132S 05749W MS
A. matiensis V13718 036943 1607S 05825W MT
A. pflugeae V135895 032875 2144S 05725W MS
V13589S5 032875 2144S 05725W MS
V13589N5 032875 2144S 05725W MS
V14014 034711 2103S 05659W MS
Sv3775FA 035611 n.a. n.a. PRY
Sv3775FL 036978 n.a. n.a. PRY
Sv3777 035637 n.a. n.a. PRY
Sv3779 035653 n.a. n.a. PRY
A. subcoriacea V8750 020443 1601S 05713W MT
V8943 020290 n.a. n.a. MT
A. vallsii V7635 017493 2005S 05642W MS
Rhizomatosae A. burkartii V7320 016314 2836S 05544W RS
V7363 016047 2921S 04947W RS
A. glabrata V13936 034371 1734S 05237W GO
s/n n.a. n.a. n.a. S.M.
Trierectoides A. guaranitica V7704 017736 2216S 05500W MS
V13600 032913 2256S 05513W MS
A. tuberosa V7607 017353 2131S 05439W MS
V13940 034380 1733S 05238W GO
V14640 038032 n.a. n.a. MS
V14672 038113 n.a. n.a. MS
Triseminatae A. triseminata W144 031437 1439S 04329W BA
W195 032255 n.a. n.a. BA
Total: 9 34 76
1Collector abbreviations: G = W.C. Gregory; K = A. Krapovickas; Nc = N. Costa; Sv = G.P. Silva; V = J.F.M. Valls and W = W.L. Werneck. 2
BRA=Brazilian accession number.
3S.M. = São Manuel City, São Paulo state. Brazilian states: BA = Bahia; GO = Goiás; MG = Minas Gerais; MS = Mato Grosso do Sul; MT = Mato Grosso;
PE = Pernambuco; RN = Rio Grande do Norte and RS = Rio Grande do Sul. Countries: BRA = Brazil; BOL = Bolivia and PRY = Paraguay. 4
n.a. = not available.
ing from a cross between Arachis ipaënsis and Arachis magna.
DNA extraction
The DNA was extracted from leaves using the proce-dure described by Doyle and Doyle (1987) as modified by Grattapaglia and Sederoff (1994). The extracted DNA was diluted in TE (Tris-HCl 10 mM and EDTA 1 mM) and quantified on 0.8% (w/v) agarose gels using known con-centrations of DNA as standards, based on which the ex-tracted DNA was diluted to 5 ngmL-1.
Microsatellite loci
Fifteen primer pairs (Table 2), developed using geno-mic libraries, were used: five Ag primer pairs (Ag117, Ag140, Ag167, Ag171 and Ag39) fromA. glabrata, sec-tion Rhizomatosae; six Ah primer pairs (Ah11, Ah21, Ah282, Ah283, Ah3 and Ah7) fromA. hypogaea, section
Arachisand four Ap primer pairs (Ap176, Ap32, Ap38 and Ap40) fromA. pintoi, sectionCaulorrhizae. The loci iden-tification and characterization methods are described in the references cited in Table 2. Loci validations were per-formed using the F2population described above. All pairs
of primers were used to calculate the genetic variability in-dex.
PCR Amplification
Fragments were amplified using the polymerase chain reaction (PCR) in a PTC100 thermal cycler (MJ Re-search). The reaction was performed in a total volume of 17mL and contained 15 ng of template DNA, 0.17mM of each primer, 0.22 mM of each dNTP, 1 X reaction buffer, 1 U ofTaqDNA polymerase (Amersham Biosciences) and from 1.5 to 2.5 mM of MgCl2according to each pair of
primers (Table 2). The amplification cycle consisted of an initial denaturation step at 94 °C, followed by 32 cycles of 94 °C for 25 s; X °C for 25 s (Table 2) and 72 °C for 25 s and a final 10 min extension step at 72 °C. The annealing tem-perature (X) ranged from 50 to 60 °C, according to the se-quences of each pair of primers. The fragments were separated on 4% (w/v) acrylamide gels (19 acrylamide: 1 bis acrylamide), silver stained (Promega, 1995) and pho-tographed under white light.
Data analysis
The alleles detected in each sample were sized using “EagleSight” version 3.22 (Stratagene). The chi-square test (c2) was used to test if loci segregated according to the ex-pected ratio (1:2:1). The allelic frequencies, exex-pected (He) and observed (Ho) heterozygosities, average genetic dis-tance between accessions (Dg) and the number of alleles per
locus were calculated using the Population Genetic Analy-sis program (PopGene, version 1.21 - Yehet al., 1997). The genetic distances were calculated using Nei’s coefficient (Nei, 1972) and a dendrogram was obtained using the
un-weighted pair-group method with arithmetic averages (UPGMA). The mean numbers of repeats found in each polymorphic locus in each species were estimated based on the expected size of the fragment in the species from which the primers were isolated (focal species) and assuming that the difference in sizes were due to variations in the repeat number and not in the adjacent regions.
Results
Only six loci out of 15 tested showed polymorphism betweenA. magnaandA. ipaënsisand could be validated in the F2population. The data showed all six loci segregating
as expected (1:2:1) (Table 2).
We investigated 34 species of the genusArachis (Ta-ble 1) butA. glabrata(section Rhizomatosae) was evalu-ated only for the primer transferability because the fact that it is tetraploid did not allow the precise determination of allelic dosage in plants that had two or three alleles in a lo-cus.
Using the same amplification conditions for all the species, 10 (66.6%) of the 15 loci analyzed were detected in all sections but not in all species and five (33.3%) did not amplify fragments in all species tested from some sections (Table 3). Primers pair Ag167 allowed amplification only in sections Erectoides, Procumbentes, Rhizomatosae,
TrierectoidesandTriseminatae, while primers pairs Ag171 and Ap40 amplified putative loci in all sections, except in
A. porphyricalix (section Erectoides). Arachis hypogaea
primers allowed the amplification in 90% of the sections and 87% of the species,A. glabrataprimers in 89% of the sections and species, and theA. pintoiprimers amplified the locus in all sections and 98% of the species.
Of the 15 primers pairs 12 detected polymorphism (Table 2) and three (Ag117, Ap32 and Ap38) were mono-morphic. The total number of alleles in polymorphic loci was 269. The number of alleles per locus ranged from four, at locus Ah283, to 39, at Ag39, the expected heterozygosity (He) ranged from 0.310 to 0.963 at these same loci, and the observed heterozygosity (Ho) ranged from zero at Ah283 to 0.324 at Ah21 (Table 2). Ah283 amplified four alleles observed in homozygosis for different plants and thus Ho was zero.
Some plants had banding patterns composed of two fragments. Figure 1 shows that plants 12, 15, 16 and 18 had two fragments in locus Ag171 while only one fragment was detected inA. pflugeaeplants 13, 14 and 17. The plants that showed the two fragment pattern were analyzed as hetero-zygous since microsatellites are co-dominant allowing the detection of both fragments (alleles) in a locus and the spe-cies that had this pattern are diploid, which makes two the maximum number of different alleles in a locus.
(sec-Microsatellite
markers
for
genus
Arachis
699
Table 2- Microsatellite loci analyzed, expected (He) and observed (Ho) heterozygosities, chi-square (c2) values and references.
Locus Motif Primers sequences Length (bp)
Range (bp)
Annealing temperature
MgCl2
(mM)
Number of alleles
He Ho c2 Reference1
Ag117 (GA)19..(AG)18 5’GAATGACAGAGTGAGAGTCCA3’
5’TCAACAAGTTAGTTACCATTAGTTT3’
241 250 50 °C 2.5 1 - - -2 1
Ag140 (GA)28 5’CAGCATTCAATTCAGTTTCG3’
5’TCAACCTCGAACACACAAAA3’
157 118-168 50 °C 2.5 31 0.940 0.307 - 1
Ag167 (CT)12..(TC)7 5’CTCACCTTCAAAGCCCTTGT3’
5’AGAGGGGACAACGACAACC3’
201 165-256 50 °C 2.5 28 0.934 0.086 - 1
Ag171 (GA)22 5’TGACCGTTGGGGTTTTTG3’
5’CAAACCCAAACACACGTCAC3’
197 162-200 50 °C 2.5 20 0.907 0.211 - 1
Ag39 (GA)22 5’TGTAGTCAGCTGCTCCAAAA3’
5’ATGAAAGTTCACTTGAGCAAA3’
163 120-226 50 °C 2.5 39 0.963 0.203 6.66* 1
Ah11 (TTA)15 5’AAATAATGGCATACTTGTGAACAATC3’
5’TTCCACCAAGGCAAGACTATG3’
176 144-190 55 °C 2.5 15 0.777 0.053 0.20* 2
Ah21 (GAA)9 5’CTTGGAGTGGAGGGATGAAA3’
5’CTCACTCACTCGCACCTAACC3’
109 100-148 55 °C 1.5 35 0.950 0.324 6.78* 2
Ah282 (CCA)6..(AAG)6 5’GCAAACACACCACATTTCA3’
5’GGCTCCAATCCCAAACACTA3’
203 177-202 55 °C 2.5 20 0.912 0.247 8.34* 2
Ah283 (AT)8(GT)13 5’GGGGTTCGAAGCTTAATTCC3’
5’CAAGAGCAACTCAATCTTCCTAGA3’
198 160-194 55 °C 2.5 4 0.310 0.000 - 1
Ah3 (GA)15(AG)7(GT)7
(GA)7
5’TCGGAGAACCAAGCACACATC3’ 5’TTGCGCTCTTTCTCACACTC3’
202 185-235 50 °C 1.5 28 0.943 0.086 0.03* 2
Ah7 (TG)8 5’CAGAGTCGTGATTTGTGCACTG3’
5’ACAGAGTCGGCCGTCAAGTA3’
102 100-148 50 °C 1.5 12 0.826 0.250 - 2
Ap176 (AG)18 5’CCAACACAGGGCTTACCAAG3’
5’TCACCGATCCCACTTTTCC3’
200 192-235 50 °C 1.5 15 0.844 0.055 - 3
Ap32 (TC)19 5’GATCATGCTCATCATCAACACC3’
5’ATAGGGAGAAGGCAGGGAGA3’
170 150 60 °C 2.0 1 - - 8.23* 1
Ap38 (CT)25 5’GCTGGAAGACGTCATGGTTT3’
5’GCGAACAAAGGAGGAAGAGA3’
154 152 55 °C 2.0 1 - - - 1
Ap40 (TC)17 5’CTGTTTGATCGCCGCTATG3’
5’GTCAAGTGCTTCCTCCGATG3’
178 159-208 50 °C 2.0 22 0.831 0.118 - 3
1
References: 1 - Barbosaet al., unpublished; 2 - Gimeneset al., unpublished; 3- Palmieriet al.(2002).2Monomorphic loci in the segregation analysis of the F2population, cross betweenA.ipaënsisandA. magna. *
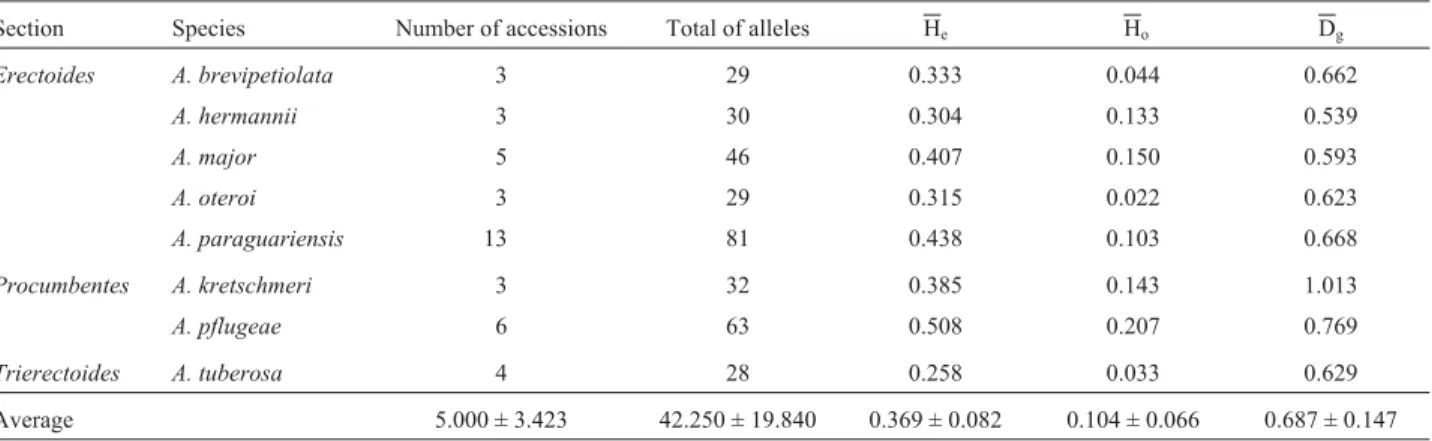
tion Trierectoides) to 81 in A. paraguariensis (section
Erectoides) (Table 4). The Hevalue ranged from 0.258 inA. tuberosa(4 accessions) to 0.508 in A. pflugeae(8 plants from six accessions, sectionProcumbentes) (Table 4).
The mean genetic distances (Dg) between accessions
of each species varied from 0.539 inA. hermannii(section
Erectoides) to 1.013 in A. kretschmeri (section
Procumbentes) and all analyzed species had Dgabove 0.50,
with an average of 0.687. The mean observed
heterozygosity (Ho) in the species with more than three
ac-cessions analyzed ranged from 0.022 inA. oteroi(section
Erectoides) to 0.207 inA. pflugeaeand the mean for the whole sample was 0.104 (Table 4).
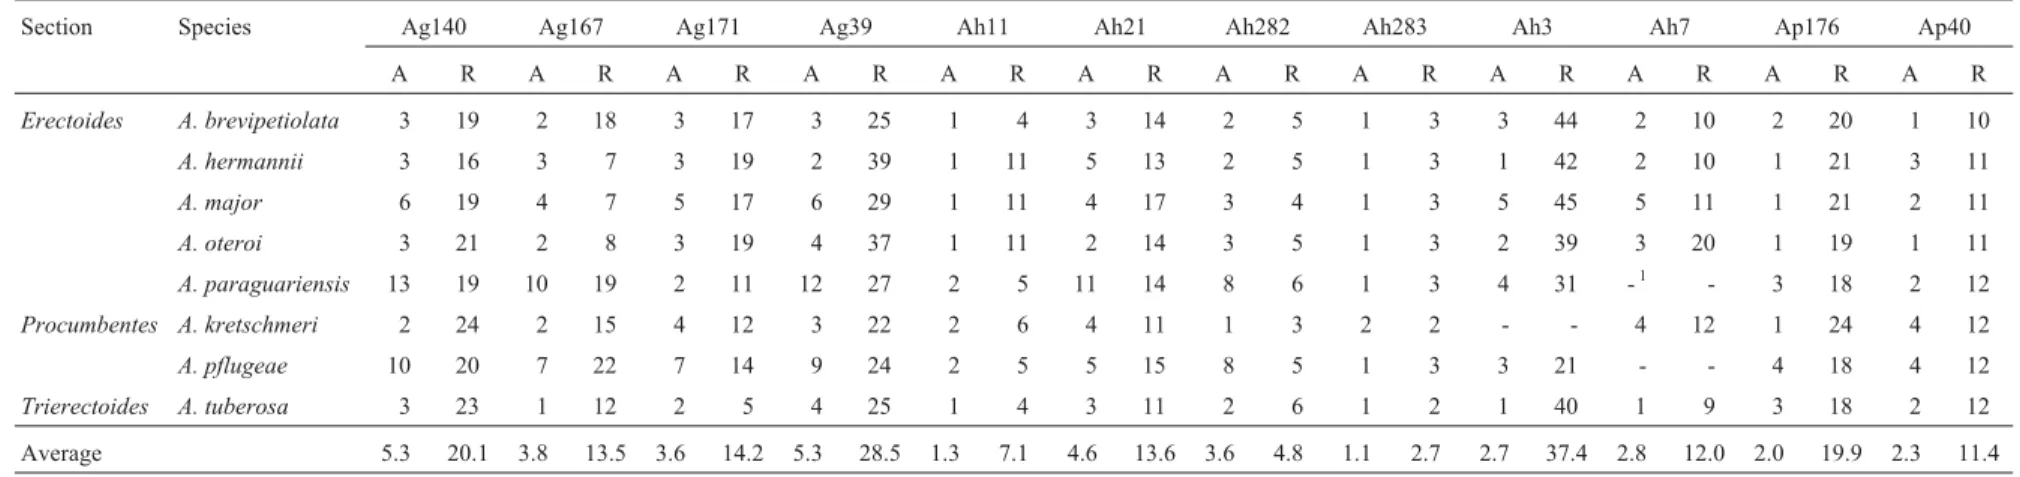
The putative numbers of repeats in the putative loci analyzed in each species that had more than three acces-sions evaluated are presented in Table 5. The estimated number of repeats was sometimes very different between the species analyzed and the species from which the prim-ers pairs were isolated (Table 2). The expected number of repeats was 28 in the fragment amplified by primers pair
Table 3- Amplification pattern (shaded) of various species of different sections of the genusArachisshowing the number of alleles specific to a species and the total number of specific alleles per section (Ta) and per locus..
Section Species Loci and number of alleles Ta
Ag140 Ag167 Ag171 Ag39 Ah11 Ah21 Ah282 Ah283 Ah3 Ah7 Ap176 Ap40
Arachis A. hypogaea 1 1 1 4
A. ipaënsis 1
Caulorrhizae A. pintoi 1 1 1 5
A. repens 1 1
Erectoides A. aff. stenophylla 1 1 43
A. archeri 1
A. benthamii 1
A. brevipetiolata 2 1 2
A. hermannii 1 1
A. major 1 1 1
A. oteroi 1 1 1 1 1 2
A. paraguariensis 1 6 5 4 1 2
A. porphyricalix 1
A. stenophylla 1 1
Extranervosae A. macedoi 1 1 2 6
A. retusa 1 1
Heteranthae A. dardani 1 1 8
A. pusilla 1
A. seridoensis 1
A. sylvestris 1 1 1 1
Procumbentes A. aff. matiensis 21
A. appressipila
A. hassleri 1
A. kretschmeri 1
A. lignosa 1 1
A. matiensis
A. pflugeae 2 3 2 1 1 1
A. subcoriacea 1 2 1 1
A. vallsii 1 1
Rhizomatosae A. burkartii 1 1 1 1 3 1 2 10
A. glabrata1
Trierectoides A. guaranitica 1 1 3
A. tuberosa 1
Triseminatae A. triseminata 1 1 3 2 2 1 1 1 1 13
Total alleles specific per loci 11 17 5 18 6 13 6 1 16 4 4 12 113
Ag140, butA. hermanniishowed an average of only 16 re-peats in three alleles detected in the three accessions ana-lyzed. On the other hand,A. oteroi(sectionErectoides) had an average of 20 repeats in locus Ah7, whereas the expected number of repeats was 8 for the three alleles detected in the three accessions analyzed.
The relationships among the accessions were estab-lished utilizing data from all 15 loci. As can be seen in Fig-ure 2, in general the accessions from a species grouped near or together. Few species had their accessions scattered in the tree, for example,Arachis pflugeaehad six accessions analyzed and they grouped into two groups that were beside each other in the tree. It can also be seen in the tree that all accessions were characterized and in general they were very diverse from each other.
The alleles had different specificities and we found that 58% (156/269) of the total number of alleles were shared by different species and 42% were species-specific (113/269). The largest proportion of species-specific al-leles occurred inA. paraguariensis(16.8% (19/113), sec-tionErectoides) and A. pflugeae(8.8% (10/113), section
Procumbentes). OnlyA. aff matiensis,A. appressipilaand
A. matiensis, all from sectionProcumbentes, did not show any specific allele (Table 3). We also found that 21.8% of the shared alleles (34/156) were shared among species from
the same section but most of them (78.2%) were shared among species from different sections.
Discussion
The segregation analysis (Table 2) showed that the banding pattern analysis (Figure 1) was efficient since the loci segregation observed in the F2population showed non
significant difference from the expected ratio (1:2:1, Men-del’s Law).
In general the microsatellite primers used amplified putative microsatellite loci in most of the species analyzed (91%). Joneset al.(2001) tested microsatellite primers of
Lolium perenne, an allogamous forage species, in eight re-lated species and observed an amplification efficiency of 12 to 80% among the species. Gaitán-Solíset al.(2002) tested common bean (Phaseolus vulgaris) microsatellite primers in four species ofPhaseolusand found that out of the 68 pairs of primers tested 33 (48.5%) amplified the loci, suggesting that polymorphism and cross transferability de-creases when the genetic distance inde-creases between the species from which the loci are isolated and the species to which the loci are transferred. Chagnéet al.(2004) found similar primers pairs transferability ratios for cDNA satellite but lower transferability (54%) for genomic micro-satellites.
Hopkinset al. (1999) and Moretzsohnet al.(2004) reported thatA. hypogaea microsatellite primers showed high transferability to A. monticola, A. ipaënsis and A. duranensis, which are closely related toA. hypogaea. This result is expected since Krapovickas and Gregory (1994) have stated thatA. monticolais believed to be a wild form of A. hypogaea, while in the opinion of Kochert et al.
(1996)A. duranensisandA. ipaënsisare the most probable donors of the genomes of the cultivated peanut. On the other hand, the transferability to other sections of the genus
Arachisobserved by Moretzsohnet al.(2004) was lower (45%) than that observed in our study (91%).
In our study, although some primers did not amplify certain loci in some species, no relation was observed
be-Microsatellite markers for genusArachis 671
Figure 1- Silver stained acrylamide gel (4% w/v). The observed pattern was obtained by the amplification of locus Ag171 in the following
Arachis species: A. kretschmeri (1); A. subcoriacea (2 and 3); A. appressipila(4-6);A. vallsii(7);A. matiensis(8);A. aff. matiensis(9);A. lignosa(10);A. pflugeae(11-18); andA. hassleri(19) of the section
ProcumbentesandA. guaranitica(20 and 21) andA. tuberosa(22) of the sectionTrierectoides. Note the presence of heterozygous plants (12, 15 and 18) and also species from different sections sharing the same allele (14 and 20).
Table 4- Genetic variability index for species with more than three analyzed accessions. The table shows the total number of alleles, the expected (He) and observed (Ho) heterozygosities and the average genetic distance between accessions (Dg).
Section Species Number of accessions Total of alleles He Ho Dg
Erectoides A. brevipetiolata 3 29 0.333 0.044 0.662
A. hermannii 3 30 0.304 0.133 0.539
A. major 5 46 0.407 0.150 0.593
A. oteroi 3 29 0.315 0.022 0.623
A. paraguariensis 13 81 0.438 0.103 0.668
Procumbentes A. kretschmeri 3 32 0.385 0.143 1.013
A. pflugeae 6 63 0.508 0.207 0.769
Trierectoides A. tuberosa 4 28 0.258 0.033 0.629
tween failure to amplify and the origin of the primers, be -cause different results were obtained with primers for loci from the same origin. For example, the primer pair Ag167 amplified fragments in A. glabrata and did not amplify in the sections Extranervosae , Heteranthae and Caulorrhizae , while the Ag140 amplified in all sections (Table 3). The levels of polymorphism among the putative loci analyzed were very different. Some authors have suggested the polymorphism in a microsatellite locus depends on the number of repeats it contains, and the level of polymor -phism increases with the number of repeats (Saghai-Hoshino et al.
Section Species Ag140 Ag167 Ag171 Ag39 Ah11 Ah21 Ah282 Ah283 Ah3 Ah7 Ap176 Ap40
A R A R A R A R A R A R A R A R A R A R A R A R
Erectoides A. brevipetiolata 3 19 2 18 3 17 3 25 1 4 3 14 2 5 1 3 3 44 2 10 2 20 1 10
A. hermannii 3 16 3 7 3 19 2 39 1 11 5 13 2 5 1 3 1 42 2 10 1 21 3 11
A. major 6 19 4 7 5 17 6 29 1 11 4 17 3 4 1 3 5 45 5 11 1 21 2 11
A. oteroi 3 21 2 8 3 19 4 37 1 11 2 14 3 5 1 3 2 39 3 20 1 19 1 11
A. paraguariensis 13 19 10 19 2 11 12 27 2 5 11 14 8 6 1 3 4 31 -1 - 3 18 2 12
Procumbentes A. kretschmeri 2 24 2 15 4 12 3 22 2 6 4 11 1 3 2 2 - - 4 12 1 24 4 12
A. pflugeae 10 20 7 22 7 14 9 24 2 5 5 15 8 5 1 3 3 21 - - 4 18 4 12
Trierectoides A. tuberosa 3 23 1 12 2 5 4 25 1 4 3 11 2 6 1 2 1 40 1 9 3 18 2 12
Average 5.3 20.1 3.8 13.5 3.6 14.2 5.3 28.5 1.3 7.1 4.6 13.6 3.6 4.8 1.1 2.7 2.7 37.4 2.8 12.0 2.0 19.9 2.3 11.4
1Not amplified.
Moroofet al., 1994, Jones et al., 2001, Aranzana et al., 2002). In our study, the estimated number of repeats in the putative loci analyzed (Table 5) suggested that the loci that had a larger number of repeats were more polymorphic than the ones formed by few repeats (3 to 8). Then, the variation in length among the alleles of each locus was due to varia-tion in the number of repeats and not in the flanking regions. The sequences of flanking regions are highly con-served and few alleles would be detected if the polymor-phism found among the accessions were due to differences in these regions.
Our data also indicated that the number of repeats varied greatly from the species of origin (focal species) to the species they were transferred to. Primer pair Ah21 flanked a region that comprised of a (GAA)9motif inA. hypogaeabut had a total of 35 different alleles in the other species analyzed and a mean number of repeats of 13.6. Ah11 flanked a region that is comprised of a (TTA)15motif
inA. hypogaeabut 15 alleles were detected and the mean number of repeats was 7.1 (Table 5). Thus, the loci detected using heterologous primers inArachismay show lower or higher polymorphism since our results showed that some-times the number of repeats increased or decreased when compared to the focal species and that this variation was not linked with the number of repeats in the focal species.
The data also suggested that the loci amplified using heterologous primers had the same type of sequence as found in the focal species in respect to their level of perfec-tion and imperfecperfec-tion because loci that had perfect se-quences (sese-quences composed of uninterrupted repeats) in the focal species were more polymorphic than loci that had imperfect sequences (Table 2). The lower polymorphism in imperfect sequences has been suggested to be related to the lower probability of error during replication (Joneset al., 2001) and Hancock (2000) stated that reduced polymor-phism in interrupted sequences is compatible with the fact that incorrect pairing in that type of sequence is more diffi-cult.
Overall, all the species investigated by us showed high polymorphism among their accessions. The threeA. brevipetiolata accessions analyzed had a high He value
(0.333) and the mean genetic distance between the acces-sions was 0.662. This was also observed in species such as
A. pflugeae (He = 0.508 and Dg = 0.769) and A. paraguariensis(He= 0.438 and Dg= 0.668) that had many
accessions evaluated, six and 13, respectively. Aranzanaet al. (2002) analyzed 25 peach cultivars using 35 microsatellite loci and found He= 0.41, while Ciprianiet al.
(2002) analyzed olive cultivars using 30 microsatellite loci and found He= 0.55. Thus, in general, the germplasm of the
species evaluated, even when represented by only a few ac-cessions, was comprised of individual plants that were very distinct from each other (Figure 2).
The characterization of the genetic variability in germplasm banks allows the levels of variability to be
mon-itored during and after its handling, regeneration and stor-age and thus help to prevent any incidental loss of genetic information. Börneret al.(2000) used nine microsatellite primer pairs to evaluate genetic variability in eightTriticum aestivumaccessions maintained in a genebank and showed that microsatellite is a reliable marker system for verifica-tion of the integrity and genetic stability of genebank sions; no contamination and a genetic drift for one acces-sion were detected.
In our study the accessions did not group exactly ac-cording to the species and sections to which they belonged (Figure 2). However, some groups included accessions and species that are very related or included species of sections that are more related to each other. We also found thatA. pintoiandA. repenswere grouped together and previous evidence has indicated that they are closely related (Krapo-vickas and Gregory, 1994, Gimeneset al., 2000). Similarly,
A. hypogaeawas grouped close toA. ipaënsis, which is the probable donor of theA. hypogaeaB genome (Kochertet al., 1996). We found that theErectoidesandProcumbentes
sections are related to each other, these sections having been placed in the same section (Erectoides) in an older classification (Gregory et al., 1973). The relationships among species of the genusArachisusing other molecular markers, such as AFLP and RAPD, agree in general to the division of the genus into sections (Galgaroet al., 1998, Gimeneset al., 2002b). The differences observed between our results and those of previous studies are most probably due to the high polymorphism found in some of the loci an-alyzed and the sharing of alleles among species from differ-ent sections. The high polymorphism requires a larger num-ber of accessions to be analyzed for the species to be well represented. These shared alleles in the analysis produced homoplasies, defined as alleles identical in state but not by descent (Jarne and Lagoda, 1996). Angers and Bernatchez (1997), using microsatellites, found that homoplasies occur at all taxonomic levels in the genusSalvelinus, even in spe-cies such asS. fontinalisthat has alleles of the same size but with different sequences.
The observed heterozygosity (Ho) was low for most
species (Table 4), indicating that the species studied must be autogamous, or with very low cross-fertilization rates. Valls and Pizarro (1994) believed that most species of the genus Arachis are autogamous because, as seen in A. hypogaea, they have flowers that have characteristics found only in autogamous plants. Our data also suggest that
A. subcoriaceaandA. burkartiimay have a higher rate of cross-pollination than the other species analyzed, but a larger number of plants of both species should be evaluated to obtain more conclusive data. Microsatellite markers will be useful for that purpose because of the codominance and high polymorphism of this type of marker. Knowledge of the mating system of wildArachisspecies will help in the handling of these species in germplasm banks where many accessions of certain species might be grown in close
imity which could result in cross pollination and loss of species identity.
The transferability and the polymorphism obtained with heterologous microsatellites primers from the genus
Arachis were very high in the species analyzed. These primers were also very useful for the characterization of the accessions and showed that the germplasm of the species analyzed possessed high variability.
Acknowledgements
The authors thank Dr. José F. M. Valls of Recursos Genéticos e Biotecnologia - Embrapa for the plant material, Dr. Edson S. Mori for helping with the statistical analysis and Fundação de Amparo à Pesquisa do Estado de São Paulo (FAPESP) for the financial support.
References
Angers B and Bernatchez L (1997) Complex evolution of a salmonid microsatellite locus and its consequences in infer-ring allelic divergence from size information. Mol Biol Evol 14:230-238.
Aranzana MJ, Garcia-Mas J, Carbó J and Arús P (2002) Develop-ment and variability analysis of microsatellite markers in peach. Plant Breed 121:87-92.
Börner A, Chebotar S and Korzum V (2000) Molecular character-ization of the genetic integrity of wheat (Triticum aestivum
L.) germplasm after long-term maintenance. Theor Appl Genet 100:494-497.
Chagné D, Chaumeil P, Ramboer A, Collada C, Guevara A, Cervera MT, Vendramim GG, Garcia V, Frigero J-M, Echt C and Richardson T (2004) Cross-species transferability and mapping of genomic and cDNA SSRs in pines. Theor Appl Genet 109:1204-1214.
Cipriani G, Lot G, Huang W-G, Marrazzo MT, Peterlunger E and Testolin R (1999) AC/GT and AG/CT microsatellite repeats in peach [Prunus persica(L) Batsch]: Isolation, charateri-sation and cross-species amplification in Prunus. Theor Appl Genet 99:65-72.
Cipriani G, Marrazzo MT, Marconi R, Cimato A and Testolin R (2002) Microsatellite markers isolated in olive (Olea europeaeL.) are suitable for individual fingerprinting and reveal polymorphism within ancient cultivars. Theor Appl Genet 104:223-228.
Conagin CHTM (1962) Espécies selvagens do gêneroArachis: Observações sobre os exemplares da coleção de seção de citologia. Bragantia 21:345-348.
Doyle JJ and Doyle JL (1987) Isolation of plant DNA from fresh tissue. Focus 12:13-15.
Dwivedi SL, Gurtu S, Chandra S, Yuejin W and Nigam SN (2001) Assessment of genetic diversity among selected groundnut germplasm. I: RAPD analysis. Plant Breed 120:345-349. Ferguson ME, Burow MD, Schulze SR, Bramel PJ, Paterson AH,
Kresovich S and Mitchell S (2004) Microsatellite identifica-tion and characterizaidentifica-tion in peanut (A. hypogaeaL.). Theor Appl Genet 108:1064-1070.
Gaitán-Solís E, Duque MC, Edwards KJ and Tohme J (2002) Microsatellite repeats in common bean (Phaseolus
vulgaris): Isolation, characterization, and cross-species am-plification inPhaseolusssp. Crop Sci 42:2128-2136. Galgaro L, Lopes CR, Gimenes M, Valls JFM and Kochert G
(1998) Genetic variation between several species of sections
Extranervosae, Caulorrhizae, Heteranthae, and
Triseminatae(genusArachis) estimated by DNA polymor-phism. Genome 41:445-454.
Gimenes MA, Lopes CR, Galgaro ML, Valls JFM and Kochert G (2000) Genetic variation and phylogenetic relationships based on RAPD analysis in section Caulorrhizae, genus
Arachis(Leguminosae). Euphytica 116:187-195.
Gimenes MA, Lopes CR, Galgaro ML, Valls JFM and Kochert G (2002a) RFLP analysis of genetic variation in species of sec-tion Arachis, genus Arachis (Leguminosae). Euphytica 123:421-429.
Gimenes MA, Lopes CR and Valls JFM (2002b) Genetic relation-ship amongArachisspecies based on AFLP. Genet Mol Biol 25:349-353.
Grattapaglia D and Sederoff RR (1994) Genetic linkage maps of
Eucalyptus grandis and Eucalyptus urophilla using a pseudo-testcross mapping strategy and RAPD markers. Ge-netics 137:1121-1137.
Gregory WC, Gregory MP, Krapovickas A, Smith BW and Yarbrough JA (1973) Structure and genetic resources of peanuts. In: Wilson CT (ed) Peanuts - Culture and Uses. American Peanut Research and Education Association, Stillwater, pp 47-133.
Hancock JM (2000) Microsatellites and other simple sequences: Genomic context and mutational mechanisms. In: Goldstein DB and Schlötterer C (eds) Microsatellites Evolution and Applications. Oxford University Press, New York, pp 1-9. He G and Prakash CS (1997) Identification of polymorphic DNA
markers in cultivated peanut (Arachis hypogaeaL.). Euphy-tica 97:143-149.
He G and Prakash C (2001) Evaluation of genetic relationships among botanical varieties of cultivated peanut (A. hypogaea
L.) using AFLP markers. Genet Res Crop Evol 48:347-352. Hopkins MS, Casa AM, Wang T, Mitchell SE, Dean RE, Kochert
G and Kresovich S (1999) Discovery and characterization of polymorphic simple sequence repeats (SSRs) in peanut. Crop Sci 39:1243-1247.
Jarne P and Lagoda PJL (1996) Microsatellites, from molecules to populations and back. Tree 10:424-429.
Jones ES, Dupal MP, Kölliker R, Drayton MC and Forster JW (2001) Development and characterisation of simple se-quence repeat (SSR) markers for perennial ryegrass (Lolium perenneL.). Theor Appl Genet 102:405-415.
Kochert G, Stalker HT, Gimenes MA, Galgaro L, Lopes CR and Moore K (1996) RFLP and cytogenetic evidence on the ori-gin and evolution of allotetraploid domesticated peanut
Arachis hypogaea (Leguminosae). Amer J Bot 83:1282-1291.
Krapovickas A and Gregory WC (1994) Taxonomia del género
Arachis(Leguminosae). Bonplandia 8:1-186.
López-Sesé AI, Staub J, Katzir N and Gómez-Guillamón ML (2002) Estimation of between and within accession variation in selected Spanish melon germplasm using RAPD and SSR markers to assess strategies for large collection evaluation. Euphytica 127:41-51.
(Arachis hypogaeaL.) and its wild relatives based on the analysis of hypervariable regions of the genome. BMC Plant Biol 4:11.
Nei M (1972) Genetic distance between populations. Am Nat 106:283-292.
Otero JR (1952) Informações sobre algumas plantas forrageiras. Serviço de Informação Agrícola 11:1-313.
Palmieri DA, Hoshino AA, Bravo JP, Lopes CR and Gimenes MA (2002) Isolation and characterization of microsatellite loci from the forage speciesArachis pintoi(GenusArachis). Mol Ecol Notes 2:551-553.
Plieske J and Struss D (2001) Microsatellite markers for genome analysis inBrassicaL. development inBrassica napusand abundance in Brassicaceae species. Theor Appl Genet 102:689-694.
Powell W, Morgante M, Andre C, Hanafey M, Vogel J, Tingey S and Rafalski A (1996) The comparison of RFLP, RAPD, AFLP and SSR (microsatellite) markers for germplasm analysis. Mol Breed 2:225-238.
Promega (1995) Technical Manual: Silver Sequence DNA Se-quencing System. Promega Corp., Madison, 25 pp. Saghai-Moroof MA, Biyashev RM, Yang GP, Zhang Q and
Al-lard RW (1994) Extraordinarily polymorphic microsatellite
DNA in barley: Species diversity, chromosomal locations, and populations dynamics. Proc Natl Acad Sci 91:5466-5470.
Shepherd M, Cross M, Maguire TL, Dieters MJ, Williams GG and Henry RJ (2002) Transpecific microsatellites for hard pines. Theor Appl Genet 104:819-827.
Valls JFM and Pizarro EA (1994) Collection of wildArachis
germplasm. In: Kerridge PC and Hardy B (eds) Biology and Agronomy of forageArachis.CIAT, Cali, pp 19-28. Valls JFM and Simpson CE (1994) Taxonomy, natural
distribu-tion, and attributes ofArachis. In: Kerridge PC and Hardy B (eds) Biology and Agronomy of Forage Arachis. CIAT, Cali, pp 1-18.
Yeh FC, Yang RC, Boiley T, Ye ZH and Mao JX (1997) PopGene, the user-frendly shareware for population genetic analysis. Molecular Biology and Biotechnology Center, University of Alberta. (available at http://www.ualberta.ca/ ~fyeh).
Yu K, Park SJ and Poysa V (1999) Abundance and variation of microsatellite DNA sequences in beans (Phaseolus and
Vigna). Genome 42:27-34.
Associate Editor: Márcio de Castro Silva Filho