Transferability and use of microsatellite markers for the genetic analysis
of the germplasm of some
Arachis
section species of the genus
Arachis
Juliana Pereira Bravo
1, Andrea Akemi Hoshino
1, Carla Maria Lara C.D. Angelici
1,
Catalina Romero Lopes
1and Marcos Aparecido Gimenes
1,21
Universidade Estadual Paulista - UNESP, Laboratório de Biotecnologia e Genética Molecular,
Departamento de Genética, Instituto de Biociências, Botucatu, SP, Brazil.
2
Instituto Agronômico de Campinas, Campinas, SP, Brazil.
Abstract
TheArachis section is the most important of the nine sections of the genus Arachis because it includes the cultivated peanut, Arachis hypogaea. The genetic improvement of A. hypogaea using wild relatives is at an early stage of de-velopment in spite of their potential as sources of genes, including those for disease and pests resistance, that are not found in theA. hypogaea primary gene pool. Section Arachis species germplasm has been collected and main-tained in gene banks and its use and effective conservation depends on our knowledge of the genetic variability con-tained in this material. Microsatellites are routinely used for the analysis of genetic variability because they are highly polymorphic and codominant. The objective of this study was to evaluate the transferability of microsatellite primers and the assay of genetic variability between and within the germplasm of some species of theArachis section. Four-teen microsatellite loci developed for three different species ofArachis were analyzed and 11 (78%) were found to be polymorphic. All loci had transferability to all the species analyzed. The polymorphic loci were very informative, with expected heterozygosity per locus ranging from 0.70 to 0.94. In general, the germplasm analyzed showed wide ge-netic variation.
Key words:genetic diversity, germplasm, peanut, transferability, wild species. Received: November 23, 2004; Accepted: November 11, 2005.
Introduction
The genusArachisL. is composed of 69 described species distributed into nine taxonomic sections (Krapovickas and Gregory, 1994). The most studied sec-tion of the genus is theArachissection containing 27 spe-cies (Krapovickas and Gregory, 1994) including the cultivated peanut (Arachis hypogaeaL.), a South America native species which the evidence suggests has its center of origin in Bolivia, where the wild diploid species which are its putative progenitors are found (Gregory et al., 1980; Kochertet al., 1996). ThreeArachisspecies genomes (A, B and D) are known based on chromosomal morphology and crossing relationships, the cultivated peanut being an allotetraploid (AABB) that arose through a single event in-volving hybridization between two wild diploid section Arachis species, A. duranensis (the A genome) and A. ipaënsis(the B genome) (Kochertet al., 1996).
Although the use of wild relatives for the genetic im-provement ofA. hypogaeahas been investigated for a large
number of agronomic traits and wild species have occa-sionally been used as a source of genes for the genetic im-provement of cultivated peanut (Singh et al., 1996; Simpson and Starr, 2001; Burowet al., 1996) breeding pro-grams have typically been undertaken using standard tech-niques and have only explored the primary gene pool (Garciaet al., 1995).
Microsatellite markers are made up of tandemly re-peated sequences of one to six nucleotides (Weber and May 1989) and have been widely used to evaluate genetic vari-ability in plant species (Ghebru et al., 2002; Hormaza, 2002). Gupta and Varshney (2000) have pointed out that microsatellites have many advantages over other types of markers, including high polymorphism, random distribu-tion in eukaryotic genomes and high frequency, while Plieske and Struss (2001) have shown that microsatellite markers developed for one species can also be used in related species with no additional cost for primer develop-ment, a serious restriction to the wider use of micro-satellites. Microsatellites also allow easier data integration because they are amplified by using very stringent Send correspondence to Marcos Aparecido Gimenes. Instituto
polymerase chain reaction (PCR) conditions and, generally speaking, only single loci are amplified.
Germplasm of most wildArachis species has been collected and maintained in various germplasm banks. An assay of the genetic variability of this germplasm is very important for its most effective use in breeding programs and for its conservation, since knowledge of genetic varia-tion can help in regeneravaria-tion, the identificavaria-tion of dupli-cates and the detection of collection sites with high local variability.
Börneret al.(2000) used nine microsatellites to eval-uate the genetic integrity of Triticum aestivum L. germplasm that had been regenerated up to 24 times, dem-onstrating that microsatellites can be used to analyze seed bulks that had been stored at room temperature in a seed reference collection for more than 50 years. No contamina-tion due to foreign pollen or incorrect handling during the multiplication cycles was discovered and genetic drift was
observed for only one accession, showing that microsa-tellites can be used as a simple and reliable marker system for the verification of the integrity and genetic stability of germplasm bank accessions.
The aim of this study was to evaluate the transferabil-ity of microsatellite markers and the genetic variabiltransferabil-ity in the germplasm of wild species of theArachissection of the genusArachisin order to contribute the conservation and better use of this germplasm.
Material and Methods
Biological material
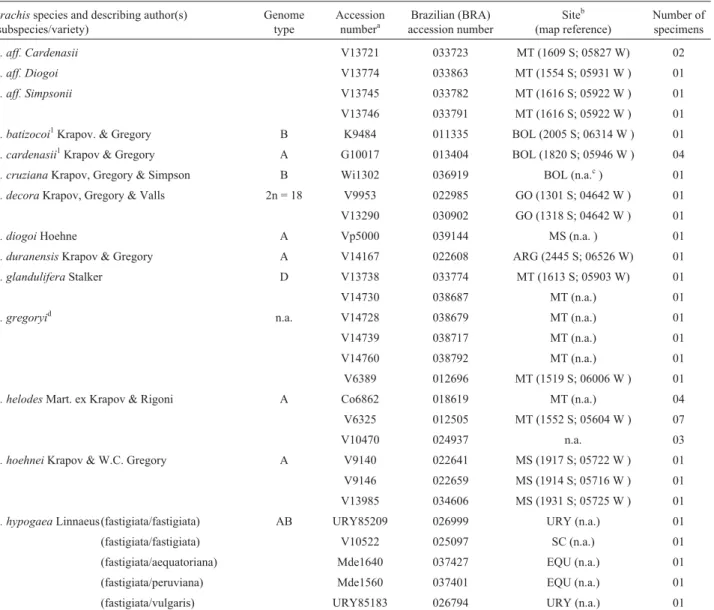
Table 1 lists the 60 Arachis section accessions analyzed, all obtained from Dr. José F. M. Valls of the Bra-zilian agricultural company Empresa Brasileira de Agrope-curia (Embrapa), Centro Nacional de Recursos Genéticos (CENARGEN), Brasília, DF, Brazil.
Table 1- TheArachissection accessions analyzed.
Arachisspecies and describing author(s) (subspecies/variety)
Genome type
Accession numbera
Brazilian (BRA) accession number
Siteb (map reference)
Number of specimens
A. aff. Cardenasii V13721 033723 MT (1609 S; 05827 W) 02
A. aff. Diogoi V13774 033863 MT (1554 S; 05931 W ) 01
A. aff. Simpsonii V13745 033782 MT (1616 S; 05922 W ) 01
V13746 033791 MT (1616 S; 05922 W ) 01
A. batizocoi1Krapov. & Gregory B K9484 011335 BOL (2005 S; 06314 W ) 01
A. cardenasii1Krapov & Gregory A G10017 013404 BOL (1820 S; 05946 W ) 04
A. cruzianaKrapov, Gregory & Simpson B Wi1302 036919 BOL (n.a.c) 01
A. decoraKrapov, Gregory & Valls 2n = 18 V9953 022985 GO (1301 S; 04642 W ) 01
V13290 030902 GO (1318 S; 04642 W ) 01
A. diogoiHoehne A Vp5000 039144 MS (n.a. ) 01
A. duranensisKrapov & Gregory A V14167 022608 ARG (2445 S; 06526 W) 01
A. glanduliferaStalker D V13738 033774 MT (1613 S; 05903 W) 01
V14730 038687 MT (n.a.) 01
A. gregoryid n.a. V14728 038679 MT (n.a.) 01
V14739 038717 MT (n.a.) 01
V14760 038792 MT (n.a.) 01
V6389 012696 MT (1519 S; 06006 W ) 01
A. helodesMart. ex Krapov & Rigoni A Co6862 018619 MT (n.a.) 04
V6325 012505 MT (1552 S; 05604 W ) 07
V10470 024937 n.a. 03
A. hoehneiKrapov & W.C. Gregory A V9140 022641 MS (1917 S; 05722 W ) 01
V9146 022659 MS (1914 S; 05716 W ) 01
V13985 034606 MS (1931 S; 05725 W ) 01
A. hypogaeaLinnaeus(fastigiata/fastigiata) AB URY85209 026999 URY (n.a.) 01
(fastigiata/fastigiata) V10522 025097 SC (n.a.) 01
(fastigiata/aequatoriana) Mde1640 037427 EQU (n.a.) 01
(fastigiata/peruviana) Mde1560 037401 EQU (n.a.) 01
DNA extraction, microsatellite loci and amplification
The DNA of each plant was extracted from leaves by the procedure of Doyle and Doyle (1987) as modified by Grattapaglia and Sederoff (1994), diluted in Tris EDTA buffer (10 mM Tris-HCl mM and 1 mM EDTA), quantified in 0.8% (w/v) agarose gels based on comparison to known DNA dilutions and diluted to 5 ng/mL.
Fourteen microsatellite prime pairs (Table 2) from genomic libraries were used, three (Ag117, Ag140 and Ag171) fromArachis glabrata(Rhizomatosaesection), eight (Ah3, Ah7, Ah11, Ah30, Ah6-125, Ah 126, Ah282 and Ah283) fromA. hypogaeaand three (Ap32, Ap38 and Ap40) from Arachis pintoi (Caulorrhizae section).
Arachisspecies and describing author(s) (subspecies/variety)
Genome type
Accession numbera
Brazilian (BRA) accession number
Siteb (map reference)
Number of specimens
(fastigiata/vulgaris) URY85062 026239 URY (n.a.) 01
(fastigiata/vulgaris) URY85273 027251 URY (n.a.) 01
(hypogaea/hypogaea) Pd3147 039229 RS (n.a.) 01
(hypogaea/hypogaea) V12577 030775 MS (n.a.) 01
(hypogaea/hypogaea) V12548 030708 MT (n.a.) 01
(hypogaea/hypogaea) Pd3324 029807 PA (n.a.) 01
(n.a.) As433 n.a. n.a. 01
(n.a.) Mde1600 n.a. n.a. 01
(n.a.) Mde1670 n.a. n.a. 01
(n.a.) W725 n.a. n.a. 01
A. ipaënsisKrapov & Gregory B K30076 036234 BOL (2100 S; 06325 W ) 01
A. kempff-mercadoi: Krapov, Gregory & Simpson A V13250 030643 BOL (1745 S; 06310 W ) 01
A. kuhlmanniiKrapov & Gregory A V9394 022629 n.a. 01
V6404 012653 MT (1537 S; 05848 W ) 01
V8887 020206 MT (1537 S; 05848 W ) 01
V6352 012611 MT (1556 S; 05748 W ) 01
V9479 22586 MS (1955 S; 05530 W ) 01
A. magnaKrapov, Gregory & Simpson B K30097 036871 BOL (1622 S; 06058 W ) 01
V13751 033812 MT (1616 S; 05927 W ) 01
V13748 033804 MT (1616 S; 05924 W ) 01
V13761 033847 MT (1521 S; 06004 W) 01
V14744 038741 MT (n.a.) 01
A. microspermaKrapov, Gregory & Valls A V8711 020397 MS (2205 S; 05631 W ) 01
V7681 017655 MS (2206 S; 05631 W ) 01
A. monticolaKrapov & Rigoni AB V14165 036188 ARG (2407 S; 06573 W ) 01
A. palustrisKrapov, Gregory & Valls 2n = 18 V13023 030058 TO (0725 S; 04737 W ) 01
A. praecoxKrapov, Gregory & Valls 2n = 18 V13777 n.a. n.a. 01
A. schininiid A V9923 022926 PRY (2223 S; 05620 W 02
A. simpsoniiKrapov & Gregory A V13728 033740 BOL (1619 S; 05826 W ) 01
V13732 034037 MT (1557 S; 05845 W ) 01
A. stenosperma: Krapov & Gregory A V10309 024830 MT (1628 S; 05439 W ) 01
A. validaKrapov & Gregory B V13516 032646 MS (1904 S; 05729 W ) 01
A. villosaBenth. A V12812 030813 URY (3016 S; 05737 W ) 07
Total 27 60 83
a
As- A. O. Scariot;Co- L. Coradin;G- W.C. Gregory;K- A. Krapovickas;Pd- G. Pedralli;Sv- G.P. Silva;V- J.F.M. Valls;Vp -V. Pott;W- W.L. Werneck;Wi -D.E. Williams;bKey: ARG = Argentina; BOL = Bolivia; ECU = Ecuador. Brazilian states: GO = Goiás; MS = Mato Grosso do Sul;
MT = Mato Grosso; PA = Pará; PRY = Paraguay; RS = Rio Grande do Sul; SC = Santa Catarina; TO =Tocantins; URY = Uruguay.cn.a. = not available.
Amplifications were performed using a PTC100 ther-mal cycler (MJ Research, San Francisco). Reactions were carried out in a total volume of 10mL and contained 15 ng of template DNA, 0.17 mM of each primer, 0.22 mM of each dNTP, 1X of reaction buffer, 1 U ofTaqDNA poly-merase (Amersham Biosciences, Piscataway) and from 1.5 to 2.5 mM MgCl2(Table 2). The amplification cycle
con-sisted of an initial denaturation step at 94 °C, followed by 32 cycles of 94 °C for 25 s; (45 °C to 60 °C) for 25 s (Table 2) and 72 °C for 25 s and a final 10 min extension step at 72 °C. The annealing temperatures ranged according to the sequence of the primers (Table 2). The fragments were sep-arated on 4% (w/v) acrylamide gels (19 acrylamide: 1 bis acrylamide) and the gels were silver stained (Promega, 1995) and photographed under white light.
Data analysis
The size of each allele was estimated using the ‘EagleSight’ software version 3.22 (Stratagene, Austin). Expected (He) and observed (Ho) heterozygosities, genetic distances and number of alleles/locus were calculated with
the Population Genetic Analysis program (PopGene, ver-sion 1.21 - Yehet al., 1997). A dendrogram was obtained by using the TreeCon for Windows program (version 1.3b; Van de Peer and De Wachter, 1994) that uses the Nei and Li’s coefficient. The mean estimated number of repeats in each locus was calculated based on the expected length of fragment and the motif of each locus in focal species.
Results
All 14 loci allowed the amplification of microsatellite loci in all theArachissection species analyzed, eleven loci being polymorphic (78%) and three monomorphic (22%). Two of the monomorphic loci (Ap32 and Ap38) were iso-lated from theCaulorrhizaesection speciesA. pintoiand one monomorphic loci (Ag117) from the Rhizomatosae section speciesA. glabrata.
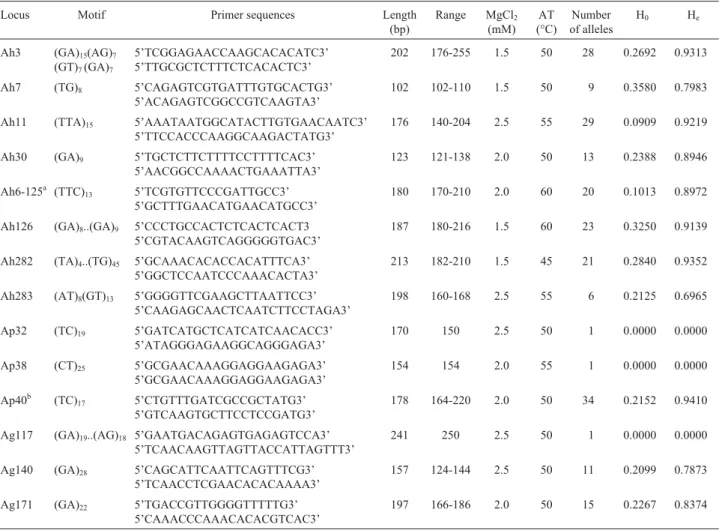
We detected 201 putative alleles at the polymorphic loci Ah3, Ah7, Ah11, Ah30, Ah6-125, Ah126, Ah282, Ah283, Ag140, Ag171 and Ap40, with a mean of 18.3 al-leles per polymorphic locus which ranged from six for lo-cus Ah283 to 34 for the Ap40 lolo-cus (Table 2). The number
Table 2- Microsatellite loci analyzed, motifs, primer sequences, expected length in the focal species, MgCl2concentration per reaction, annealing
temperatures, number of alleles per locus and observed (Ho) and expected (He) heterozygosity values.
Locus Motif Primer sequences Length
(bp)
Range MgCl2
(mM) AT (°C)
Number of alleles
H0 He
Ah3 (GA)15(AG)7
(GT)7(GA)7
5’TCGGAGAACCAAGCACACATC3’ 5’TTGCGCTCTTTCTCACACTC3’
202 176-255 1.5 50 28 0.2692 0.9313
Ah7 (TG)8 5’CAGAGTCGTGATTTGTGCACTG3’
5’ACAGAGTCGGCCGTCAAGTA3’
102 102-110 1.5 50 9 0.3580 0.7983
Ah11 (TTA)15 5’AAATAATGGCATACTTGTGAACAATC3’
5’TTCCACCCAAGGCAAGACTATG3’
176 140-204 2.5 55 29 0.0909 0.9219
Ah30 (GA)9 5’TGCTCTTCTTTTCCTTTTCAC3’
5’AACGGCCAAAACTGAAATTA3’
123 121-138 2.0 50 13 0.2388 0.8946
Ah6-125a (TTC)
13 5’TCGTGTTCCCGATTGCC3’
5’GCTTTGAACATGAACATGCC3’
180 170-210 2.0 60 20 0.1013 0.8972
Ah126 (GA)8..(GA)9 5’CCCTGCCACTCTCACTCACT3
5’CGTACAAGTCAGGGGGTGAC3’
187 180-216 1.5 60 23 0.3250 0.9139
Ah282 (TA)4..(TG)45 5’GCAAACACACCACATTTCA3’
5’GGCTCCAATCCCAAACACTA3’
213 182-210 1.5 45 21 0.2840 0.9352
Ah283 (AT)8(GT)13 5’GGGGTTCGAAGCTTAATTCC3’
5’CAAGAGCAACTCAATCTTCCTAGA3’
198 160-168 2.5 55 6 0.2125 0.6965
Ap32 (TC)19 5’GATCATGCTCATCATCAACACC3’
5’ATAGGGAGAAGGCAGGGAGA3’
170 150 2.5 50 1 0.0000 0.0000
Ap38 (CT)25 5’GCGAACAAAGGAGGAAGAGA3’
5’GCGAACAAAGGAGGAAGAGA3’
154 154 2.0 55 1 0.0000 0.0000
Ap40b (TC)17 5’CTGTTTGATCGCCGCTATG3’
5’GTCAAGTGCTTCCTCCGATG3’
178 164-220 2.0 50 34 0.2152 0.9410
Ag117 (GA)19..(AG)18 5’GAATGACAGAGTGAGAGTCCA3’
5’TCAACAAGTTAGTTACCATTAGTTT3’
241 250 2.5 50 1 0.0000 0.0000
Ag140 (GA)28 5’CAGCATTCAATTCAGTTTCG3’
5’TCAACCTCGAACACACAAAA3’
157 124-144 2.5 50 11 0.2099 0.7873
Ag171 (GA)22 5’TGACCGTTGGGGTTTTTG3’
5’CAAACCCAAACACACGTCAC3’
197 166-186 2.0 50 15 0.2267 0.8374
primer, with the eightA. hypogaeaprimers detecting 144 alleles (18 per locus), the threeA. pintoiprimers 35 alleles (11.7 per locus) and the threeA. glabrataprimers 25 alleles (8.3 per locus).
The mean observed heterozygosity for the 11 poly-morphic loci was 0.2301, the highest value (0.3580) being that for Ah7 locus and the lowest (0.0909) for the Ah11 lo-cus (Table 2).
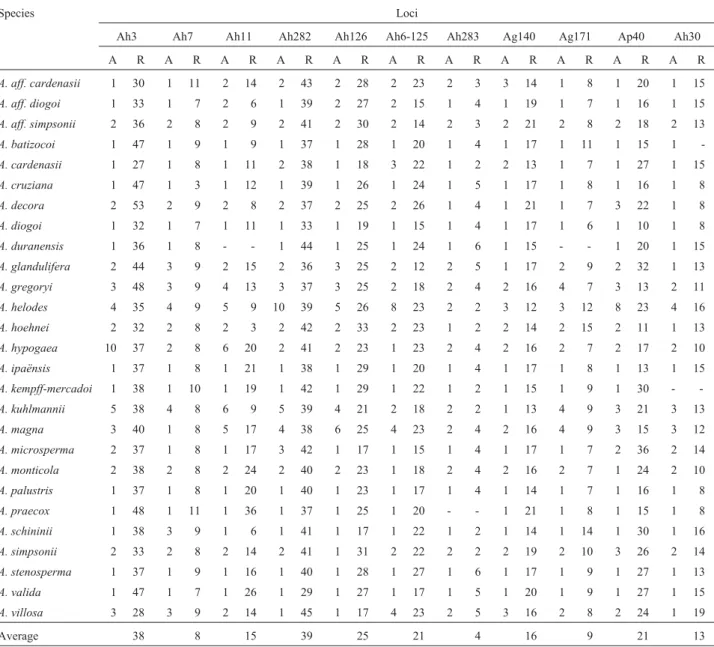
The mean number of repeats at the polymorphic loci in the non-focal species was estimated on the basis of ob-served fragment sizes (Table 3). Variation in the repeat number was very wide, ranging from two repeats at the Ah283 locus to 53 at the Ah3 locus.
We also calculated the variability indices for species with multiple accessions or multiple samples of one
acces-locus ranged from 1.14 inArachis schininii(undescribed species) to 4.14 inArachis helodesand the mean expected heterozygosity (He) ranged from 0.0446 inA. schininiito
0.4706 inA. helodes.
Some individual plants had banding patterns com-posed of two fragments (Figure 1), such plants being analyzed as heterozygous since microsatellites are co-dominant and allow the detection of both alleles in a locus and because most species analyzed were diploid and hence the maximum number of different alleles in a locus was two. The mean observed heterozygosity values (H0) ranged
from 0 for theArachisspeciescardenasii,gregoryi,magna andsimpsoniito 0.1179 forArachis kuhlmannii.(Table 4).
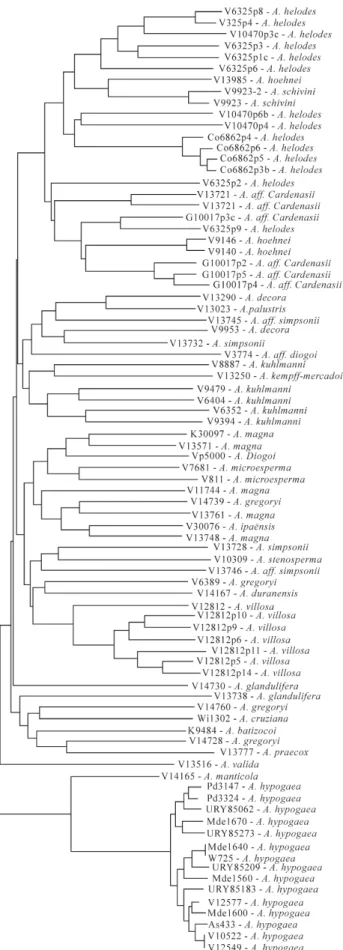
Relationships between accessions based on the data for the 14 loci analyzed are presented in Figure 2. As can be
Table 3- Number of alleles in the polymorphic loci (A) and mean estimated number of repeats (R) in each locus evaluated in theArachisspecies.
Species Loci
Ah3 Ah7 Ah11 Ah282 Ah126 Ah6-125 Ah283 Ag140 Ag171 Ap40 Ah30
A R A R A R A R A R A R A R A R A R A R A R
A. aff. cardenasii 1 30 1 11 2 14 2 43 2 28 2 23 2 3 3 14 1 8 1 20 1 15
A. aff. diogoi 1 33 1 7 2 6 1 39 2 27 2 15 1 4 1 19 1 7 1 16 1 15
A. aff. simpsonii 2 36 2 8 2 9 2 41 2 30 2 14 2 3 2 21 2 8 2 18 2 13
A. batizocoi 1 47 1 9 1 9 1 37 1 28 1 20 1 4 1 17 1 11 1 15 1
-A. cardenasii 1 27 1 8 1 11 2 38 1 18 3 22 1 2 2 13 1 7 1 27 1 15
A. cruziana 1 47 1 3 1 12 1 39 1 26 1 24 1 5 1 17 1 8 1 16 1 8
A. decora 2 53 2 9 2 8 2 37 2 25 2 26 1 4 1 21 1 7 3 22 1 8
A. diogoi 1 32 1 7 1 11 1 33 1 19 1 15 1 4 1 17 1 6 1 10 1 8
A. duranensis 1 36 1 8 - - 1 44 1 25 1 24 1 6 1 15 - - 1 20 1 15
A. glandulifera 2 44 3 9 2 15 2 36 3 25 2 12 2 5 1 17 2 9 2 32 1 13
A. gregoryi 3 48 3 9 4 13 3 37 3 25 2 18 2 4 2 16 4 7 3 13 2 11
A. helodes 4 35 4 9 5 9 10 39 5 26 8 23 2 2 3 12 3 12 8 23 4 16
A. hoehnei 2 32 2 8 2 3 2 42 2 33 2 23 1 2 2 14 2 15 2 11 1 13
A. hypogaea 10 37 2 8 6 20 2 41 2 23 1 23 2 4 2 16 2 7 2 17 2 10
A. ipaënsis 1 37 1 8 1 21 1 38 1 29 1 20 1 4 1 17 1 8 1 13 1 15
A. kempff-mercadoi 1 38 1 10 1 19 1 42 1 29 1 22 1 2 1 15 1 9 1 30 -
-A. kuhlmannii 5 38 4 8 6 9 5 39 4 21 2 18 2 2 1 13 4 9 3 21 3 13
A. magna 3 40 1 8 5 17 4 38 6 25 4 23 2 4 2 16 4 9 3 15 3 12
A. microsperma 2 37 1 8 1 17 3 42 1 17 1 15 1 4 1 17 1 7 2 36 2 14
A. monticola 2 38 2 8 2 24 2 40 2 23 1 18 2 4 2 16 2 7 1 24 2 10
A. palustris 1 37 1 8 1 20 1 40 1 23 1 17 1 4 1 14 1 7 1 16 1 8
A. praecox 1 48 1 11 1 36 1 37 1 25 1 20 - - 1 21 1 8 1 15 1 8
A. schininii 1 38 3 9 1 6 1 41 1 17 1 22 1 2 1 14 1 14 1 30 1 16
A. simpsonii 2 33 2 8 2 14 2 41 1 31 2 22 2 2 2 19 2 10 3 26 2 14
A. stenosperma 1 37 1 9 1 16 1 40 1 28 1 27 1 6 1 17 1 9 1 27 1 13
A. valida 1 47 1 7 1 26 1 29 1 27 1 17 1 5 1 20 1 9 1 27 1 15
A. villosa 3 28 3 9 2 14 1 45 1 17 4 23 2 5 3 16 2 8 2 24 1 19
seen, all accessions were characterized and the diversity be-tween accessions of a particular species was very high. Many accessions were grouped according to the species to which they belonged with, for instance, A.helodesandA. hypogaea) accessions being very related to each other, while some accessions were grouped away from the other accessions of the same species, an example being A. hoehneiandA. simpsoniiaccessions which were placed in different clusters.
Discussion
Independent of theArachisspecies (A.hypogaea, A. glabrataorA. pintoi) from which they were originally de-veloped, all the primers tested allowed the amplification of loci in all theArachisspecies analyzed. Primer transferabil-ity between theArachissection species demonstrated that
Figure 1- Silver stained 4% (w/v) acrylamide gel showing polymorphism at locus Ah282 in plants ofArachis schinini (plants 1 to 3),Arachis hoehnei(plants 4 to 8) andArachis helodes(plants 9 to 22). The number of fragments in the plants ranged from two (plants 1, 3, 5, 6, 8, 9, 11, 12, 14, 19, 20, 21, 22) to four (plants 13, 16, 17, 18). It can also be seen that some plants (17 and 19) from the same species did not share any fragment with each other. M = molecular weight.
Figure 2- Dendrogram showing the relationship between 83 plants of 60 genusArachisaccessions. The dendrogram was based on the analysis of 14 microsatellite loci.
Table 4- Number of samples analyzed, average number of different alleles per locus, mean observed heterozygosity (H0) and mean expected
heterozygosity (He).
Species Number of
samples
Average num-ber of alleles
He H0
A. aff cardenasii 2 1.38 0.1346 0.0769
A. aff. simpsonii 2 1.78 0.3929 0.0000
A. cardenasii 4 1.28 0.0982 0.0000
A. decora 2 1.57 0.2589 0.0357
A. glandulifera 2 1.78 0.3393 0.1071
A. gregoryi 4 2.43 0.4514 0.0000
A. helodes 14 4.14 0.4706 0.0997
A. hoehnei 3 1.57 0.2738 0.0714
A. hypogaea 15 2.78 0.4700
-A. kuhlmannii 5 2.93 0.4615 0.1179
A. magna 5 2.36 0.3829 0.0000
A. microsperma 2 1.64 0.1875 0.0357
A. schinini 2 1.14 0.0446 0.0357
A. simpsonii 2 1.21 0.1071 0.0000
A. villosa 7 1.93 0.2592 0.0663
enough to allow locus amplification, agreeing with previ-ous work by other authors who have shown that microsatellite flanking regions are conserved, being even used to phylogenetic inferences in a number of species (Matsuokaet al.,2002; Rossetoet al.,2002). We found that the percentage of cross-species transferability was very high considering the number of species analyzed and ge-netic distance among them. Hopkinset al. (1999) who ana-lyzed polymorphism inA.hypogaeausing sixA. hypogaea microsatellite loci also observed transferability to other Arachis species (A. monticola, A. ipaënsis and A. duranensis), but all of them were closely related to A. hypogaea. Likewise, Moretzsohnet al.(2004) investigated 36Arachisspecies and observed up to 76% microsatellite primer transferability toArachissection species and up to 45% to species of the other eight sections of the genus Arachis. The different transferability levels between our study and that of Moretzsohnet al.(2004) was probably be-cause we optimized the annealing temperature and MgCl2
concentration while Moretzsohn et al. (2004) optimized only the annealing temperature. Transferability has been observed in many other genera and species, Collevattiet al. (1999) having obtained total transferability of 10Caryocar brasiliensismicrosatellite loci to five otherCaryocar spe-cies, while Gaitán-Solís et al. (2002) developed 68 Phaseolus vulgaris microsatellite loci and found that the transferability rate to other four other Phaseolus species was almost 50%.
In general the estimated number of repeats in the polymorphic loci in non-focal species were different from the number of repeats found in the same loci in the focal species. For example, the expected allele size of the A. hypogaeaAh282 locus was 213 base pairs (bp) with 45 TG repeats (Table 2) while in the species to which it was trans-ferred the estimated repeat number ranged from 29 for Arachis validato 45 forArachis villosa(Table 3), showing that this locus was highly polymorphic with 22 alleles. However, on the other hand, locus Ah283 presented 21 re-peats inA. hypogaea, two to six repeats in the other species and low polymorphism with only six alleles detected in the whole sample. Our data indicate that the number of repeats as well as the level of polymorphism can vary extensively between focal and non-focal species and that allele length is general longer in focal species than in non-focal species.
Overall, variability levels in the species were moder-ately high (He= 0.2759). The Hevalue was high in species
for which only a few accessions were analyzed, e.g. Arachis decora(He = 0.2589 for two accessions) and A.
kuhlmannii(He= 0.4615 for five accessions). Our results
thus indicate that the germplasm of the species analyzed was generally composed of highly contrasting individuals. The genetic variability of diploidArachisspecies has been reported in a number of studies using different molecular markers (Galgaroet al., 1998; Gimeneset al.,2002).
How-ment length polymorphism (AFLP) and random amplified polymorphic DNA (RAPD) which score as dominant markers and lead to an underestimation of genetic variabil-ity. Furthermore, in the case of RAPD, data integration and comparison are difficult due to the detection of multiple loci and low repetitiveness.
In general, the mean observed heterozygosity found in theArachisspecies analyzed was low for all loci, as ex-pected for a self-fertilizing species, indicating that the breeding system of the analyzed species is preferentially autogamous. However, we observed that certain Arachis species (e.g. A.glandulifera, A. helodesand A.kuhlmannii) presented moderate levels of observed heterozygosity,A. helodesfor example presenting H0= 0.0997 indicating that,
on average, 9.97% of individual plants analyzed were het-erozygous for any the loci analyzed. The frequencies ob-served in some species such as A. kuhlmannii (11.79%) clearly show that allogamy or other mechanisms to retain heterozygosity occur inArachis. Allogamy can have conse-quences for the conservation of the species germplasm bank since a loss of genetic identity of the species can occur due to pollen contamination.
The genetic relationships between species established based on our microsatellite data (Figure 2) partially agreed with relationships established based on other types of data. For instance, our data placed A. hypogaea and Arachis monticolatogether, agreeing with previous work showing that they are highly related to each other (Patteeet al.,1998; He and Prakash, 2001). Also, A. magna andA. ipaënsis were located close to each other in our tree (Figure 2) and are known to be morphologically very similar to each other (Krapovickas and Gregory, 1994). Furthermore, the A. decoraV13290 accession andA. palustris V13023 were placed very close to each other in our tree (Figure 2), sup-porting our unpublished data which shows that these two species have 18 chromosomes and show no polymorphism on their rDNA transcribed spacers, indicating that they are closely related to each other phylogenetically.
This was the case forA. simpsoniiaccessions, which pre-sented a genetic distance (data not shown) of 0.9359 whereas unrelated species such asA. magnaandA. villosa presented a genetic distance of 0.7506. This means that these species could not be characterized with the 14 microsatellite markers used in our study and that larger samples, which allow better sampling of intraspecific vari-ation, need to be analyzed.
The microsatellite loci used in this study were quite efficient for the analysis of genetic variability inArachis section species because they presented high transferability to species from the same genus and they were polymorphic in the species to which they were transferred, thus permit-ting the analysis of related species without the development of specific primer pairs. The characterization of the genetic variability of the germplasm analyzed could be used to plan sampling programs, and assist in germplasm maintenance and the formation of species ‘core collections’. Moreover, codominance and high polymorphism can determine varia-tion in breeding systems. On the other hand, the markers were not efficient in the establishment of genetic relation-ships between the species investigated in this study, proba-bly due to the very small number of accessions analyzed for some species, high variability among accessions in the loci analyzed and homoplastic fragments.
Acknowledgments
The authors would like to thank Dr. José F.M. Valls and CENARGEM/EMBRAPA for the plant material, Dr. Edson S. Mori for help with the statistical analysis and Fundação de Amparo a Pesquisa do Estado de São Paulo (FAPESP) for the funding.
References
Börner A, Chebotar S and Korzum V (2000) Molecular character-ization of the genetic integrity of wheat (Triticum aestivum
L.) germplasm after long-term maintenance. Theor Appl Genet 100:494-497.
Burow MD, Starr JL, Simpson CE and Paterson AH (1996) Identi-fication of RAPD markers in peanut (Arachis hypogaea) as-sociated with root-knot nematode resistance derived fromA. cardenasii. Mol Breed 2:307-319.
Collevatti GR, Brondani RPV and Grattapaglia D (1999) Devel-opment and characterization of microsatellite markers for genetic analysis of a Brazilian endangered tree species
Caryocar brasiliensis. Heredity 83:748-756.
Doyle JJ and Doyle JL (1987) A rapid DNA isolation procedure for small amounts of leaf tissue. Focus 12:13-15.
Gaitán-Solís E, Duque MC, Edwards KJ and Tohme J (2002) Microsatellite repeats in common bean (Phaseolus vulgaris): Isolation, characterization, and cross-species am-plification inPhaseolusssp. Crop Sci 42:2128-2136. Galgaro L, Lopes CR, Gimenes M, Valls JFM and Kochert G
(1998) Genetic variation between several species of sections
Extranervosae, Caulorrhizae, Heteranthae, and
Triseminatae(genusArachis) estimated by DNA polymor-phism. Genome 41:445-454.
Garcia GM, Stalker HT and Kochert G (1995) Introgression anal-ysis of an interspecific hybrid population in peanuts (Arachis hypogaeaL.) using RFLP and RAPD markers. Ge-nome 38:166-176.
Ghebru B, Schmidt RJ and Bennetzen JL (2002) Genetic diversity of Eritrean sorghum landraces assessed with simple se-quence repeats (SSR) markers. Theor Appl Genet 105:229-236.
Gimenes MA, Lopes CR and Valls JFM (2002) Genetic relation-ship amongArachisspecies based on AFLP. Genet Mol Biol 25:349-353.
Grattapaglia D and Sederoff RR (1994) Genetic linkage maps of
Eucalyptus grandis and Eucalyptus urophilla using a pseudo-testcross mapping strategy and RAPD markers. Ge-netics 137:1121-1137.
Gupta PK and Varshney RK (2000) The development and use of microsatellite markers for genetic analysis and plant breed-ing with emphasis on bread wheat. Euphytica 113:163-185. Gregory WC, Krapovickas A and Gregory MP (1980) Structure,
variation, evolution and classification inArachis. In: Sum-merfiled RJ and Bunting AH (eds) Advances in Legume Sci-ence. Royal Botanic Gardens, London, pp 469-481. He G and Prakash C (2001) Evaluation of genetic relationships
among botanical varieties of cultivated peanut (A. hypogaea
L.) using AFLP markers. Genet Res Crop Evol 48:347-352. Hopkins MS, Casa AM, Wang T, Mitchell SE, Dean RE, Kochert
G and Kresovich S (1999) Discovery and characterization of polymorphic simple sequence repeats (SSRs) in peanut. Crop Sci 39:1243-1247.
Hormaza JI (2002) Molecular characterization and similarity rela-tionships among apricot (Prunus armeniacaL.) genotypes using simple sequence repeats. Theor Appl Genet 104:321-328.
Kochert G, Stalker HT, Gimenes MA, Galgaro L, Lopes CR and Moore K (1996) RFLP and cytogenetic evidence on the ori-gin and evolution of allotetraploid domesticated peanut
Arachis hypogaea (Leguminosae). Amer J Bot 83:1282-1291.
Krapovickas A and Gregory WC (1994) Taxonomia del género
Arachis(Leguminosae). Bonplandia 8:1-186.
Matsuoka Y, Mitchell SE, Kresovich S, Goodman M and Doebley J (2002) Microsatellites inZea- Variability, patterns of mu-tations, and use for evolutionary studies. Theor Appl Genet 104:436-450.
Moretzsohn MC, Hopkins MS, Mitchell SE, Kresovich S, Valls JFM and Ferreira ME (2004) Genetic diversity of peanut (Arachis hypogaeaL.) and its wild relatives based on the analysis of hypervariable regions of the genome. BMC Plant Biol 4:11.
Palmieri DA, Hoshino AA, Bravo JP, Lopes CR and Gimenes MA (2002) Isolation and characterization of microsatellite loci from the forage speciesArachis pintoi(GenusArachis). Mol Ecol Notes 2:551-553.
Pattee HE, Stalker HT and Giesbrecht FG (1998) Reproductive efficiency in reciprocal crosses ofArachis monticolawithA. hypogaeasubspecies. Peanut Sci 25:7-12.
102:689-694.
Promega (1995) Technical Manual: Silver Sequence DNA Se-quencing System. Promega Corp, Madison, 25 pp. Rosseto M, McNally J and Henry RJ (2002) Evaluating the
poten-tial of SSR flanking regions for examining taxonomic rela-tionships in the Vitaceae. Theor Appl Genet 104:61-66. Singh KP, Raina SN and Singh AK (1996) Variation in
chromo-somal DNA associated with the evolution ofArachis spe-cies. Genome 39:890-897.
Stalker HT (1991) A new species in sectionArachisof peanuts with a D genome. Amer J Bot 78:630-637.
Crop Sci 41:918.
Van de Peer Y and De Wachter R (1994) TREECON for Win-dows:A software package for the construction and drawing of evolutionary trees for the Microsoft Windows environ-ment. Comput Appl Biosci 10:569-570.
Yeh FC, Yang RC, Boiley T, Ye ZH and Mao JX (1997) PopGene, the user-frendly shareware for population genetic analysis. Molecular Biology and Biotechnology Center, University of Alberta.
Weber JL and May P (1989). Abundant class of human DNA polymorphisms which can be typed using the polymerase chain reaction. Am J Hum Gene 44:388-396.