Genomic resources for the conservation and management
of the harpy eagle (
Harpia harpyja
, Falconiformes, Accipitridae)
Aureo Banhos
1, Tomas Hrbek
1,2, Waleska Gravena
1, Tânia Sanaiotti
3and Izeni P. Farias
1 1Laboratório de Evolução e Genética Animal, Instituto de Ciências Biológicas,
Universidade Federal do Amazonas, Manaus, AM, Brazil.
2
Department of Biology, University of Puerto Rico, Río Piedras, San Juan, Puerto Rico.
3Departamento de Ecologia, Instituto Nacional de Pesquisas da Amazônia,
Manaus, AM, Brazil.
Abstract
We report the characterization and optimization of 45 heterologous microsatellite loci, and the development of a new set of molecular sex markers for the conservation and management of the Neotropical harpy eagle (Harpia harpyja L. 1758). Of the 45 microsatellites tested, 24 were polymorphic, six monomorphic, 10 uncharacterizable due to multiple bands and five did not amplify. The observed gene diversity of the analyzed sample ofH. harpyja was low and similar to that of other threatened Falconiformes. While a high proportion of the microsatellite markers were highly variable, individuals ofH. harpyja could be differentiated by a joint analysis of just three (p = 2.79 x 10⁻⁴
) or four markers (p = 2.89 x 10⁻⁵
). Paternity could be rejected with 95.23% and 97.83% probabilities using the same three and four markers, respectively. The sex determination markers easily and consistently differentiated males from females even with highly degraded DNA extracted from naturally shed feathers. The markers reported in this study potentially provide an excellent set of molecular tools for the conservation and management of wild and captiveH. harpyja and they may also prove useful for the enigmatic Neotropical crested eagle (Morphnus guianensis Daudin 1800).
Key words:conservation genetics,Harpia harpyja, microsatellites, raptors, sex markers. Received: March 16, 2007; Accepted: June 11, 2007.
Introduction
The Neotropical harpy eagle (Harpia harpyja L.
1758, Falconiformes, Accipitridae) is the largest eagle in the Americas and is considered the most powerful bird of prey in the world (Collar, 1989; Sick, 1997). This species inhabits the upper stratum of New World forests from southern Mexico to northeastern Argentina but is compara-tively rare throughout its distribution. The main threats to the conservation of H. harpyja is habitat fragmentation,
hunting and trade in live birds (Vargas Get al., 2006). The
slow reproductive rate and low population densities ofH. harpyjamake these threats significant throughout its
distri-bution.Harpia harpyjais classified as near threatened by
the International Union for the Conservation of Nature (IUCN) and is cited in Appendix I of the Convention on the International Trade of Threatened Species of Fauna and Flora (CITES). While active conservation programs exist
in several countries where this eagle occurs, implementa-tion of conservaimplementa-tion programs is challenging and conserva-tion success is difficult to assess due to the difficulty of obtaining ecological data. Molecular markers often allow indirect estimates of many ecologically important parame-ters, and if available would greatly facilitate the conserva-tion and management ofH. harpyja.
The knowledge of biology of threatened species is of indispensable interest for conservation. However, as in the case for many threatened raptors,H. harpyjais difficult to
study because adults are very difficult to capture and mark, individual birds may move over great distances and while slight size dimorphism exists, there is no sexual dimor-phism in plumage making males and females difficult-to-distinguish. However, molecular tools may overcome many of these challenges (e.g. Frankham et al., 2002;
Allendorf and Luikart, 2006), especially since such meth-ods can use non-invasive sampling techniques based on DNA extraction from feathers (e.g. Pearce et al., 1997;
Segelbacher, 2002; Horváthet al., 2005; Rudnick et al.,
2005). Understanding the genetic characteristics of a spe-cies is also extremely important for the success ofin situ Send correspondence to Izeni Pires Farias. Laboratório de
Evolu-ção e Genética Animal, Instituto de Ciências Biológicas, Univer-sidade Federal do Amazonas, 69077-000 Manaus, AM, Brazil. E-mail: [email protected].
andex situconservation programs because this information
allows definition of management units needed to minimize the loss of genetic diversity while at the same time preserv-ing the existpreserv-ing genetic structure of the species (Haig, 1998; Hedrick, 2001).
Of the various types of molecular markers used today, microsatellites have many positive attributes, including hypervariability, co-dominance, abundance and tolerance to variation in DNA quality and quantity (Selkoe and To-onen, 2006). Additionally, due to our reasonably good un-derstanding of molecular evolution and the development of robust computational methods, microsatellites are well-suited to answer questions related to effective population size, population structure, migration and colonization rates, and reproductive system, thus providing essential data for conservation. The need to characterize species-specific loci by expensive and laborious isolation and characterization procedures is the primary limitation to the more wide-spread use of microsatellites. Although mutations in the flanking regions of microsatellite loci may prevent amplifi-cation, many studies have shown that microsatellites iso-lated from one species can amplify homologous products in related species (e.g.Martínez-Cruzet al., 2002; Busch et al., 2005), a characteristic known as transferability or
cross-species amplification (Selkoe and Toonen, 2006). Other important molecular markers for conservation are those for sex determination, mainly for species that do not possess apparent sexual dimorphism, whether at the ju-venile or adult stage, as is the case of forH. harpyja. In all
neognath birds, the female is the heterogametic (WZ) and the male homogametic (ZZ) sex. Molecular methods of sex determination are based on the amplification of paralogous copies of the Chromo helicase DNA binding protein gene (CHD1) present on chromosomes W and Z using mismatch
primers,i.e.while the forward primer amplifiesCHD1
cop-ies on both W and Z chromosomes, the reverse primers are designed to anneal to either W or Z chromosome and am-plify different sized products. Molecular sex markers developed for birds (Griffithset al., 1998) have limited
ap-plicability in Falconiformes due to the fact that the differen-tiation of amplified CHD1W and CHD1Z fragments is
unreliable because both fragments are large and similar in size. Recent publication by Itoet al.(2003) presents a
solu-tion that appears to be applicable to all Falconiformes by in-creasing the size difference of theCHD1W and CHD1Z
amplified fragments. However, the relatively large size of these fragments makes PCR amplification from forensic samples difficult.
In this study we present the results of an amplification test of 45 microsatellite loci, isolated and characterized by other authors in various other accipitrid raptors, the charac-terization and optimization of 30 of these microsatellites and the development of a new set of molecular sex markers forH. harpyja. In addition, we also present a preliminary
characterization of genetic diversity of H. harpyja and
comment on the usefulness of a subset of these microsatellite markers for assessing the joint probability of the identity of any two samples and of paternity exclusion. We conclude that a carefully chosen subset of microsatellite markers optimized for multiplexing and the newly developed molecular sex markers provide highly valuable and simple-to-use set of molecular tools to assist in the formulation of conservation and management strate-gies for this threatened raptor.
Material and Methods
Specimens
Molted feathers were collected from individual harpy eagle (Harpia harpyja L. 1758 Falconiformes,
Accipitridae) specimens from three main Brazilian biomes: the Amazonian rainforest, the Atlantic rainforest and the Pantanal wetland. Some feather samples were collected from nests in the wild while other samples came from zoos and museums; however, in all cases samples of feather originated from wild-born individuals (Table 1).
Microsatellite loci
There are approximately 100 microsatellite loci iso-lated and characterized for Falconiformes, some of these being published after we commenced our study. For testing inH. harpyjawe chose 45 based in the following criteria: 1)
loci were isolated from related falconiform species, 2) loci had at least five alleles in the species for which they were developed, and had preferentially a perfect repeat motif, and 3) when cross-species amplification tests were made, the loci were polymorphic in phylogenetically distantly re-lated taxa. The tested microsatellite loci were taken from six microsatellite panels described by the following au-thors: Nesje and Røed (2000); Martínez-Cruzet al.(2002);
Busch et al. (2005); Hailer et al. (2005); Johnson et al.
(2005); Miraet al.(2005); a complete list of loci is
pre-sented in Table 2. Preliminary screening was done using two captive H. harpyja specimens for which sufficient
quantities of good quality DNA could be extracted. For this preliminary screening and for characterization of speci-mens in Table 1, total genomic DNA was extracted from a blood clot in the superior umbilicus (a small opening at the proximal tip of the calamus or quill) as recommended by Horváthet al., (2005) using the Qiagen® DNA extraction
kit (Valencia, CA, USA). Polymerase chain reactions (PCR) were carried out a total volume of 10µL consisting of 1µL of sample DNA (~10 ng), 1µL each of forward and
reverse primer (2 µM), 1 µL of 10X Buffer (200 mM
Tris-KCl, pH 8.5), 0.7µL of MgCl2(25 mM), 0.8µL of
dNTP (10 mM), 0.2µLTaqDNA polymerase (5 units/µL;
Biotools, Spain) and 4.3µL of water. All primers were
MD, USA (www.fermentas.com). Amplification consisted of 35 cycles of denaturation at 93 °C for 15 s, annealing be-tween 50 °C and 55 °C for 30 s and extension at 68 °C for 30 s, and a final seven minute extension at 68 °C was added after the last cycle. For the microsatellite loci that amplified we re-synthesized the forward primer by adding an M13 tail to its 5’ end to allow for dynamic fluorescent labeling with FAM-6 labeled M13 primer following the protocol de-scribed by Schuelke (2000). Genotyping PCR was per-formed in a total volume of 10 µL containing 1 µL of reverse primer (0.2µM), 0.5µL of M13 labeled forward
primer (0.2 µM), 0.5 µL of FAM-6 labeled M13 primer
(0.2µM) and the other reagents described above.
Amplifi-cation was carried out in a Hybaid PCR thermocycler (Thermo Scientific, USA) and had two main cycling steps (modified from Schuelke, 2000), consisting of an initial de-naturation step of 1 min at 93 °C followed by 30 cycles of 30 s at 93 °C, 30 s at 55 °C and 30 s at 68 °C then 20 cycles of 30 s at 93 °C, 30 s at 50 °C, and 30 s at 68 °C. The reac-tion was completed by a final extension for 30 min at 68 °C to minimize stutter due to non-specific incorporation of ad-enine (Brownsteinet al., 1996). The PCR product was
visu-alized using a MegaBACE1000 (GE Healthcare, United Kingdom) and analyzed with the software Fragment Pro-filer v1.2 (GE Healthcare, United Kingdom) following the
manufacturer’s recommendations. For each microsatellite marker we genotyped 10 to 17 (average 15) specimens of
H. harpyjaoriginating from all three main Brazilian biomes
(Table 1). The variable number of specimens analyzed per microsatellite locus was due to failures in genotyping and the limited quantity of DNA available for repeat analyses, a common problem with forensic samples such as naturally shed feathers (Segelbacher, 2002).
The characterization of each microsatellite locus was based on number of alleles and gene diversity (Nei, 1978), expected (HE) and observed (HO) heterozygosity (Weir,
1996), deviation from Hardy-Weinberg equilibrium (HWE) and linkage disequilibrium between all pairs of loci. All the analyses were performed using the program Arlequin v3.1 (Excoffier et al., 2005), with significance
levels for multiple tests being adjusted using the sequential Bonferroni correction (Rice, 1989). To evaluate the poten-tial use of the microsatellite loci for relatedness analyses, we also estimated the probability of paternity exclusion at an individual locus (QorPei), and the joint probability of
paternity exclusion at all loci (QCorPet) following Weir
(1996). Additionally, we estimated the probability of ge-netic identity at an individual locus (I) and the joint
proba-bility of genetic identity at all loci (IC) according to
Paetkauet al.(1995).
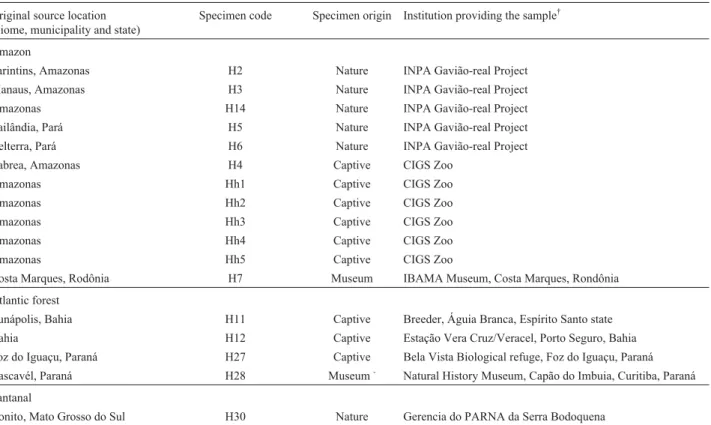
Table 1- Demographic information for the harpy eagles (Harpia harpyja) subjected to microsatellite primer characterization. All birds originated in the wild.
Original source location (biome, municipality and state)
Specimen code Specimen origin Institution providing the sample†
Amazon
Parintins, Amazonas H2 Nature INPA Gavião-real Project
Manaus, Amazonas H3 Nature INPA Gavião-real Project
Amazonas H14 Nature INPA Gavião-real Project
Tailândia, Pará H5 Nature INPA Gavião-real Project
Belterra, Pará H6 Nature INPA Gavião-real Project
Labrea, Amazonas H4 Captive CIGS Zoo
Amazonas Hh1 Captive CIGS Zoo
Amazonas Hh2 Captive CIGS Zoo
Amazonas Hh3 Captive CIGS Zoo
Amazonas Hh4 Captive CIGS Zoo
Amazonas Hh5 Captive CIGS Zoo
Costa Marques, Rodônia H7 Museum IBAMA Museum, Costa Marques, Rondônia
Atlantic forest
Eunápolis, Bahia H11 Captive Breeder, Águia Branca, Espírito Santo state
Bahia H12 Captive Estação Vera Cruz/Veracel, Porto Seguro, Bahia
Foz do Iguaçu, Paraná H27 Captive Bela Vista Biological refuge, Foz do Iguaçu, Paraná
Cascavél, Paraná H28 Museum- Natural History Museum, Capão do Imbuia, Curitiba, Paraná
Pantanal
Bonito, Mato Grosso do Sul H30 Nature Gerencia do PARNA da Serra Bodoquena
†INPA = Instituto Nacional de Pesquisas da Amazônia, Manaus, AM; CIGS = Centro Integrado de Guerra na Selva, Manaus, AM; IBAMA = Instituto
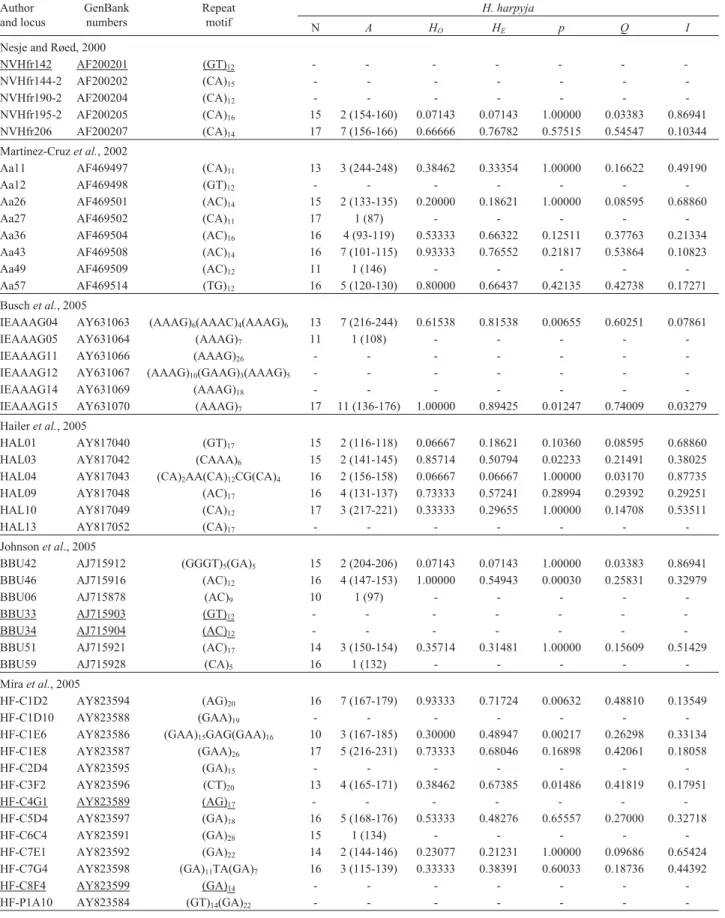
Table 2- Characterization of 45 microsatellite loci for the harpy eagle (Harpia harpyja) originally isolated from other raptor species by the authors cited. Loci which failed to amplify are underlined and a dash (-) indicates loci that failed to genotype. Table shows the following: number of eagles tested (N); number of alleles per locus, with the range of allele sizes in base pairs in parentheses (A); observed heterozygosity (HO); expected heterozygosity (HE);
significance of the difference betweenHOandHE(only the microsatellite BBU46 showed significant deviation after Bonferroni correction for multiple
comparisons) (p); probability of paternity exclusion (Q); and probability of genetic identity (I).
Author and locus
GenBank numbers
Repeat motif
H. harpyja
N A HO HE p Q I
Nesje and Røed, 2000
NVHfr142 AF200201 (GT)12 - - -
-NVHfr144-2 AF200202 (CA)15 - - -
-NVHfr190-2 AF200204 (CA)12 - - -
-NVHfr195-2 AF200205 (CA)16 15 2 (154-160) 0.07143 0.07143 1.00000 0.03383 0.86941
NVHfr206 AF200207 (CA)14 17 7 (156-166) 0.66666 0.76782 0.57515 0.54547 0.10344
Martínez-Cruzet al., 2002
Aa11 AF469497 (CA)11 13 3 (244-248) 0.38462 0.33354 1.00000 0.16622 0.49190
Aa12 AF469498 (GT)12 - - -
-Aa26 AF469501 (AC)14 15 2 (133-135) 0.20000 0.18621 1.00000 0.08595 0.68860
Aa27 AF469502 (CA)11 17 1 (87) - - - -
-Aa36 AF469504 (AC)16 16 4 (93-119) 0.53333 0.66322 0.12511 0.37763 0.21334
Aa43 AF469508 (AC)14 16 7 (101-115) 0.93333 0.76552 0.21817 0.53864 0.10823
Aa49 AF469509 (AC)12 11 1 (146) - - - -
-Aa57 AF469514 (TG)12 16 5 (120-130) 0.80000 0.66437 0.42135 0.42738 0.17271
Buschet al., 2005
IEAAAG04 AY631063 (AAAG)6(AAAC)4(AAAG)6 13 7 (216-244) 0.61538 0.81538 0.00655 0.60251 0.07861
IEAAAG05 AY631064 (AAAG)7 11 1 (108) - - - -
-IEAAAG11 AY631066 (AAAG)26 - - -
-IEAAAG12 AY631067 (AAAG)10(GAAG)3(AAAG)5 - - -
-IEAAAG14 AY631069 (AAAG)18 - - -
-IEAAAG15 AY631070 (AAAG)7 17 11 (136-176) 1.00000 0.89425 0.01247 0.74009 0.03279
Haileret al., 2005
HAL01 AY817040 (GT)17 15 2 (116-118) 0.06667 0.18621 0.10360 0.08595 0.68860
HAL03 AY817042 (CAAA)6 15 2 (141-145) 0.85714 0.50794 0.02233 0.21491 0.38025
HAL04 AY817043 (CA)2AA(CA)12CG(CA)4 16 2 (156-158) 0.06667 0.06667 1.00000 0.03170 0.87735
HAL09 AY817048 (AC)17 16 4 (131-137) 0.73333 0.57241 0.28994 0.29392 0.29251
HAL10 AY817049 (CA)12 17 3 (217-221) 0.33333 0.29655 1.00000 0.14708 0.53511
HAL13 AY817052 (CA)17 - - -
-Johnsonet al., 2005
BBU42 AJ715912 (GGGT)5(GA)5 15 2 (204-206) 0.07143 0.07143 1.00000 0.03383 0.86941
BBU46 AJ715916 (AC)12 16 4 (147-153) 1.00000 0.54943 0.00030 0.25831 0.32979
BBU06 AJ715878 (AC)9 10 1 (97) - - - -
-BBU33 AJ715903 (GT)12 - - -
-BBU34 AJ715904 (AC)12 - - -
-BBU51 AJ715921 (AC)17 14 3 (150-154) 0.35714 0.31481 1.00000 0.15609 0.51429
BBU59 AJ715928 (CA)5 16 1 (132) - - - -
-Miraet al., 2005
HF-C1D2 AY823594 (AG)20 16 7 (167-179) 0.93333 0.71724 0.00632 0.48810 0.13549
HF-C1D10 AY823588 (GAA)19 - - -
-HF-C1E6 AY823586 (GAA)15GAG(GAA)16 10 3 (167-185) 0.30000 0.48947 0.00217 0.26298 0.33134
HF-C1E8 AY823587 (GAA)26 17 5 (216-231) 0.73333 0.68046 0.16898 0.42061 0.18058
HF-C2D4 AY823595 (GA)15 - - -
-HF-C3F2 AY823596 (CT)20 13 4 (165-171) 0.38462 0.67385 0.01486 0.41819 0.17951
HF-C4G1 AY823589 (AG)17 - - -
-HF-C5D4 AY823597 (GA)18 16 5 (168-176) 0.53333 0.48276 0.65557 0.27000 0.32718
HF-C6C4 AY823591 (GA)28 15 1 (134) - - - -
-HF-C7E1 AY823592 (GA)22 14 2 (144-146) 0.23077 0.21231 1.00000 0.09686 0.65424
HF-C7G4 AY823598 (GA)11TA(GA)7 16 3 (115-139) 0.33333 0.38391 0.60033 0.18736 0.44392
HF-C8F4 AY823599 (GA)14 - - -
-Sex determination markers inH. harpyja
For the characterization of sex markers we used the primers developed by Ito et al. (2003). Tests were
per-formed on 10 specimens ofH. harpyjacollected from
mu-seums, zoos and nature (Table 3), of which two samples were of know sex while the other samples were of unknown sex. The PCR reactions for the sex markers were carried out in a total volume of 25 µL containing 1 µL of DNA (~10 ng), 2.5µL of NP primer (2µM) 1.3µL of MP primer
(2µM), 1.3µL of P2 primer (2µM), 2.5µL of 10X Buffer
(200 mM Tris-KCl, pH 8.5), 2.5µL of MgCl2(25 mM),
2.0µL of dNTP (10 mM), 0.2µLTaq DNA polymerase
(5 units/µL; Biotools, Spain) and 11.8µL of deionized
wa-ter. All primers were purchased from IDT, Coralville, IA, USA (www.idtdna.com), and dNTPs were purchased from Fermentas, Glen Burnie, MD, USA (www.fermentas.com). The thermocycling profile consisted of 1 min denaturation at 93 °C, followed by 35 cycles of denaturation at 93 °C for 10 s, annealing at 52 °C for 35 s and extension at 68 °C for 30 s. The reaction was completed by a final extension for seven minutes at 68 °C. The PCR products were separated on a 3% (w/v) agarose gel. To assess the consistency of the results we repeated each PCR three times for each speci-men. TheCDH1ZandCDH1Wgene fragments of a number
of the specimens did not amplify, most likely due to a high degree of DNA degradation; therefore we designed two primers, CHD1Wr (5’-GCTGATCTGGTTTCAGAT TAA-3’) and CHD1Zr (5’-AGTCACTATCAGATCCAG AG-3’) as substitutes for primers MP (Itoet al., 2003) and
P2 (Griffithset al., 1998) respectively (Table 4). Our new
primer set reduced the size of amplicons by nearly 100 bp and using this strategy we were able to sex the remaining specimens of unknown sex.
Results and Discussion
Transferability and characterization of the microsatellites inH. harpyja
Of the 45 microsatellite loci tested in our sample ofH. harpyja, 40 amplified successfully but only 30 could be genotyped unambiguously. All 30 loci amplified at 55 °C and produced unambiguous genotypes, thus all PCR reac-tions were standardized to this annealing temperature. A to-tal of 24 microsatellites loci were polymorphic and the number of alleles per locus ranged from 2 to 11 (Table 4). After sequential Bonferroni correction for multiple com-parisons (Rice, 1989), a significant departure from HWE was observed only in the locus BBU46. This and six addi-tional loci that showed HWE deviations before Bonforroni
Table 3- Harpy eagle individuals (Harpia harpyja) subjected in the sex-determination.
Specimen code Specimen origin Institution providing the sample† Sex
1 = H8 Captive UFMT Zoo female
2 = H121 Captive Bosque Municipal de São José do Rio Preto, São Paulo female
3 = H56* Museum- INPA Coleção de Aves male
4 = H57* Museum— INPA Coleção de Aves female
5 = H71 Captive Foz Tropicana Parque das Aves, Foz do Iguaçu, Paraná female
6 = H75 Captive Bioparque Amazônia Crocodilo Safari Zoo, Belém, Pará female
7 = H76 Captive Bioparque Amazônia Crocodilo Safari Zoo, Belém, Pará male
8 = H79 Captive Parque Zoobotânico do Museu Paraense Emilio Goeldi, Belém, Pará female
9 = H96 Captive Criadouro Conservacionista Sítio Tibagi, Serra Guaramiranga, Ceará female
10 = H120 Captive UFMT Zoo male
†INPA = Instituto Nacional de Pesquisas da Amazônia, Manaus, AM; UFMT = Universidade Federal do Mato Grosso, Cuiabá, MT.
*Control individuals of known sex.-Accession number INPA 629.—Accession number INPA 829.
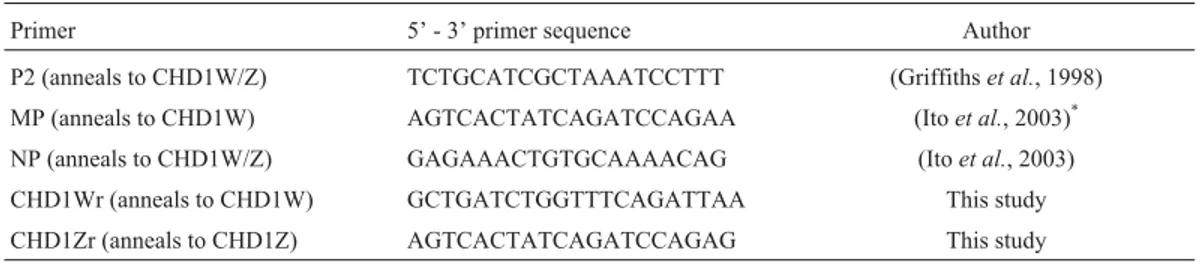
Table 4- Primers used for molecular sex determination of the harpy eagle (Harpia harpyja).
Primer 5’ - 3’ primer sequence Author
P2 (anneals to CHD1W/Z) TCTGCATCGCTAAATCCTTT (Griffithset al., 1998)
MP (anneals to CHD1W) AGTCACTATCAGATCCAGAA (Itoet al., 2003)*
NP (anneals to CHD1W/Z) GAGAAACTGTGCAAAACAG (Itoet al., 2003)
CHD1Wr (anneals to CHD1W) GCTGATCTGGTTTCAGATTAA This study
CHD1Zr (anneals to CHD1Z) AGTCACTATCAGATCCAGAG This study
correction were re-scored from original electrophoregrams to eliminate potential scoring biases. The observed and ex-pected gene diversity (Nei, 1978) over all loci was 0.50580 and 0.47242, respectively. We found less than 5% of pairs with significant linkage disequilibrium across all pairs of loci. Indexes of joint probability of paternity exclusion (p = 0.99596) and genetic identity (p = 1.04221 x 10⁻⁸) were
highly robust.
The high rate of cross-species amplification (40 out of 45 loci) and characterizability (30 out of 45 loci) was attrib-utable to our initial choice of loci. Five of the six micro-satellite panels were developed for other Accipitrid species, the same family as theH. harpyja. The transferability of
microsatellite primers between species is directly related to the genetic divergence of the species concerned; the greater the genetic divergence, the greater the probability of muta-tions at priming sites, and thus lower the probability of suc-cessful annealing of primers. Although we chose only polymorphic loci, the rates of polymorphism characterized forH. harpyjadid not reflect the polymorphism observed in
the original studies (reg. R = 0.035, p = 0.402). Levels of polymorphism depend on the sample analyzed, and there is also no expectation of transferability of the degree of poly-morphism (Ellegrenet al., 1995).
The 24 polymorphic loci appeared to present an ex-cellent panel for populational analyses ofH. harpyja. They
were also robust markers for estimating kinship and pater-nity relations (Weir, 1996) and to identify individuals (Paetkau and Strobeck, 1995). However, statistically sig-nificant levels of paternity exclusion and genetic identity can be obtained with a panel of only three or four loci. Pa-ternity can be excluded at the p = 0.95233 and genetic iden-tity rejected at the p = 0.00028 levels using just the loci IEAAAG15, IEAAAG04 and Aa43. The addition of the NVHfr206 locus would increase these probabilities to p = 0.97834 and p = 0.00003 levels, respectively. The allelic classes produced by the loci IEAAAG15, IEAAAG04 and Aa43 are non-overlapping, and thus con-ducive to multiplexing even with one dye set and dynamic fluorescent labeling of alleles (Schuelke, 2000). Inclusion of the locus NVHfr206 would require the use of a second fluorescent dye since its allele sizes overlap with those of the locus IEAAAG15. Dynamic multiplexing with the first three loci would result in a statistically significant estimate of paternity exclusion and/or genetic identity at less than US$ 1 per sample analyzed.
Genetic diversity ofH. harpyja
For the IUCN near-threatenedH. harpyjathe average HOcalculated by us was 0.506, similar to that for the
re-cently surveyed accipitrid species Aquila adalberti (the
Spanish imperial eagle;HO = 0.516) andAquila heliaca
(the eastern imperial eagle;HO= 0.563) listed as vulnerable
by IUCN (Martinez-Cruzet al., 2004). Genetic diversity is
necessary for populations and species to adapt to
environ-mental change and reflects their evolutionary potential (Frankhamet al., 2002), low genetic diversity therefore
be-ing viewed as an indirect measure of extinction threat. It may also be thatH. harpyjapresents the signature of a
ge-netic bottleneck. Garza and Williamson (2001) have dem-onstrated that for a population sample of microsatellite loci the mean ratio of the number of alleles to the range in allele size, theMparameter, can be used to detect reductions in
population size. The average value ofMfor the 24
micro-satellite loci was 0.84, a value significantly lower than that obtained under simulation of a pre-bottleneck population size (p = 0.026 using the genetic parameterθof 2.24).θis a
summary statistic representing four times the product of the effective population size and the mutation rate (Hartl and Clark, 1997). We derivedθfrom estimated census sizes of
104to 105harpy eagle individuals (Ferguson-Lee, 2001;
Vargas Get al., 2006) assuming that the effective number
of individuals is equivalent to 1/10 the census size (Fran-khamet al., 2002), and that microsatellite mutation rate (µ)
estimates range from 2.5 x 10⁻³to 5.6 x 10⁻⁴(
e.g.Dallas,
1992; Weber and Wong, 1993; Brinkmann et al., 1998;
Sajantilaet al., 1999; Kayser and Sajantila, 2001; Hrbeket al., 2006). Using the most conservative parameter
esti-mates (θ= 2.24,µ= 5.6 x 10⁻⁴) a value ofM= 0.84 reflects a
significant reduction in population size (p = 0.026). When the parameter θ was estimated directly from the
micro-satellite data (θ= 1.50), theM value was not significant
(p = 0.101). However, theθcalculated from the data itself is necessarily a lower bound estimate ifH. harpyjashows any population structure. Although there is a possibility thatH. harpyjahas experienced a genetic bottleneck, a more defin-itive inference can only be made with more extensive sam-pling, and the determination of any existing population structuring.
Although we cannot extend the perceived threat to the entire distribution of H. harpyja, it seems reasonable to
extrapolate low genetic diversity and associated threat po-tential to other Neotropical regions which are often anthro-pogenically impacted and near the periphery of the natural distribution of this raptor. Within Brazil,H. harpyja
pos-sesses its core and broadest area of distribution and, at least within the Amazon basin, it appears to have suffered lim-ited anthropogenic impact. Yet, the genetic diversity ofH. harpyjais lower than that of other accipitrid raptors listed
by IUCN in categories which indicate a greater risk of ex-tinction. Furthermore,H. harpyjais not even on the official list of threatened species of the Brazilian Environmental Agency (Instituto Brasileiro do Meio Ambiente e dos Recursos Naturais Renováveis - IBAMA). Although our preliminary data clearly bring into question the current classification status by IUCN and IBAMA, in order to facil-itate adequate management and conservation policies, a denser sampling throughout the distribution ofH. harpyja
over geographic landscape, how genetically diverse isH. harpyjathroughout the areas of its distribution, and if it has
suffered a genetic bottleneck.
Molecular sex markers
Using the primers from Itoet al.(2003) we were able
to confirm the sex of the two H. harpyja specimens of
known sex, a male (specimen 3) and a female (specimen 4) (Figure 1). The PCR pattern of males is characterized by a single band and that of females by two bands, with 100 base pairs difference between the two bands. The other eightH. harpyjaspecimens of differing DNA qualities and
concen-trations were characterized as two males (specimens 7 and 10) and six females (specimens 1, 2, 5, 6, 8 and 9). Molecu-lar sex determination was repeated three times, each time resulting in the same pattern. The primer set of Itoet al.
(2003) minimizes false positive identifications since the fe-male-specificCHD1Wgene product is the smaller product.
Theoretically even in the case when highly degraded DNA is used and only the smallerCHD1Wgene fragment is
am-plified, this fragment will 100 bp smaller than theCHD1Z
gene fragment and therefore this specimen will be easily identifiable as a female. However, some of our specimens showed no amplification of the molecular sex markers, most probably due to the very high levels of DNA degrada-tion common in feathers, which apparently do not allow amplification of the ~300 to 400 bp fragments generated by the markers from Itoet al.(2003). Therefore we designed
primers CHD1Wr and CHD1Zr to substitutes for primers MP (Itoet al., 2003) and P2 (Griffithset al., 1998),
respec-tively in our PCR reactions. The new primer combination NP/CHD1Wr produced a 250 bp fragment while NP/CHD1Zr produced a 300 bp fragment. Primers to ob-tain even shorter products could not be designed, since the regions amplified span a size variable intron lacking suit-ably conserved regions. With these new primer combina-tions we were able to sex our remaining specimens.
Molecular tools for the conservation of the harpy eagle
We have characterized a set of molecular tools useful forin situandex situconservation and management ofH. harpyja. The loci IEAAAG15, IEAAAG04 and Aa43
to-gether with sex markers provide powerful and cost effec-tive tools for identifying best potential mates in capeffec-tive breeding programs. The correct identification of the sex of individual birds in conservation programs, currently a diffi-cult invasive procedure, is clearly fundamental for the suc-cess of any breeding program. If the goal of the breeding program is to minimize pedigree inbreeding and maximize genetic diversity, microsatellite markers in addition to the three presented above will need to be used. Captive breed-ing decisions must be made in light of any potential natural population genetic structuring which, although at present unknown, will be easily determinable with the presented set
of 24 polymorphic microsatellite markers once sufficient sampling data are obtained. The existence, or absence, of population structure is also critical forex situmanagement and reintroduction programs. With few exceptions,
H. harpyjais effectively extinct in the Brazilian Atlantic
rainforest and IBAMA has approved a plan presented by the CRAX Society (Sociedade de Pesquisa do Manejo e Reprodução da Fauna Silvestre, MG, Brazil) to reintroduce
H. harpyjainto the Atlantic Rainforest from a captive pop-ulation maintained and bred by the CRAX Society. The captive population consists of birds from various biomes, confiscated animals of unknown origin and the hybrid off-spring of these animals (Nemésioet al., 2000). The
pro-gram is currently stalled as specific areas of introduction and financial sponsors have yet to be identified. Even more critically, no data currently exist on whetherH. harpyja
from the Amazon rainforest and the Atlantic rainforest form one large population and are genetically and demo-graphically interchangeable, or if they represent two differ-entiated populations. The introduction of inappropriate birds could have serious negative conservation conse-quences, potentially even leading to the extinction of the remnant Atlantic rainforest populations of H. harpyja
(Frankhamet al., 2002; Hedrick, 2005; Allendorf and
Lui-kart, 2006). If, however, introductions are scientifically justified, they would be of great benefit in helping to rescue the highly threatened Atlantic rainforest population. There-fore a molecular study of representative specimens from the Amazon and Atlantic rainforests is urgently needed, and the markers reported in this study will greatly facilitate these conservation efforts. Last, but not least, ifH. harpyja
shows a signal of strong population structuring, these microsatellites could further be used to identify the origin of seized specimens from illegal animal traders and clan-destine breeding units. In Brazil, for instance, confiscated specimens ofH. harpyjaare generally destined for zoos and legalized breeding units (Efeet al., 2006), the principal
rea-son for this bureaucratic decision being the lack of
edge of the region in which the individuals were clandes-tinely captured. The assignment of confiscated specimens to their regions of origin could be accomplished with the use of molecular methods, and the confiscated birds could be repatriated to their areas of origin. However, in the case thatH. harpyjacomprises a panmitic population there will
be no restrictions on seized specimens being released in any region within the distribution ofH. harpyjaand these
speci-mens may be used to augment the severely depleted Atlan-tic rainforest population. The caveat of these inferences is that they are based on neutral genetic markers. It is possible thatH. harpyjafrom different areas of its distribution may
show adaptive differences even if differentiation among re-gions is not observed at the level of neutral genetic markers, and therefore management and conservation strategies should not solely rely on conclusions drawn from puta-tively neutral microsatellite markers. In spite of this cau-tionary note, we believe that the markers reported in this study will prove to be excellent tools for the conservation and management ofH. harpyjathroughout its geographic
distribution, and we also presume that they can be utilized for studies of other raptor species such as the enigmatic spe-cies of the genusMorphnus.
Acknowledgments
We thank all the people and institutions that provided feather samples for this study: IBAMA Costa Marques, Foz Tropicana Parque das Aves, Crocodilo Safari Zoo, UFMT Zoo, MPEG Parque Zoobotanico, Bosque Municipal de São José do Rio Preto, Criadouro Sítio Tibagi, Museu de História Natural Capão da Imbuia, Refúgio Biológico Bela Vista -Itaipu Binacional, Estação Vera Cruz - Veracel, Zoológico do Centro Integrado de Guerra na Selva (Zoológico CIGS), and Gerência do Parque Nacional Serra da Bodoquena. We also thank members of the Laboratório de Evolução e Gené-tica Animal (LEGAL UFAM), Projeto Gavião-real of INPA, Coordenação do Curso de Genética, Evolução e Biologia Evolutiva (INPA) and Coordenação de Ecologia (INPA) for help in the laboratory, the field and for discussion. We thank two anonymous reviewers for improving the manuscript. IBAMA (#120/2005 - CGFU/LIC) and CGEN (#088/2005) provided collection and genetic assessment permits, respec-tively. Financial support for this study was provided by grants from Fundação O Boticário de Proteção à Natureza, Cleveland Zoological Society, Programa Bolsa de Estudos para Conservação da Amazônia (Programa BECA), and Fundação de Amparo a Pesquisa da Amazônia (FAPEAM). This study forms a portion of a Ph.D. dissertation of Aureo Banhos who has a scholarship from the Brazilian Coordena-ção de Aperfeiçoamento Pessoal de Nível Superior.
References
Allendorf FW and Luikart G (2006) Conservation and the Genetics of Populations. Blackwell Publishing, New York, 644 pp.
Brinkmann B, Klintschar M, Neuhuber F, Hühne J and Rolf B (1998) Mutation rate in human microsatellites: Influence of the structure and length of the tandem repeat. J Human Genet 62:1408-1415.
Brownstein MJ, Carpten JD and Smith JR (1996) Modulation of non-templated nucleotide addition by Taq DNA polymer-ase: Primer modifications that facilitate genotyping. Bio-techniques 20:1004-1010.
Busch JD, Katzner TE, Bragin E and Keim P (2005) Tetra-nucleotide microsatellites for aquila and haliaeetus eagles. Mol Ecol Notes 5:39-41.
Collar NJ (1989) Harpy eagle. World Birdswatch 11:5.
Dallas JF (1992) Estimation of microsatellite mutation rates in re-combinant inbred strains of mouse. Mam Genome 3:452-456.
Efe MA, Martins-Ferreira C, Olmos F, Mohr LV and Silveira LF (2006) Diretrizes da Sociedade Brasileira de Ornitologia para a destinação de aves provenientes do tráfico e cativeiro. Rev Brasil Ornitol 14:67-72.
Ellegren H, Primmer CR and Sheldon B (1995) Microsatellite evolution: Directionality or bias in locus selection? Nat Genet 11:60-62.
Excoffier L, Laval G and Schneider S (2005) Arlequin ver. 3.1: An integrated software package for population genetics data analysis. Evol Bioinf Online 1:47-50.
Ferguson-Lee J (2001) Raptors of the World. Houghton Mifflin, Boston, 872 pp.
Frankham R, Ballou JR and Briscoe DA (2002) Introduction to Conservation Genetics. Cambridge University Press, Cam-bridge, 640 pp.
Garza JC and Williamson EG (2001) Detection of reduction in population size using data from microsatellite loci. Mol Ecol 10:305-318.
Griffiths RC, Double MC, Orr K and Dawson RJG (1998) A DNA test to sex most birds. Mol Ecol 7:1071-1075.
Haig SM (1998) Molecular contributions to conservation. Ecol-ogy 79:413-425.
Hailer F, Gautschi B and Helander B (2005) Development and multiplex PCR amplification of novel microsatellite mark-ers in the White-tailed Sea Eagle, Haliaeetus albicilla
(Aves, Falconiformes, Accipitridae). Mol Ecol Notes 5:938-940.
Hartl DL and Clark AG (1997) Principles of Population Genetics. 3rd ed. Sinauer Associates, Sunderland, 542 pp.
Hedrick PW (2001) Conservation genetics: Where are we now? Trends Ecol Evol 16:629-636.
Hedrick PW (2005) ‘Genetic restoration’: A more comprehensive perspective than ‘genetic rescue’. Trends Ecol Evol 20:109. Horváth MB, Martínez-Cruz B, Negro JJ, Kalmár L and Godoy
JA (2005) An overlooked DNA source for non-invasive ge-netic analysis in birds. J Avian Biol 36:84-88.
Hrbek T, de Brito RA, Wang B, Pletscher LS and Cheverud JM (2006) Genetic characterization of a new set of recombinant inbred lines (LGXSM) formed from the intercross of SM/J and LG/J inbred mouse strains. Mam Genome 17:417-429. Ito H, Sudo-Yamaji A, Abe M, Murase T and Tsubota T (2003)
Sex identification by alternative polymerase chain reaction methods in falconiformes. Zool Sci 20:339-344.
Johnson PCD, Fowlie MK and Amos W (2005) Isolation of microsatellite loci from the common buzzard,Buteo buteo
Kayser M and Sajantila A (2001) Mutations at Y-STR loci: Impli-cations for paternity testing and forensic analysis. Forensic Sci Int 118:116-121.
Martínez-Cruz B, David VA, Godoy JA, Negro JJ, O’Brien SJ and Johnson WE (2002) Eighteen polymorphic microsatellite markers for the highly endangered Spanish imperial eagle (Aquila adalberti) and related species. Mol Ecol Notes 2:323-326.
Martinez-Cruz B, Godoy JA and Negro JJ (2004) Population ge-netics after fragmentation: The case of the endangered Span-ish imperial eagle (Aquila adalberti). Mol Ecol
13:2243-2255.
Mira S, Wolff K and Cancela ML (2005) Isolation and character-ization of microsatellite markers in Bonelli’s eagle (Hieraaetus fasciatus). Mol Ecol Notes 5:493-495.
Nei M (1978) Estimation of average heterozygosity and genetic distance from a small number of individuals. Genetics 89:583-590.
Nemésio A, Machado AR and Andrade MA (2000) Reprodução da hápia (Harpia hapyja) em cativeiro. Aves 1:34-35.
Nesje M and Røed KH (2000) Microsatellite DNA markers from the gyrfalcon (Falco rusticolus) and their use in other raptor species. Mol Ecol 9:1438-1440.
Paetkau D, Calvert W, Stirling I and Strobeck C (1995) Micro-satellite analysis of population structure in Canadian polar bears. Mol Ecol 4:347-354.
Paetkau D and Strobeck C (1995) The molecular basis and evolu-tionary history of a microsatellite null allele in bears. Mol Ecol 4:519-520.
Pearce JM, Fields RL and Scribner KT (1997) Nest materials as a source of genetic data for avian ecological studies. J Field Ornithol 68:471-481.
Rice WR (1989) Analyzing tables of statistical tests. Evolution 43:223-225.
Rudnick JA, Katzner TE, Bragin EA, Rhodes Jr. OE and DeWoody JA (2005) Using naturally shed feathers for indi-vidual identification, genetic parentage analyses, and popu-lation monitoring in an endangered Eastern imperial eagle (Aquila heliaca) population from Kazakhstan. Mol Ecol 14:2959-2967.
Sajantila A, Lukka M and Syvänen A-C (1999) Experimentally observed germline mutations at human micro- and mini-satellite loci. Eur J Hum Genet 7:263-266.
Schuelke M (2000) An economic method for the fluorescent la-beling of PCR fragments. Nat Biotech 18:233-234. Segelbacher G (2002) Noninvasive genetic analysis in birds:
Testing reliability of feather samples. Mol Ecol Notes 2:367-369.
Selkoe KA and Toonen RJ (2006) Microsatellites for ecologists: A practical guide to using and evaluating microsatellite markers. Ecol Lett 9:615-629.
Sick H (1997) Ornitologia Brasileira. Editora Nova Fronteira, Rio de Janeiro, 912 pp.
Vargas GJJ, Whitacre D, Mosquera R, Albuquerque J, Piana R, Thiollay J-M, Márquez C, Sánchez JE, López ML, Midence Set al.(2006) Estado y distribución actual del Águila Arpía (Harpia harpyja) en Centro y Sur América. Ornitol Neotrop
17:39-55.
Weber JL and Wong CC (1993) Mutation of human short tandem repeats. Hum Mol Genet 2:1123-1128.
Weir BS (1996) Genetic Data Analysis II: Methods for Discrete Population Genetic Data. Sinauer Associates, Sunderland, 445 pp.