Polymorphic heterologous microsatellite loci for population genetics studies
of the white-faced ibis
Plegadis chihi
(Vieillot, 1817) (Pelecaniformes,
Threskiornithidae)
Andiara Silos Moraes de Castro e Souza, Carolina Isabel Miño and Silvia Nassif Del Lama
Departamento de Genética e Evolução, Universidade Federal de São Carlos, São Carlos, SP, Brazil.
Abstract
We screened 44 heterologous microsatellites isolated in species of the families Threskiornithidae, Ciconiidae and Ardeidae for their use in a migratory waterbird, the white-faced ibisPlegadis chihi (Vieillot, 1817) (Threskiornithidae). Of the screened loci, 57% amplified successfully and 24% were polymorphic. In two breeding colonies from southern Brazil (N = 131) we detected 32 alleles (2-10 alleles/ locus). AverageHe over all loci and colonies was 0.55, and the combined probability of excluding false parents, 98%. There was no departure fromHWE in any loci or population. Eru6 and Eru4 loci were in non-random association in the Alvorada colony, and NnNF5 and Eru5 in both populations. AMOVA analysis indicated that most of the genetic diversity was contained within populations. Structure analysis suggested a single population, andFSTvalue showed weak genetic structuring (FST= 0.009, p = 0.05). The two popu-lations are apparently connected through gene-flow. The panel of six microsatellites optimized here was sufficiently informative for characterizing the genetic diversity and structure in these natural populations of the white-faced ibis. The information generated could be useful in future studies of genetic diversity, relatedness and the mating system in Plegadis chihi and related species.
Key words:cross-species amplification, genetic diversity, molecular markers, white-faced ibis, SSR.
Received: April 11, 2011; Accepted: November 21, 2011.
Introduction
The white-faced ibisPlegadis chihi(Vieillot, 1817) (Pelecaniformes, Threskiornithidae) is a migratory long-legged wading bird, with a long, downward-curved bill and attractive metallic bronze plumage (Dark-Smiley and Kei-nath, 2003). Occurring from North to South America, it pri-marily inhabits freshwater wetlands and marshes, and forages in flooded areas and agricultural fields (Ryder and Manry, 1994). Populations in the U.S.A. nest in marshes in the western region, and winter in large flocks in the western parts of the country and Mexico (Dark-Smiley and Keinath, 2003). In South America, it occurs in Brazil, Bolivia, Para-guay, UruPara-guay, Argentina and Chile. In Brazil, breeding takes place in colonies in coastal lagoons in Rio Grande do Sul State, in the southernmost part of the country (Petry and Fonseca, 2005). Although flocks engage in regional move-ments between the breeding and wintering periods, their specific migration routes remain unknown (Ryder and Manry, 1994).
So far, populations of the white-faced ibis have not been investigated as to genetic variability, an important
property of populations. Population-genetic parameters can be determined with the aid of molecular markers, such as microsatellites, also called simple sequence repeats (SSR). DNA sequences, two to six nucleotides long, repeated in tandem and widely dispersed in all eukaryotic genomes (Tautz, 1989). These codominant and highly polymorphic markers (Zane et al., 2002) have high mutation rates (10-2-10-6per meiotic event) (Liet al., 2002), the majority being selectively neutral (Selkoe and Toonen, 2006). Ac-cordingly, SSRs have become powerful tools for use in fo-rensic studies, kinship investigation, gene mapping, con-servation biology and population genetics (Zane et al., 2002).
In spite of their utility and wide application, there is still a major drawback in the use of microsatellites, since any study aimed at employing such markers requires the isolation of new loci and the development of new primers. However, the isolation of loci for a given species, besides being exceedingly labour-intensive, requires considerable funds, time and technical experience (Mukeshet al., 2011). Moreover, in avian species, the process of microsatellite isolation can pose an additional challenge, since micro-satellites are less abundant in avian genomes than in any other vertebrate group (Primmeret al., 1997). An alterna-tive cost-effecalterna-tive approach is the use of primers developed
Send correspondence to Andiara Silos Moraes de Castro e Souza. Departamento de Genética e Evolução, Universidade Federal de São Carlos, Rodovia Washington Luís km 235, 15365-905 São Carlos, SP, Brazil. E-mail: andiara.silos@gmail.com.
for closely related species, denominated cross-species microsatellite amplification or heterologous amplification, commonly applied in bird studies (Barbará et al., 2007; Mukeshet al., 2011). The success of this process depends on the degree of conservation of primer annealing sites among related species. High evolutionary divergence be-tween the species from which the microsatellite loci were originally isolated (the source species) and the species to which they will be applied (the target species) results in a low number of amplified loci (Primmeret al., 2005). A nec-essary first step in any study involving the use of hetero-logous markers is the screening and evaluation of their level of polymorphism in the target species.
Microsatellite loci constitute an adequate tool for esti-mating such important properties of populations, as genetic diversity, population structure, effective population size and gene flow, all useful in defining units for conservation (Haig et al., 2011). This lack of species-specific micro-satellite markers is one of the reasons why, in populations of the white-faced ibis, nuclear neutral genetic variability remains neglected. Thus, the goal in the present study was to identify and optimize heterologous microsatellite loci for population studies in this bird-species. Further information is provided on population genetic parameters and patterns of genetic structuring in samples of two breeding colonies located in the extreme geographic distribution of this spe-cies in south Brazil.
Material and Methods
Growing feathers were plucked from 44 nestlings (one per nest) in a breeding colony in Alvorada, Rio Grande do Sul State (RS), Brazil (S 29° 58’ 54”, W 51° 05’ 11”). Samples of growing feathers and muscle tissue were also taken from 87 nestlings (one per nest) of a breeding colony in Tapes, RS, Brazil (S 30° 41’ 12”, W 51° 23’ 53”). Genomic DNA was extracted from the feathers and muscle tissue as per the standard phenol/chloroform method (Sam-brooket al., 1989). Initial screening involved a panel of 44 heterologous microsatellite primers previously isolated in species belonging to the Threskiornithidae and Ardeidae families (order Pelecaniformes), viz.,Platalea ajaja (Saw-yer, 2002, PhD Thesis, Univ. North Texas), Eudocimus ruber (Santos et al., 2006), Nipponia nippon (Ji et al., 2004), Ardea herodias (McGuire and Noor, 2002) and
Bubulcus ibis(Campaniniet al., 2010); and to the Ciconi-idae family (order Ciconiiformes): Mycteria americana
(Tomasulo-Seccomandiet al., 2003).
Polymerase chain reactions (PCR) were carried out in 10-12mL reaction mixtures containing by 1 x PCR buffer (1 mM Tris-HCL, pH 8.4, 50 mM KCl), 1.5-2.5 mM MgCl2, 0.2 mM dNTPs (Amersham Biosciences), 0.5 U of
TaqDNA polymerase (Biotools B&M Labs) and 10-30 ng of template DNA. Except for loci isolated inP. ajajaand
M. americana(HEX-labeled), all the primers were
dynami-cally labeled with HEX, FAM or TET, using M13 method-ology (Schuelke, 2000). Reactions were carried out in an Eppendorf Mastercycler Gradient® (Eppendorf AG, Ham-burg, Germany) thermal cycler. The annealing tempera-tures described for the source species were initially tested, and then modified accordingly, in order to increase the probability of amplifying heterologous loci (Primmeret al., 2005). Successful amplification conditions are subse-quently described. For Aaju3 and Aaju5 loci (HEX-labeled), the PCR cycling parameters were: 1 min of initial denaturation at 94 °C, followed by 29 cycles of denatur-ation at 94 °C for 30 s, annealing at 53 °C for 35 s and ex-tension at 72 °C for 1 min, and a final exex-tension at 72 °C for 20 min. For the loci NnNF5, NnCE11, NnDD9 and NnHB12 (M13-labeled), conditions were: 4 min of initial denaturation at 94 °C, followed by 38 cycles of denatur-ation at 94 °C for 30 s, annealing at 57 °C for 1 min and ex-tension at 72 °C for 30 s, 8 cycles of 94 °C for 30 s, 45 s at 53 °C and extension at 72 °C for 45 s with a final extension at 72 °C for 20 min. Eru3, Eru4, Eru6 and Eru9 loci (M-13 labeled) were amplified with the following PCR parame-ters: 4 min of initial denaturation at 94 °C, followed by 35 cycles of 94 °C for 45 s, annealing at specific temperature for 35 s and extension at 72 °C for 1 min, 8 cycles of 94 °C for 30 s, 45 s at 53 °C and extension at 72 °C for 1 min with a final extension at 72 °C for 20 min. Eru2, Eru5, Eru7, Eru8 and Eru11 loci (M-13 labeled) were amplified as fol-lows: initial denaturation at 94 °C for 3 min, followed by 19 cycles at 94 °C for 45 s, annealing for 1 min at lo-cus-specific temperatures and 72 °C for 1 min, 8 cycles of 94 °C for 30 s, 45 s at 53 °C and extension at 72 °C for 1 min with a final extension at 72 °C for 20 min. For WS03, WS04 and WS09 loci (HEX-labeled), amplification condi-tions were: 5 min of initial denaturation at 94 °C, followed by 21 cycles of 94 °C for 30 s, 35 s at 55 °C and extension at 72 °C for 1 min, 8 cycles of 94 °C for 30 s, 45 s at 53 °C and extension at 72 °C for 1 min with a final extension at 72 °C for 20 min. For Bi1, Bi5, Bi7, Bi9, Bi10, Bi11 and Bi12 loci (M-13 labeled), PCR parameters were: initial denaturation at 5 min for 94 °C, followed by 20 cycles of 94 °C for 30 s, annealing for 1 min at locus-specific temperatures and ex-tension at 72 °C for 45 s, 15 cycles of 94 °C for 30 s, anneal-ing for 1 min at locus-specific temperatures and extension at 72 °C for 45 s, 12 cycles of 94 °C for 30 s, 45 s at 53 °C and extension at 72 °C for 45 s with a final extension at 72 °C for 20 min.
The Micro-Checker (Van Oosterhout et al., 2004) program was applied for assessing genotyping quality, the occurrence of null alleles, allelic dropout and stuttering. The number of alleles (A), expected (He) and observed (Ho) heterozygosity, exclusion probability (PE), identify probability (PI), Hardy-Weinberg equilibrium (HWE) per locus, and analysis of molecular variance (AMOVA) were estimated using GenAlex version 6.4 (Peakall and Smouse, 2006). Polymorphic information content (PIC) was com-puted in Cervus version 3.0 (Kalinowski et al., 2007). Allelic richness (Ra), genic diversity (DG, Nei, 1987), in-breeding coefficient (FIS) and population differentiation
(FST) were computed using Fstat version 2.9.3.2 (Goudet,
1995). Linkage disequilibrium (LD) between loci was com-puted in Arlequin version 3.5.1.2 (Excoffier and Lischer, 2010).P-values for all tests were corrected for multiple comparisons using the sequential Bonferroni procedure (Rice, 1989). The Genepop version 4.0.10 program (Rous-set, 2008) was applied for computing a multilocus estimate of the effective number of migrants (Nm) (Slatkin, 1985; Slatkin and Barton, 1989). Signals of reduction in popula-tion size were assayed with the Wilcoxon test (Luikartet al., 1998), as implemented in Bottleneck version 1.2.02 software (Cornuet and Luikart, 1996). Population structure for microsatellite variation was also examined using the Structure version 2.1 program (Pritchardet al., 2000). By this Bayesian clustering method, estimates are made of the number of genetic clusters (subpopulations;k) that best ex-plain the data, and thus, based on their genotypes and disre-garding sampling locations, assign individuals to subpopu-lations. Ten replicates of each run fork = 1 andk= 2 were carried out using the admixture model with a burn-in period of 100,000, and 10,000 MCMC reps after burn-in.
Results and Discussion
The 44 loci were initially screened in samples of 20 individuals from each population. Of the loci tested, 19 did not amplify, even after several trials: Aaju1, Aaju2 (P. ajaja), Eru10 (E. ruber), WS8, WS13, WS14, WS18, WS23, WS24 (M. americana), Ah211, Ah217, Ah320, Ah414 (A. herodias) and Bi2, Bi6, Bi8, Bi13, Bi14, Bi15 (B. ibis). Among the remaining 25 that did successfully am-plify, six were polymorphic in 40 individuals from the two breeding colonies (Table 1). The percentages of hetero-logous amplification (57%) and polymorphic loci (24%) were slightly lower than those reported in the literature for birds, i.e., average success in amplification from 67% (Dawsonet al., 2000) to 84% (Galbuseraet al., 2000), and polymorphic loci from 39% (Galbuseraet al., 2000) to 46% (Primmeret al., 1996). All the heterologous loci disclosed as polymorphic inP. chihihad already been originally iso-lated in species of the same family: Threskiornithidae. This is in accordance with the hypothesis that the proportion of polymorphic loci increases with decreasing phylogenetic
distance between the source and target species (Primmeret al., 2005).
At the level of families and orders, the percentages of successful amplification and polymorphism were higher than, or of the same magnitude as, those reported in the lit-erature for the group `birds’. Herein, when considering loci isolated in other genera of the same family asP. chihi, the 84% of successful heterologous amplification was of the same magnitude as that obtained by Changet al.(2009) (81.8%), and higher than that by Barbará et al. (2007) (62%), Lopeset al.(2010) (62.5%), and Yeunget al.(2009) (17%). When considering different families of the same or-der, 57% success was higher than Li and Merilä (2010) (47.4%), Yeunget al.(2009) (9%), Barbaráet al.(2007) (38%), and Miño (2006, Master’s Thesis, Universidade Fe-deral de São Carlos, São Carlos, Brazil) (31%). The per-centage of polymorphic loci among those that successfully amplified, when considering co-familial genera, was 40%, whereas Barbaráet al.(2007) encountered 55%. The per-centage of polymorphic loci found among families of the same order (24%) was higher than those found by Li and Merilä (2010) (21.1%), Barbaráet al. (2007) (23%) and Miño (2006, Master’s Thesis, Universidade Federal de São Carlos, São Carlos, Brazil) (15.5%).
ThePICindex, an efficient indicator of loci adequacy in population genetics studies, ranged from 0.35 to 0.76, with a mean of 0.50 in our panel of microsatellites (Table 1). It is commonly accepted thatPICvalues > 0.50 are characteristic of the most useful markers, 0.25 <PIC> 0.50 of those moderately informative, andPIC< 0.25 of the less informative (Andres and Kapkowska, 2011). Thus, the loci optimized in this study can thus be considered moder-ate to highly informative. The potential of our set of mark-ers for identifying individuals within the population was quite high,i.e., across loci PI= 0.0002 in Alvorada and
PI= 0.0001 in Tapes. Exclusion probability (PE) across loci of 98% falls within the range observed in other water-birds (Miñoet al., 2009). This relatively high probability of excluding a false parent indicates that this panel of markers is useful not only in the estimation of the overall level of ge-netic variability in white-faced ibis populations, but also in the diagnosis of relationships between individuals.
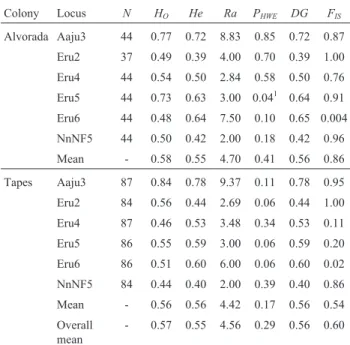
Population genetic parameters were estimated using the entire sample (N = 44 for Alvorada; N = 87 for Tapes). Analysis with the Micro-Checker program indicated null alleles in Eru6 loci due to homozygote excess in both popu-lations, probably caused by stuttering in the electrophe-rograms. According to Chi-square tests, with sequential Bonferroni correction, there was no departure fromHWEin any of the analyzed loci after multiple comparisons (Table 2). Across population samples, the mean number of alleles per locus was 4.83, averageHe0.55 and averageHo
significantly from random mating (p = 0.004), neither per locus nor population. The exact test ofLDindicated associ-ation (p < 0.05) between Eru6 and Eru4 loci in the Alvorada colony, and between NnNF5 and Eru5 loci in both popula-tions. Thus, NnNF5 and Eru6 loci were excluded when sub-sequently estimating population genetic parameters.
Overall expected heterozygosity observed in the white-faced ibis (He: 0.55) was similar to that observed in 17 species of aquatic birds (He: 0.62±0.15). ThisHevalue was higher than the range of most common heterozygosity values (He: 0.40-0.50) observed in 17 aquatic bird species (Eoet al., 2011), besides being higher than that observed in the wood stork, of the same magnitude as that noted in the jabiru stork (Jabiru mycteria), and lower than in the roseate spoonbill and great egret (Table 3). Furthermore, on con-sidering only the aquatic species phylogenetically more re-lated to the white-faced ibis (the great cormorant,
Phalacrocorax carbo, and the great blue heron, Ardea herodias), mentioned in the Eoet al.(2011) study, it can be seen that in the white-faced ibis,Hevalues were lower (Ta-ble 3). Moreover, the mean number of alleles per locus ob-served in the white-faced ibis (A: 4.83) was lower than the average for the 17 former mentioned species examined by Eoet al.(2011) (A: 6.59±6.94).
According to the Bottleneck program, there was no evidence of recent reduction in size in either of the two re-productive colonies (Wilcoxon test, Alvorada: p = 0.43; Tapes: p = 0.10). Population differentiation analysis re-vealed low, but significant interpopulation genetic structur-ing (FST= 0.009, p < 0.05). According to AMOVA
analy-sis, most genetic variation at the microsatellite locus level (98%) was among individuals within populations, whereas only 2% (p = 0.054) of variation was interpopulational. Ac-cording to Bayesian analysis, both samples can be
consi-Table 1- Basic information on the microsatellite markers screened in this study. Summary information on the heterologous microsatellite loci screened in a pooled sample of 20 individuals of the white-faced ibisPlegadis chihifrom each of two Brazilian colonies.Superscripts in locus names refer to refer-ences of the original primer description and PCR cycling parameters, detailed in the table footnote. An asterisk (*) to locus names indicates polymorphism in the studied sample. AT: Annealing temperature in the original species / inP. chihi. PIC:polymorphic information content,ML: monomorphic locus.
Locus Repetitive unit AT (°C) Reverse primer volume (mL) / concentration (mM) in PCR
Forward primer volume (mL) / concentration (mM) in PCR
PIC
Aaju31* (GAT)13 55 / 53 0.6 / 2.5 0.6 / 2.5 0.76
Aaju51 (GAT)
16(TAT)4 58 / 55 0.6 / 2.6 0.6 / 2.6 ML
NnNF52 * (TAGA)
2TA(CA)8 57 / 57 1.0 / 0.4 2.5 / 10.5 0.35
NnCE112 (CTG)8 59 / 56 0.8 / 4.0 0.2 / 1.0 ML
NnDD92 (GT)
8 59 / 54 0.8 / 4.0 0.2 / 1.0 ML
NnHB122 (CAT)7 59 / 56 0.8 / 4.0 0.2 / 1.0 ML
Eru23* (GA)
7(A)4(GA)10 53 / 53 0.8 / 4.0 0.2 / 1.0 0.38
Eru33 (AG)
21 53 / 53 0.5 / 2.5 1.25 / 6.25 ML
Eru43* (TC)11(C)3(TC)9 62.5 / 54 0.5 / 2.5 1.25 / 6.25 0.37
Eru53* (CA)
15(AT)2(CA)3 65 / 62 0.8 / 4.0 0.2 / 1.0 0.53
Eru63* (CT)20 57 / 54 0.5 / 2.5 1.25 / 6.25 0.59
Eru73 (CT)6AG(CT)6TC(CT)10 62.5 / 60 0.8 / 4.0 0.2 / 1.0 ML
Eru83 (GA)
8GCAAGT(GA)9 63 / 63 0.8 / 4.0 0.2 / 1.0 ML
Eru93 (GA)24 62.5 / 54 0.5 / 2.5 1.25 / 6.25 ML
Eru113 (GAAGA)
18 62.5 / 63 0.8 / 4.0 0.2 / 1.0 ML
WS34 (AG)10 60 / 58 0.8 / 4.0 0.8 / 4.0 ML
WS44 (GT)15 60 / 58 0.8 / 4.0 0.8 / 4.0 ML
WS94 (AAC)
7 60 / 58 0.8 / 4.0 0.8 / 4.0 ML
Bi15 (GT)11 57 / 57 0.8 / 4.0 0.2 / 1.0 ML
Bi55 (TTTG)
4 56 / 54 0.8 / 4.0 0.2 / 1.0 ML
Bi75 (TA)5 56 / 52 0.8 / 4.0 0.2 / 1.0 ML
Bi95 (CT)4(TTC)2(TC)4 58 / 58 0.8 / 4.0 0.2 / 1.0 ML
Bi105 (AC)
5AA(AC)4 58 / 54 0.8 / 4.0 0.2 / 1.0 ML
Bi115 (GT)4 60 / 55 0.8 / 4.0 0.2 / 1.0 ML
Bi125 (CA)
4(TC)2 59 / 59 0.8 / 4.0 0.2 / 1.0 ML
Source species:1
Platalea ajaja(Sawyer, 2002, PhD Thesis, Univ. North Texas);2
Nipponia nippon(Jiet al., 2004);3
dered as a single population cluster. This is in agreement with the estimated number of migrants per generation (Nm= 1.7) and indicates that gene flow may be occurring between the studied populations. In theory, the migration of one individual per generation is sufficient to homogenize the genetic pools of two different populations (Hartl and Clark, 1989). Thus, the low significant differentiation
de-tected between these two white-faced ibis colonies is prob-ably a consequence of minor genetic divergence. It must be stressed that a study with more representative samples, col-lected throughout the entire species-distribution range, us-ing additional microsatellite loci, would help to clarify this issue.
In conclusion, the panel of heterologous loci opti-mized in this study is suitable for future investigations on genetic structure and relatedness in both natural and captive populations of the white-faced ibis. Future studies includ-ing additional loci and populations, should be carried out in order to characterize overall genetic structuring of breeding colonies distributed throughout Brazil. We believe that the data herein would be useful for studies on important ques-tions regarding population genetics, mating systems and kinship in the white-faced ibis and related species. More specifically, the information provided in the present study can benefit studies of population genetics in other species within the genus Plegadis, viz., P. falcinellus and P. ridgwayi.
Acknowledgments
We are extremely grateful to Mr. Scherezino Sherer for collecting all the samples from Rio Grande do Sul and to IBAMA/CEMAVE for bird-sampling permission (22663-1). This study was supported by an MSc scholarship from CNPq to ASMCS (135235/2008-1) and by project research grants from FAPESP to SNDL (2004/15205-8; 2010/50406-5). CIM especially acknowledges support from CAPES (PRODOC project no. 004515/2010). We are also grateful to lab members that read earlier versions of this manuscript.
References
Andres K and Kapkowska E (2011) Applicability of anatid and galliform microsatellite markers to the genetic diversity studies of domestic geese (Anser anser domesticus) through the genotyping of the endangered zatorska breed. BMC Res Notes 4:e65.
Barbará T, Palma-Silva C, Paggi GM, Bered F, Fay MF and Lexer C (2007) Cross-species transfer of nuclear microsatellite markers: Potential and limitations. Mol Ecol 16:3759-3767. Campanini EB, Moralez-Silva E and Del Lama SN (2010)
Isola-mento de marcadores microssatélites em populações brasi-leiras deBubulcus ibis(Ciconiiformes, Ardeidae). Resumos do 56° Congresso Brasileiro de Genética, Guarujá, pp 78. Chang Q, Xie Z, Li Q and Zhou K (2009) Microsatellite loci
de-veloped for black-crowned night-heron (Nycticorax nycticorax) and their cross-amplifications in Ardeidae. Conserv Genet 10:1537-1539.
Cornuet JM and Luikart G (1996) Description and power analysis of two tests for detecting recent population bottlenecks from allele frequency data. Genetics 144:2001-2014.
Dawson A, Hanotte O, Greig C, Stewart IR and Burke T (2000) Polymorphic microsatellites in the blue titParus caeruleus - Levels of genetic diversity inPlegadi chihi. Population genetic
parameters for two Brazilian breeding-colonies of the white-faced ibis, es-timated based on six heterologous microsatellite loci.N: Number of sam-ples genotyped, Ho: Observed heterozygosity, He: Expected heterozygosity,Ra: Allelic richness,PHWE: Probability values for tests of departure from Hardy-Weinberg Equilibrium,DG: Gene diversity,FIS: In-breeding coefficient.
Colony Locus N HO He Ra PHWE DG FIS
Alvorada Aaju3 44 0.77 0.72 8.83 0.85 0.72 0.87
Eru2 37 0.49 0.39 4.00 0.70 0.39 1.00
Eru4 44 0.54 0.50 2.84 0.58 0.50 0.76
Eru5 44 0.73 0.63 3.00 0.041 0.64 0.91
Eru6 44 0.48 0.64 7.50 0.10 0.65 0.004
NnNF5 44 0.50 0.42 2.00 0.18 0.42 0.96
Mean - 0.58 0.55 4.70 0.41 0.56 0.86
Tapes Aaju3 87 0.84 0.78 9.37 0.11 0.78 0.95
Eru2 84 0.56 0.44 2.69 0.06 0.44 1.00
Eru4 87 0.46 0.53 3.48 0.34 0.53 0.11
Eru5 86 0.55 0.59 3.00 0.06 0.59 0.20
Eru6 86 0.51 0.60 6.00 0.06 0.60 0.02
NnNF5 84 0.44 0.40 2.00 0.39 0.40 0.86
Mean - 0.56 0.56 4.42 0.17 0.56 0.54
Overall mean
- 0.57 0.55 4.56 0.29 0.56 0.60
1Non-significant after sequential Bonferroni correction (p > 0.05).
Table 3- Heterozygosity in seven aquatic-bird species. Comparison of
av-erage expected heterozygosity (HE) values observed in seven species of aquatic birds analyzed using microsatellite markers.
Species HE Reference
Wood stork (Mycteria americana) 0.37 Miñoet al., 20111
Wood stork (Mycteria americana) 0.44 Van Den Bussche
et al., 19991
White-faced Ibis (Plegadis chihi) 0.55 This study Jabiru stork (Jabiru mycteria) 0.55 Lopeset al., 2010 Great egret (Ardea alba) 0.58 Miñoet al., 2011 Great Blue Heron(Ardea herodias) 0.59 Eoet al., 20102 Roseate spoonbill (Platalea ajaja) 0.61 Miñoet al., 2011 Great Cormorant (Phalacrocorax carbo) 0.73 Eoet al., 20103 1
The study by Miñoet al.(2011) refers to nine microsatellite loci, whereas that by Van Den Busscheet al.(1999) refers to four loci, also mentioned in Eoet al.(2010).
2Original reference: McGuire and Noor (2002).
and their cross-species utility in 20 songbird families. Mol Ecol 9:1941-1944.
Eo SH, Doyle JM and DeWoody JA (2011) Genetic diversity in birds is associated with body mass and type. J Zool 283:220-226.
Excoffier L and Lischer HEL (2010) Arlequin suite ver 3.5: A new series of programs to perform population genetics anal-yses under Linux and Windows. Mol Ecol Resour 10:564-567.
Galbusera P, Van Dongen S and Matthysen E (2000) Cross-species amplification of microsatellite primers in passerine birds. Conserv Genet 1:163-168.
Goudet J (1995) FSTAT ver. 1.2: A computer program to calcu-late F-statistics. J Hered 86:485-486.
Goostrey A, Carss DN, Noble LR and Piertney SB (1998) Popula-tion introgression and differentiaPopula-tion in the great cormorant Phlacrocorax carboin Europe. Mol Ecol 7:329-338. Haig SM, Bronaugh WM, Crowhurst RS, D’Elia J, Eagles-Smith
CA, Epps CW, Knaus B, Miller MP, Moses ML, Oyler-McCance S,et al.(2011) Genetic applications in avian con-servation. Auk 128:205-229.
Hartl DL and Clark AG (1989) Principles of Population Genetics. 2nd edition Sinauer Ass. Inc. Sunderland, Massachusetts, 682 pp.
Ji YJ, Liu Y, Ding C and Zhang D (2004) Eight polymorphic microsatellite loci for the critically endangered crested ibis, Nipponia nippon (Ciconiiformes, Threskiornithidae). Mol Ecol Notes 4:615-617.
Kalinowski ST, Taper ML and Marshall TC (2007) Revising how the computer program Cervus accommodates genotyping error increases success in paternity assignment. Mol Ecol 16:1099-1106.
Li M and Merilä J (2010) Avian Z-specific microsatellites map to pseudoautosomal or autosomal chromosomes in the Sibe-rian jay (Perisoreus infaustus): Insights into avian genome evolution from cross-species amplification tests. J Genet 89:223-228.
Li YC, Korol AB, Fahima T, Beiles A and Nevo E (2002) Micro-satellites: Genomic distribution, putative functions and mutational mechanisms: A review. Mol Ecol 11:2453-2465. Lopes IF, Haig SM and Del Lama SN (2010) Genetic
character-ization of Neotropical Jabiru storks: Insights for conserva-tion. Waterbirds 33:425-437.
Luikart G, Allendorf FW, Cornuet JM and Sherwin WB (1998) Distortion of allele frequency distributions provides a test for recent population bottlenecks. J Hered 89:238-247. McGuire HL and Noor MAF (2002) Microsatellite loci for great
white herons and great blue herons (Aves, Ardeidae,Ardea herodias). Mol Ecol Notes 2:170-172.
Miño CI, Sawyer GM, Benjamin RC and Del Lama SN (2009) Parentage and relatedness in captive and natural populations of the Roseate Spoonbill (Aves, Ciconiiformes) based on microsatellite data. J Exp Zool A 311:453-464.
Miño CI, Russelo MA, Gonçalves PFM and Del Lama SN (2011) Reconstructing genetic mating systems in the absence of pa-rental information in colonially breeding waterbirds. BMC Evol Biol 11:e196.
Mukesh T, Rai ID, Mandhan RP and Sathyakumar S (2011) A panel of polymorphic microsatellite markers in Himalayan monalLophophorus impejanusdeveloped by cross-species
amplification and their applicability in other Galliformes. Eur J Wildl Res 57:983-989.
Nei M (1987) Molecular Evolutionary Genetics. Columbia Uni-versity Press, New York, 512 pp.
Peakall R and Smouse PE (2006) GENALEX 6: Genetic analysis in Excel: Population genetic software for teaching and re-search. Mol Ecol Notes 6:288-295.
Petry MV and Fonseca VS (2005) Breeding success of the colo-nist speciesBubulcus ibis(Linnaeus, 1758) and four native species. Acta Zool 86:217-221.
Piertney SB, Goostrey A, Dallas JF and Carss DN (1998) Highly polymorphic microsatellite markers in the great cormorant Phalacrocorax carbo. Mol Ecol 7:138-140.
Primmer CR, Moller AP and Ellegren H (1996) A wide range sur-vey of cross-species microsatellite amplification in birds. Mol Ecol 5:365-378.
Primmer CR, Raudsepp T, Chowdhary BP, Møller AP and Elle-gren H (1997) Low frequency of microsatellites in the avian genome. Genome Res 7:471-482.
Primmer CR, Painter JN, Koskinen MT, Palo JU and Merilä J (2005) Factors affecting avian cross-species microsatellite amplification. J Avian Biol 36:348-360.
Pritchard JK, Stephens P and Donnelly P (2000) Inference of pop-ulation structure using multilocus genotype data. Genetics 155:945-959.
Rice WR (1989) Analyzing tables of statistical tests. Evolution 43:223-225.
Rousset F (2008) Genepop’007: A complete reimplementation of the Genepop software for Windows and Linux. Mol Ecol Resour 8:103-106.
Ryder RA and Manry DE (1994) White-faced Ibis (Plegadis chihi). In: Poole, A and Gill, F (eds) The Birds of North America. No. 130. The Academy of Natural Sciences, Phila-delphia, and The American Ornithologists Union, Washing-ton, D.C. 24 pp.
Sambrook J, Fritsch EF and Maniatis T (1989) Molecular Clon-ing: A Laboratory Manual. 2nd edition. Cold Spring Har-bour Laboratory Press, New York.
Santos MS, Gonçalves EC, Barbosa MSR, Silva A and Schneider MPC (2006) Isolation and characterization of polymorphic microsatellite loci in the scarlet ibis (Eudocimus ruber -Threskiornithidae – Aves). Mol Ecol Notes 6:307-309. Schuelke M (2000) An economic method for the fluorescent
la-beling of PCR fragments. Nat Biotechnol 18:233-234. Selkoe KA and Toonen RJ (2006) Microsatellites for ecologists:
A practical guide to using and evaluating microsatellite markers. Ecol Lett 9:615-629.
Slatkin NM (1985) Gene flow in natural populations. Annu Rev Ecol Syst 16:393-430.
Slatkin M and Barton NH (1989) A comparison of three methods for estimating average levels of gene flow. Evolution 43:1349-1368.
Tautz D (1989) Hypervariability of simple sequences as a general source for polymorphic markers. Nucleic Acids Res 17:6463-6471.
Van Den Bussche RA, Harmon SA, Baker RJ, Bryan ALJ, Rodgers JAJ, Harris MJ and Brisbin ILJ (1999) Low levels of genetic variability in North American populations of the Wood Stork (Mycteria americana). Auk 116:1083-1092. Van Oosterhout C, Hutchinson WF, Wills DPM and Shipley P
(2004) MICRO-CHECKER: Software for identifying and correcting genotyping errors in microsatellite data. Mol Ecol 4:535-538.
Yeung CKL, Hsu Y, Yao C and Li S (2009) Isolation and char-acterization of 23 microsatellite loci in the black-faced spoonbill (Platalea minor) and amplification in other Ciconiiformes waterbirds. Conserv Genet 10:1081-1084.
Zane L, Bargelloni L and Patarnello T (2002) Strategies for microsatellite isolation: A review. Mol Ecol 11:1-16.
Internet Resources
Dark-Smiley D and Keinath DA (2003) Species assessment for White-faced ibis (Plegadis chihi) in Wyoming. United States Department of the Interior Bureau of Land Manage-ment Wyoming, State Office Cheyenne, Wyoming. Avail-able at: http://www.uwyo.edu/wynddsupport/docs/Re-ports/SpeciesAssessments/White-faced%20Ibis%20-%20F inal%20(Dec%202003).pdf.
Associate Editor: Fabrício Rodrigues dos Santos