Dissertação apresentada para obtenção do grau de doutor em Biologia Evolutiva
pelo Instituto de Tecnologia Química e Biológica da Universidade Nova de Lisboa.
Este trabalho teve apoio financeiro da FCT e do FSE no âmbito do Quadro Comunitário de apoio,
Acknowledgments
I would like to thank Arcadi Navarro and Isabel Gordo for accepting to supervise this PhD and Arcadi Navarro for the opportunity to collaborate in other projects, three of which resulted in the publications found in the Appendices section.
I am also grateful to the Unitat de Biologia Evolutiva of the Universitat Pompeu Fabra, now part of the Institut de Biologia Evolutiva, for hosting me during this work, and its members for making me feel welcome.
A very special thank you to a great number of people who I was lucky to meet along these years that took the time to discuss my (and their own) projects with me and contributed with helpful comments and ideas which greatly improved my work, even if that work didn’t make it into the thesis.
Index
Summary 7
Resumo 9
INTRODUCTION 11
Historical perspective 13
Genes in pieces 13
Not much room for doubt 14
First impressions 15
Evolutionary perspective 16
Four kinds of introns 17
tRNA and archaeal introns 17
Self-splicing introns 17
Spliceosomal introns 20
Introns early vs late 20
Mechanisms of intron gain and loss 22
Intron loss 22
Intron gain 23
Splicing 24
The spliceosome 25
Splicing signals and the assembly of the spliceosome 25
The minor form of spliceosome 27
Finding the correct pair of splice sites 28
Alternative splicing 29
Why should we care about introns? 30
Boost mRNA quality 31
Increase recombination 31
Source of functional diversity 31
Repositories of functional elements 32
References 35
RESULTS 41
Publication I: Intronic mutational constraints in Primates 43
Abstract 45
Introduction 45
Materials and Methods 47
Results 49
Discussion 57
Publication II: Accelerated evolution in Human introns 65
Abstract 67
Introduction 67
Materials and Methods 70
Results 74
Discussion 80
Acknowledgments 83
Supplementary Tables 84
References 93
GENERAL DISCUSSION AND CONCLUSIONS 97
Constraints on the evolution of intronic sequences 99 Accelerated evolution of intronic sequences 100
Summary ● 7
Summary
Spliceosomal introns, the most common class of introns in eukaryotes, found in the protein coding genes in the nucleus of these organisms, are commonly described as regions in the primary transcript that need to be excised in order to produce the functional mRNA molecule. Yet, they are also regions in the RNA transcript, and the corresponding genomic regions, with a high number of functional elements that act either at the RNA or DNA level and help regulate important cellular processes such as splicing and gene expression.
With the exception of the core splicing signals, whose sequence motifs and location within the intron are relatively well defined, most of the other cis-acting functional elements in introns are located at variable distances from the splice sites and contain degenerate sequence motifs with low information content, which make them much harder to locate within the introns. Given the critical roles played by these elements, it is likely that many evolve under selective pressure to maintain function, which will affect intron sequence conservation levels. Thus, sequence conservation can help in the task of finding these cis-regulatory elements, as the most constrained regions in introns are their most likely location.
introns as neutrally evolving sequences in order to, for instance, estimate genetic distances between species or detect selective events.
Given the potential of alternative splicing to generate proteins with diverse functions (sometimes even opposite roles) from the same gene, and the contribution of both tissue-specific alternative splicing events and transcription regulation to organism complexity, it is plausible that some of the cis-acting functional elements found in introns evolved under positive selection and are responsible for organismal differences between species.
Resumo ● 9
Resumo
Os intrões dependentes do spliceossoma, a classe de intrões mais comum em eucatiotas, presentes nos genes que codificam proteínas existentes no núcleo destes organismos, são frequentemente descritos como as regiões dos transcritos primários que necessitam ser removidas para que se forme uma molécula funcional de RNA mensageiro. No entanto, os intrões são também regiões no transcrito de RNA, e nas zonas genómicas correspondentes, que contêm um grande número de elementos funcionais, que actuam a nível do RNA ou do DNA, e que contribuem para a regulação de processos celulares importantes, como o splicing e a expressão génica. Exceptuando os sinais de splicing principais, cujos padrões de sequência e localização dentro do intrão são relativamente bem definidos, a maior parte dos elementos funcionais presentes nos intrões encontram-se a distâncias variáveis dos locais de splicing e contêm padrões de sequência degenerados com baixo conteúdo de informação, o que dificulta a sua identificação. Dada a sua importância, é provável que muitos evoluam sob pressão selectiva para manter a sua função, o que se reflectirá nos níveis de conservação ao longo do intrões. Desta maneira, os níveis de conservação podem ajudar na tarefa de encontrar estes elementos reguladores, já que as regiões mais conservadas nos intrões são as que maior probabilidade têm de os conter.
computacionais de motivos sobre-representados ou experiências funcionais), quer para estudos que usem intrões como sequências que evoluem neutralmente para, por exemplo, estimar distâncias genéticas entre espécies ou detectar eventos de selecção.Tendo em conta que através do mecanismo de splicing alternativo se podem gerar diferentes proteínas a partir do mesmo gene (por vezes até com funções antagónicas), e a contribuição, tanto dos eventos de splicing alternativo variável de acordo com o tecido celular como da regulação da transcrição, para a complexidade dos organismos, é possível que alguns dos elementos funcionais presentes nos intrões tenham evoluído sob selecção positiva e sejam responsáveis por diferenças entre espécies a nível do organismo.
"A week of hard work can sometimes save you an hour of thought."
Historical perspective ● 13
Historical perspective
(Stumbling into introns)
The word intron first appeared in 1978 by the hand of Walter Gilbert (Gilbert 1978) as an abbreviation for intragenic region. The discovery of introns itself however was made the year before, in 1977, and is now commonly attributed to Richard J. Roberts and Phillip A. Sharp, who, in 1993, were awarded the Nobel Prize in Physiology or Medicine for their discovery of "split genes".
Genes in pieces?
By the mid 1970s, genes were seen as “transcribed code” (Gerstein et al. 2007) – continuous stretches of DNA that are copied into RNA – and messenger RNA (mRNA) was thought to be a direct copy of the gene sequence. This view was based mainly on studies with bacteria and bacteriophages, which dominated the field at the time, but the collinearity and continuity of the DNA, RNA and protein sequences was assumed to be universal. Therefore, the finding that mRNA can derive from physically separate sections along the DNA came as a shock1 and at the time it looked like genes were split in pieces by introns, which were initially referred to as intervening DNA, inserts, spacer sequences or spacers.
By 1976 it was already known that the primary transcripts of all major classes of RNA (ribosomal, transfer and messenger) undergo some processing before they become the functionally competent, mature forms of RNA. There was also considerable evidence that eukaryotic mRNAs are initially transcribed as much larger molecules – the heterogeneous nuclear RNAs (hnRNAs) – that are subsequently shortened. Based
1 James Watson actually used the word “bombshell” to describe this finding in the ‘Foreword’
on observations that mRNA and hnRNA share the same polyadenylation site it was proposed that the mRNA segment was placed at the 3’-end of the hnRNA. When it was later found that caps are also present at the 5’-end of both mRNA and hnRNA researchers reasoned that, in some cases, the mRNA segment was located at the 5’-termini of its precursor (Perry 1976). It was assumed that one or the other end of the initial transcript was cut off, no one expected that the discarded segments could come from the middle of the RNA (Marx 1977; Rogers 1978; Marx 1978).
Not much room for doubt
Not only was the discovery of introns surprising and unexpected, it also happened at a breathtaking pace (Figure 1).
The finding was first reported at the Cold Spring Harbor Symposia on Quantitative Biology, in the beginning of June 1977. Several groups of investigators, including Sharp’s and Roberts’ groups, presented their independent discovery that a number of mRNAs of animal viruses consist of sequences complementary to widely separated portions of the viral genome. The importance of these works was immediately recognized and featured in the News sections of magazines such as Nature and Science (Sambrook 1977; Marx 1977) even before the original research articles (Berget et al. 1977; Chow et al. 1977; Klessig 1977; Dunn and Hassell 1977; Lewis et al. 1977; Aloni et al. 1977; Kitchingman et al. 1977; Hsu and Ford 1977) were published.
Historical perspective ● 15
Figure 1 Timeline of events regarding the discovery of introns. Above the timeline are events discussed
in the main text and below are some of the main advances that allowed the discovery of introns. Temin,
Baltimore, Smith, Berg, Sharp and Roberts were all later awarded Nobel prizes for the discoveries
mentioned in the figure. Line width is proportional to the number of publications. *The study on
Drosophila rRNA was published in February 1977.
In the following months the list of species in which introns were observed grew quickly and introns were found to be present in the precursors not only of mRNA but also of ribosomal (rRNA) and transfer (tRNA) RNA. It soon became clear that in eukaryotes genes with introns were not the exception but the rule.
First impressions
Remarkably, introns were immediately assumed to have a function. Very early on, just as the first examples in eukaryotes were found, and even before it was known for sure that introns are transcribed, researchers postulated that introns could have
1970 1971 1972 1973 1974 1975 1976 1977 1978 1979
Feb ▪▪▪ Jun Jul Aug Sep Oct Nov Dec Jan Feb
At the Cold Spring Harbor Symposia several groups studying animal viruses present evidence that mRNAs are complementary to noncontiguous regions of the viral genome
Sharp and Roberts are among the first to publish their results (in August and September, respectively), closely followed by the other
groups
… and the surprising discovery featured in the News section of Nature and Science
Studies on ovalbumin, beta-globin, immunoglobulin, rRNA and tRNA genes soon
demonstrate that the phenomenon is widespread among eukaryotes and is not
limited to messenger RNA.
Walter Gilbert coined the terms
intronand exon
*
*
Paul Berg constructed the first
recombinant-DNAmolecule Howard Temin and David
Baltimore simultaneously discover reverse transcriptase
Hamilton Smith purified a restriction enzyme(HindII) and first showed that it cuts DNA with a specific sequence
R-looptechnique is described
Southern blotting
regulatory functions, including determining chromatin conformation during the control of transcription (Williamson 1977), and regulating protein synthesis after transcription (Marx 1978).
Another early speculation was that introns would be important for the evolution of the genome. Perhaps the most influential article on this matter was Walter Gilbert’s “news and views” piece early in 1978 (Gilbert 1978). In just about one thousand words, Gilbert coins the terms intron and exon, predicts that introns account for far more DNA than exons and foresees the disappearance of the one gene-one polypeptide dogma. He also proposes that the presence of introns in genes can speedup evolution by allowing rearrangements of the coding regions (also proposed by Rogers, 1978), or by enabling single base pair changes to generate novel proteins (instead of only changing a single amino acid), due to the deletion or addition of whole sequences of amino acids, if those mutations occur near the splice sites and alter the splicing pattern. He continues by speculating that splicing does not need to be a hundred per cent efficient so that, in his own words, “evolution can seek new solutions without destroying the old”.
Evolutionary perspective
(Learning to live with introns)
Evolutionary perspective ● 17
Four kinds of introns
In the literature (and the remainder of this book) the word intron is frequently used to refer to the prolific nuclear mRNA spliceosomal introns. There are however three other less abundant classes of introns, known as group I, group II and tRNA and/or archaeal introns, which differ in the mechanism by which they are spliced out.
tRNA and archaeal introns
Introns in tRNA, rRNA and mRNA genes of archaea and in tRNA genes in the nucleus of eukaryotes share a splicing mechanism with a characteristic that sets them apart from all the other classes of introns: they are spliced by protein enzymes, without any RNA catalyst (Calvin and Li 2008).
First, a splicing endonuclease excises the intron, probably guided not by sequences in the RNA, but by RNA structural features, and then a ligase joins the two exons. Although the ligation reaction differs, the cleavage step is conserved in eukaryotes and archaea. The similarity of the cleavage reaction, the sequence homology of the splicing endonucleases and the shared preferential location of the intron in the tRNA genes all support a common origin for these introns in the two domains/superkingdoms of cellular organisms (Archaea and Eukaryota) (Lykke-Andersen et al. 1997).
Organisms from the other domain/superkingdom (Bacteria) don’t have this class of introns nor the splicing endonuclease. In these organisms introns found in tRNAs genes belong to the group I class of self-splicing introns (Fujishima et al. 2010).
Self-splicing introns
approximately 2,900 group I introns described so far are found in rRNA genes in the nucleus, mainly of fungi. On the other hand, group II introns have been found in a genus of archaea (Lambowitz and Zimmerly 2004), and most of the about 750 group II introns are found on the chloroplast of green plants and algae (Cannone et al. 2002).
Introns in these two classes are capable of self-splicing, that is, they can extract themselves from the RNA molecule without the help of proteins or other RNAs2. They do so by folding themselves into specific three-dimensional structures that bring the intron-exon junctions into close proximity and allow precisely positioned reactive groups to perform the splicing reactions3. The folding itself occurs due to the presence of conserved partially complementary sequence stretches in the RNA molecules (Alberts et al. 2002, 6).
Group I and group II introns can be distinguished based on their conserved sequences and secondary structures, on the splicing reaction requirements (group I introns use a free guanosine, while group II introns use an especially reactive adenine residue in the intron sequence itself to initiate self-splicing) and on the structure of the released intron, which have the shape of a lariat in group II (Cech and Bass 1986; Vicens and Cech 2006). These fundamental differences, besides justifying their classification into separate groups, suggest that the two groups originated independently.
Self-splicing group I introns have very well conserved primary and secondary structures which supports the idea that they share a common origin. Their widespread but sporadic distribution in nature suggested that they may have spread by horizontal transfer. Phylogenetic analyses confirmed this hypothesis when it was
2 Nonetheless, in the cell, self-splicing introns are normally aided by proteins that speed up
the reaction.
3 Self-splicing introns were actually the first example of RNA molecules with catalytic function.
Evolutionary perspective ● 19
shown that introns located at homologous gene sites in different organisms tend to be more closely related than those at heterologous sites within the same organism (Hoshina and Imamura 2009).
On the other hand, the observed distribution of group II introns – mainly in bacteria, mitochondria and chloroplast – suggests that they originated in bacteria and have been kept since the bacterial endosymbionts that gave rise to those organelles. The few group II introns found in archaea, on the other hand, are likely to be the result of lateral transfer from bacteria (Lambowitz and Zimmerly 2004).
Both groups of introns are still capable of horizontal transfer through homing (a process by which an intron spreads to a homologous position in an intronless allele) and reverse splicing, and are thus currently viewed also as mobile genetic elements. Group II introns, in particular, have been proposed to be ancestors of non-LTR retrotransposons (Lambowitz and Zimmerly 2004).
Spliceosomal introns
Introns have been found in all three domains/superkingdoms of cellular organisms (Archaea, Bacteria and Eukaryota), different type of genes (protein, rRNA and tRNA coding genes) and various eukaryotic organelles (nucleus, mitochondria and chloroplast). The previous classes of introns can be found in at least two domains, type of gene and/or organelles, but spliceosomal introns are only found in nuclear, protein coding, eukaryotic genes. Yet, they are present in most, if not all, nuclear eukaryotic genomes characterized to date and are by far the most common class of introns in these organisms, reaching hundreds of thousands per genome in vertebrates and plants (Roy and Gilbert 2006).
Contrary to group I and group II introns, spliceosomal introns do not fold into specific three-dimensional structures and they are completely dependent on both proteins and other RNAs (which form a large complex that gives them their name: the spliceosome) for their extraction. Nevertheless, the chemistries of their splicing reactions are very similar to group II introns, with spliceosomal introns being also released in a lariat structure, and the RNA molecules at the core of the spliceosome closely resemble a number of critical RNA domains of group II introns (Valadkhan and Jaladat 2010). Because of the striking similarities between these two classes of introns it has been proposed that spliceosomal introns evolved from group II introns (Cech 1986) by the transfer of the splicing ability to other molecules and loss of the conserved sequences that formed the typical secondary structures. As a consequence, much more of the intron sequence is left free to diverge and many more RNAs could be spliced (Alberts et al. 2002, 6).
Introns early
vs
late (when and where)
Two main theories have been proposed regarding the origin of (spliceosomal4) introns that are the object of a long-standing debate.
Evolutionary perspective ● 21
According to the Introns Early (IE) theory, introns were present in the ancestor of prokaryotes and eukaryotes: the last universal common ancestor (LUCA). In this ancestor, introns were initially just genomic regions between genes that coded for small proteins and were concatenated to form modern multiple-domain proteins. It was hypothesized that in this primitive organism the information copying mechanisms were error prone and, in order to prevent information loss, LUCA’s genome had to be highly redundant. Therefore, coding sequences would be present in multiple copies undergoing rapid information decay, and recombination within introns would enable the joining of functional exon copies. With the improvement in fidelity of the information copying mechanisms introns became less relevant and were eventually lost in prokaryotes as they evolved towards increased metabolic economy. In eukaryotes they were kept by gaining new functions (Rodríguez-Trelles et al. 2006).
This origin of introns in LUCA would avoid the deleterious effect of inserting functionless sequences into previously continuous genes. Yet, it implies that massive intron losses occurred independently across all prokaryote lineages.
A more parsimonious explanation, that spliceosomal introns only appeared in eukaryotes, is defended by the Introns Late (IL) theory. This theory proposes that some of the many genes that were transferred from the bacterial endosymbionts that gave rise to eukaryote organelles to the nucleus, contained self-splicing group II intron-like elements. In the eukaryotic nucleus they spread and the spliceosome evolved through the fragmentation of a group II intron (Belshaw and Bensasson 2006).
before the most recent common ancestor of living eukaryotes and that since then introns have been gained and lost differently in different lineages making it hard to infer the ancestral condition.
Mechanisms of intron gain and loss
Intron loss
Two main models of intron loss have been proposed. The first, genomic deletion, can remove parts of introns, and sometimes of adjacent coding regions, or, if it occurs by nonhomologous recombination between short direct repeats at both ends of the intron, it can excise introns exactly. The second, recombination with a reverse-transcribed copy of mRNA, will delete one or more adjacent introns in an exact manner.
Evolutionary perspective ● 23
Intron gain
Five main models have been proposed to explain the origin of new introns.
The most popular one, the intron transposition model, involves the duplication of an existing intron in a way similar to how Group II introns self-propagate. According to this model a RNA intron sequence that has been spliced out of a transcript is reverse-spliced into a new position of the same or a different mRNA. The new intron is finally inserted into the genome by recombination of a reverse-transcribed copy of the intron-acquiring transcript with its genomic template. Like with the second model of intron loss described in the previous section, this mechanism should be 3’ biased. Yet, because the recombination of the reverse-transcribed mRNA with the new intron can at the same time involve loss of neighboring existing introns, it would not necessarily lead to a bias in intron location towards the 3’ end of genes. According to this model though, the new introns should show sequence similarity to their intron sources but, so far, studies that have found new introns that resemble older introns in the same genome are scarce and the regions showing inter-intron homology are generally enriched in palindromic repetitive sequences that are also found in intergenic regions, raising doubts that they may have resulted from the spread of transposons with palindromic sequences.
Of these four models only the intron transposition and intron transfer mechanisms ensure that the inserted sequence includes the necessary signals for correct splicing. Although all of these models can explain current spliceosomal intron proliferation, none of them can account for how spliceosomal introns first arose, since all require the existence of a functional spliceosome. Only a fifth model for intron gain, Conversion of group II introns, includes a mechanism for the origin of the spliceosome. According to this model, group II introns from organellar genes were transferred to the nucleus, where they were inserted into previously intronless sites. With time, their splicing ability got transferred to trans-acting RNAs and other molecules, with consequent degradation of their internal RNA structure and loss of their ORFs, rendering them dependent to a common splicing apparatus: the spliceosome (Rodríguez-Trelles et al. 2006; Roy and Gilbert 2006).
Splicing
(Getting rid of introns)
Most protein coding genes in the nucleus of eukaryotes produce transcripts with intronic sequences that need to be removed in order to form a functional mRNA molecule. The process by which they are extracted, pre-mRNA splicing, involves two consecutive phosphoryl-transfer reactions, known as transesterifications, which join the two exons and release the intron in the shape of a lariat.
Splicing ● 25
the two exons together. After this second reaction the intron is released in the shape of a lariat that ultimately gets degraded.
The spliceosome
These splicing reactions are performed by the spliceosome: one of the largest molecular machines in the cell, a complex assembly of RNA and protein molecules whose composition and structure change along the splicing process.
Like with the self-splicing introns, RNA, not proteins, play the main role in splicing. These RNA molecules, known as snRNAs (small nuclear RNAs), lie at the core of the spliceosome and both recognize the splice sites and participate in the chemistry of splicing. In the major form of splicing (the minor form of spliceosome is described later in this section) there are five snRNAs, named U1, U2, U4, U5, and U6, and each forms complexes with at least seven protein subunits. Together, the snRNA and its associated proteins, form a snRNP (small nuclear ribonucleoprotein). Including the proteins that form the snRNPs, over 150 proteins integrate the spliceosome in humans (Alberts et al. 2002, 6; Valadkhan and Jaladat 2010).
This large machine is assembled on the pre-mRNA as its snRNAs find complementary sequences in the pre-mRNA, the splicing signals.
Splicing signals and the assembly of the spliceosome
There are three main splicing signals: the 5’ splice site, where the upstream exon ends and the intron starts; the branch site, containing the adenine nucleotide involved in the first transesterification and that forms the branch point of the lariat produced by splicing, and; the polypyrimidine tract/3’ spice site, at the 3’ end of the intron, just before the downstream exon (Schwartz et al. 2008).
ribonucleoprotein complex and replace previously bound molecules, so that the RNA sequences are checked multiple times before the chemical reaction takes place. In mammals there are four distinct spliceosomal complexes that vary in their snRNP and auxiliary proteins composition: E, A, B and C (in temporal order).
Early in the spliceosomal assembly pathway the U1 snRNA and U1C, a U1-specific protein, recognize the 5’ splice site, and the U2 snRNA together with the U2 auxiliary factor U2AF, recognize the branch site and the polypyrimidine tract and 3’ spice site. At this point, before the use of ATP, the interaction of the U2 snRNP with this region of the pre-mRNA is loose, and we are at the splicing complex E. With the use of ATP the association of U2 with this region is remodeled and strengthened, forming the splicing complex A.
In the next step the U4/U6•U5 tri-snRNP enters the spliceosome originating the B complex. In this triple snRNP, the U4 and U6 snRNAs are held firmly together by base-pair interactions that keep U6 in an inactive conformation, and the U5 snRNP is more loosely associated. Once the tri-snRNP joins the spliceosome several RNA-RNA rearrangements break the U4-U6 basepairing, U1 and U4 leave the complex, U2 replaces U4 as the basepairing partner of U6 and U6 replaces U1 at the 5’ splice junction as the B complex becomes catalytically active.
After the first transesterification reaction major structural rearrangements lead to the formation of spliceosomal complex C. In this step the U5 snRNA forms base-pair interactions with exon sequences at both the 5′ and 3′ splice site, bringing the two exons into close proximity for the second transesterification.
Splicing ● 27
The minor form of spliceosome
A small fraction of introns in more complex eukaryotes, such as flies, mammals and plants, have different conserved splicing motifs and are removed by a distinct spliceosome. At the core of this spliceosome there are also five snRNPs, of which only one, the U5 snRNP, is shared by both spliceosomes. The other four, U11, U12, U4atac and U6atac, are low-abundance snRNPs functionally analogous to the major spliceosome U1, U2, U4 and U6 snRNPs, respectively, making the same types of RNA-RNA interactions with the pre-mRNA-RNA and with each other as do the major snRNPs. This functional correspondence between major and minor class snRNPs is reflected in the similarity of their secondary structures, but not their nucleotide sequence. It thus seems that the low-abundance minor snRNPs are not simply a variant of the major snRNPs and the similarities evolved not from homology but by analogy. In fact, both models proposed for the origin of these two splicing systems assume they evolved from self-splicing group II introns but that the differences existed already in the progenitor of higher eukaryotes. According to one of the models the two spliceosome types derive from two different group-II-like introns, while the other model proposes that they evolved in separate lineages that later fused in the ancestor of higher eukaryotes.
virtually all of metazoan evolution indicates that they must have an important cellular function (Patel and Steitz 2003).
Finding the correct pair of splice sites
Even though the conserved sequence motifs in the splicing signals are read multiple times by different components of the spliceosome – which increases the accuracy of splice site selection – these motifs are short and degraded enough so that if the recognition of the splice sites was done by this alone there would be numerous splicing errors. The pairing of non-consecutive splice sites, for instance, would lead to the exclusion of one or more exons from the spliced mRNA, an error known as exon skipping, and the use of cryptic splice sites (locations in the pre-mRNA whose nucleotide sequence resembles the one found in true splice sites) would lead to exon truncation or incorporation of intronic sequence in the mature mRNA.
Besides the classical splicing signals there are other cis-acting elements with less clearly identifiable consensus sequences, found both in introns (ISR, intronic splicing regulators) and exons (ESR, exonic splicing regulators), which are important for correct splice site identification. These elements are recognized by SR proteins (serine- and arginine-rich proteins), hnRNPs (heterogeneous nuclear ribonucleoproteins) and other proteins, which interact with the spliceosome either enhancing or silencing splicing (Cartegni et al. 2002).
Splicing ● 29
The second mechanism that helps identifying the correct pair of splice sites has been proposed particularly for large introns. While exon size tends to be fairly uniform across eukaryotes, with an average of approximately 150 nucleotides, introns tend to be much longer, typically hundreds to thousands of nucleotides or more, and vary enormously in size even within a single organism. This makes locating splice sites across long introns remarkably difficult compared to pairing splice sites across even sized exons. Thus, the exon definition model proposes that first, splice sites are paired across the exons and then, consecutive exon units are paired as the spliceosome machinery assembles on the intervening intron. The pairing of splice sites across exons is helped by SR proteins that bind to exonic sequence and help recruit spliceosomal components and stabilize interactions (Berget 1995; Lim and Burge 2001; Wang and Burge 2008).
Alternative splicing
What the correct pair of splice sites is can actually change with time and tissue. The use of different splice site pairs can lead to complete exons being skipped or included in the mature mRNA, exons being shortened or elongated by the use of alternative 3’ and/or 5’ splice sites and introns being kept in the processed transcript. This variation on how a particular RNA transcript is spliced, named alternative splicing, leads to different parts of the primary transcript being present in the mature mRNA and can thus generate diverse peptides from a single gene.
2008; Pan et al. 2008). This can dramatically increase the number of proteins a genome is capable of synthesizing.
Some of these genes are constitutively alternatively spliced and the different mRNA isoforms are present in all the tissues in which that gene is expressed, but the majority (over 60%) of alternative splicing events are tissue-specific, lending support to the hypothesis that alternative splicing is a major contributor to phenotypic complexity in higher vertebrates (Wang et al. 2008).
This flexibility in the pairing of the acceptor and donor splice sites that allows for alternative splicing is achieved by relying less on the classic splice site motifs, which tend to be weaker in alternatively spliced exons, and depending more on exonic and intronic splicing regulators (ESR and ISR, described in the previous section), which tend to be more conserved in these exons (Keren et al. 2010).
Although it is not clear what portion of alternative transcripts is functional, there is no doubt that alternative splicing is a highly regulated process, as producing the wrong transcript in the wrong place or at the wrong time can be deleterious to the cell.
Why should we care about introns?
Why should we care about introns? ● 31
Boost mRNA quality
DNA rearrangements, frameshifts, nonsense mutations, transcriptional errors or incorrect splicing can all lead to the production of mRNAs with premature termination codons (PTCs) that could generate non-functional or deleterious truncated proteins. Cells, from yeast to human, have an mRNA surveillance mechanism, known as nonsense mediated decay (NMD), which targets this prematurely terminated mRNAs for degradation, thus increasing mRNA quality. Introns play a role in this process because NMD recognition of PTCs relies on the spatial relationship between the stop codon and the introns: generally a termination codon should only occur after all the introns. When introns are removed by splicing, proteins in the nucleus bind to and thereby mark the exon-exon junctions. If one of these junctions is found after a termination codon it triggers NMD (Cartegni et al. 2002).
Increase recombination
Linked loci interfere with each other's response to selection (Hill-Robertson effect), which can lead to the loss of beneficial mutations – since beneficial mutations occurring in different haplotypes have to compete among each other – and to the long-term accumulation of deleterious mutations (Muller's ratchet). By breaking down linkage disequilibrium, recombination increases the efficacy of natural selection (Felsenstein 1974).
Introns increase the rate of intragenic meiotic crossing over, generally reducing linkage disequilibrium between adjacent exons, and thus allow for more efficient selection of mutations within the gene (Duret 2001).
Source of functional diversity
estimated to produce around 100,000 different proteins (Keren et al. 2010). In fact, through alternative splicing, a single gene can generate more transcripts than the number of genes in an entire genome (Graveley 2001).
Many cases of alternative splicing are tissue specific, and the alternative transcript isoforms are differentially expressed in at least one tissue (Castle et al. 2008; Pan et al. 2008; Wang et al. 2008), which greatly contributes to organism complexity.
Repositories of functional elements
Introns contain several regulatory elements, highly conserved sequences, and even other genes.
Many noncoding RNAs, including microRNAs and small nucleolar RNAs (snoRNAs) are encoded in introns of protein coding genes. After transcription, the intron removed by splicing is processed to form these untranslated RNAs that play a role in a number of cellular regulatory mechanisms (Brown et al. 2008).
Introns also contain about half of the ultraconserved elements found in genes. These DNA sequences of more than 200 base pairs in length that have been perfectly conserved for more than 85 million years are thought to play a role in the regulation of early development (Bejerano et al. 2004; Visel et al. 2008).
Finally, the most common functional elements found in introns are involved in regulating splicing and transcription. Splicing regulatory elements are essential in alternative splicing to regulate splicing in a developmental and/or cell-type-specific fashion as this complexity cannot be achieved by the classical splicing signals alone, but they are also needed to recognize legitimate splice sites in general, particularly in species with long introns, and thus they must be present in the majority of introns in species like ours (Cartegni et al. 2002).
Why should we care about introns? ● 33
observed that the expression profile of intronless versions of genes differed from the original intron containing version. It is now known that introns influence many stages of mRNA metabolism besides splicing, such as transcription, editing and polyadenylation, nuclear export, translation and mRNA decay, all of which can affect the expression of a gene (Le Hir et al. 2003).
* * *
In summary, introns’ functions start before transcription and do not end with their removal from the transcript. Despite the diversity of functions they have been attributed so far, it is still possible that new, surprising functions are still to be discovered, as the new-found interest in non-coding sequences continues to produce its fruits.
Given the critical roles introns play in several mechanisms in the cell, it is expected that selection modulates their evolution. Intron spatial distribution can be under pressure to maximize NMD (Lynch and Kewalramani 2003), intron size under selection, for instance, for its effect on recombination (Duret 2001), and intron sequence influenced by the great variety of regulatory motifs and other functional elements introns harbor.
References ● 35
References
Alberts B, Johnson A, Lewis J, Raff M, Roberts K, Walter P. 2002. Molecular Biology of the Cell. 4th ed. Garland Science.
Aloni Y, Dhar R, Laub O, Horowitz M, Khoury G. 1977. Novel mechanism for RNA maturation: the leader sequences of simian virus 40 mRNA are not transcribed adjacent to the coding sequences. Proc. Natl. Acad. Sci. U.S.A. 74: 3686-3690.
Basu MK, Rogozin IB, Deusch O, Dagan T, Martin W, Koonin EV. 2008. Evolutionary dynamics of introns in plastid-derived genes in plants: saturation nearly reached but slow intron gain continues. Mol. Biol. Evol. 25: 111-119.
Bejerano G, Pheasant M, Makunin I, Stephen S, Kent WJ, Mattick JS, Haussler D. 2004. Ultraconserved elements in the human genome. Science. 304: 1321-1325.
Belshaw R, Bensasson D. 2006. The rise and falls of introns. Heredity. 96: 208-213. Berget SM. 1995. Exon recognition in vertebrate splicing. J. Biol. Chem. 270:
2411-2414.
Berget SM, Moore C, Sharp PA. 1977. Spliced segments at the 5’ terminus of adenovirus 2 late mRNA. Proc. Natl. Acad. Sci. U.S.A. 74: 3171-3175.
Breathnach R, Mandel JL, Chambon P. 1977. Ovalbumin gene is split in chicken DNA. Nature. 270: 314-319.
Brown JWS, Marshall DF, Echeverria M. 2008. Intronic noncoding RNAs and splicing. Trends in Plant Science. 13: 335-342.
Calvin K, Li H. 2008. RNA-splicing endonuclease structure and function. Cell. Mol. Life Sci. 65: 1176-1185.
Cannone JJ, Subramanian S, Schnare MN, Collett JR, D’Souza LM, Du Y, Feng B, Lin N, Madabusi LV, Müller KM, et al. 2002. The comparative RNA web (CRW) site: an online database of comparative sequence and structure information for ribosomal, intron, and other RNAs. BMC Bioinformatics. 3: 2.
Castle JC, Zhang C, Shah JK, Kulkarni AV, Kalsotra A, Cooper TA, Johnson JM. 2008. Expression of 24,426 human alternative splicing events and predicted cis regulation in 48 tissues and cell lines. Nat. Genet. 40: 1416-1425.
Cech TR. 1986. The generality of self-splicing RNA: relationship to nuclear mRNA splicing. Cell. 44: 207-210.
Cech TR, Bass BL. 1986. Biological catalysis by RNA. Annu. Rev. Biochem. 55: 599-629. Chow LT, Gelinas RE, Broker TR, Roberts RJ. 1977. An amazing sequence arrangement
at the 5’ ends of adenovirus 2 messenger RNA. Cell. 12: 1-8.
Coulombe-Huntington J, Majewski J. 2007. Characterization of intron loss events in mammals. Genome Res. 17: 23-32.
Doel MT, Houghton M, Cook EA, Carey NH. 1977. The presence of ovalbumin mRNA coding sequences in multiple restriction fragments of chicken DNA. Nucleic Acids Res. 4: 3701-3713.
Dunn AR, Hassell JA. 1977. A novel method to map transcripts: evidence for homology between an adenovirus mRNA and discrete multiple regions of the viral genome. Cell. 12: 23-36.
Duret L. 2001. Why do genes have introns? Recombination might add a new piece to the puzzle. Trends Genet. 17: 172-175.
Felsenstein J. 1974. The evolutionary advantage of recombination. Genetics. 78: 737-756.
Fujishima K, Sugahara J, Tomita M, Kanai A. 2010. Large-scale tRNA intron transposition in the archaeal order Thermoproteales represents a novel mechanism of intron gain. Mol. Biol. Evol. 27: 2233-2243.
Gerstein MB, Bruce C, Rozowsky JS, Zheng D, Du J, Korbel JO, Emanuelsson O, Zhang ZD, Weissman S, Snyder M. 2007. What is a gene, post-ENCODE? History and updated definition. Genome Res. 17: 669-681.
Gilbert W. 1978. Why genes in pieces? Nature. 271: 501.
References ● 37
Gruss P, Lai CJ, Dhar R, Khoury G. 1979. Splicing as a requirement for biogenesis of functional 16S mRNA of simian virus 40. Proc. Natl. Acad. Sci. U.S.A. 76: 4317-4321.
Haugen P, Simon DM, Bhattacharya D. 2005. The natural history of group I introns. Trends Genet. 21: 111-119.
Le Hir H, Nott A, Moore MJ. 2003. How introns influence and enhance eukaryotic gene expression. Trends Biochem. Sci. 28: 215-220.
Hoshina R, Imamura N. 2009. Phylogenetically Close Group I Introns with Different Positions among Paramecium bursaria Photobionts Imply a Primitive Stage of Intron Diversification. Molecular Biology and Evolution. 26: 1309 -1319. Hsu MT, Ford J. 1977. Sequence arrangement of the 5’ ends of simian virus 40 16S
and 19S mRNAs. Proc. Natl. Acad. Sci. U.S.A. 74: 4982-4985.
Keren H, Lev-Maor G, Ast G. 2010. Alternative splicing and evolution: diversification, exon definition and function. Nat. Rev. Genet. 11: 345-355.
Kitchingman GR, Lai SP, Westphal H. 1977. Loop structures in hybrids of early RNA and the separated strands of adenovirus DNA. Proc. Natl. Acad. Sci. U.S.A. 74: 4392-4395.
Klessig DF. 1977. Two adenovirus mRNAs have a common 5’ terminal leader sequence encoded at least 10 kb upstream from their main coding regions. Cell. 12: 9-21.
Lambowitz AM, Zimmerly S. 2004. Mobile group II introns. Annu. Rev. Genet. 38: 1-35.
Lewis JB, Anderson CW, Atkins JF. 1977. Further mapping of late adenovirus genes by cell-free translation of RNA selected by hybridization to specific DNA fragments. Cell. 12: 37-44.
Lim LP, Burge CB. 2001. A computational analysis of sequence features involved in recognition of short introns. Proc. Natl. Acad. Sci. U.S.A. 98: 11193-11198. Luco RF, Pan Q, Tominaga K, Blencowe BJ, Pereira-Smith OM, Misteli T. 2010.
Lykke-Andersen J, Aagaard C, Semionenkov M, Garrett RA. 1997. Archaeal introns: splicing, intercellular mobility and evolution. Trends Biochem. Sci. 22: 326-331.
Lynch M. 2006. The origins of eukaryotic gene structure. Mol. Biol. Evol. 23: 450-468. Lynch M, Kewalramani A. 2003. Messenger RNA surveillance and the evolutionary
proliferation of introns. Mol. Biol. Evol. 20: 563-571.
Marx JL. 1978. Gene structure: more surprising developments. Science. 199: 517-518. Marx JL. 1977. Viral messenger structure: some surprising new developments.
Science. 197: 853-923.
Michel F, Jacquier A, Dujon B. 1982. Comparison of fungal mitochondrial introns reveals extensive homologies in RNA secondary structure. Biochimie. 64: 867-881.
Pan Q, Shai O, Lee LJ, Frey BJ, Blencowe BJ. 2008. Deep surveying of alternative splicing complexity in the human transcriptome by high-throughput sequencing. Nat. Genet. 40: 1413-1415.
Patel AA, Steitz JA. 2003. Splicing double: insights from the second spliceosome. Nat. Rev. Mol. Cell Biol. 4: 960-970.
Perry RP. 1976. Processing of RNA. Annu. Rev. Biochem. 45: 605-630.
Rodríguez-Trelles F, Tarrío R, Ayala FJ. 2006. Origins and evolution of spliceosomal introns. Annu. Rev. Genet. 40: 47-76.
Rogers J. 1978. Genes in pieces. New Scientist. 5 January: 18-20.
Roy SW, Gilbert W. 2006. The evolution of spliceosomal introns: patterns, puzzles and progress. Nat. Rev. Genet. 7: 211-221.
Sambrook J. 1977. Adenovirus amazes at Cold Spring Harbor. Nature. 268: 101-104. Schwartz SH, Silva J, Burstein D, Pupko T, Eyras E, Ast G. 2008. Large-scale
comparative analysis of splicing signals and their corresponding splicing factors in eukaryotes. Genome Res. 18: 88-103.
References ● 39
Stoddard BL. 2005. Homing endonuclease structure and function. Q. Rev. Biophys. 38: 49-95.
Tilgner H, Nikolaou C, Althammer S, Sammeth M, Beato M, Valcárcel J, Guigó R. 2009. Nucleosome positioning as a determinant of exon recognition. Nat. Struct. Mol. Biol. 16: 996-1001.
Valadkhan S, Jaladat Y. 2010. The spliceosomal proteome: at the heart of the largest cellular ribonucleoprotein machine. Proteomics. 10: 4128-4141.
Vicens Q, Cech TR. 2006. Atomic level architecture of group I introns revealed. Trends Biochem. Sci. 31: 41-51.
Visel A, Prabhakar S, Akiyama JA, Shoukry M, Lewis KD, Holt A, Plajzer-Frick I, Afzal V, Rubin EM, Pennacchio LA. 2008. Ultraconservation identifies a small subset of extremely constrained developmental enhancers. Nat. Genet. 40: 158-160. Wang ET, Sandberg R, Luo S, Khrebtukova I, Zhang L, Mayr C, Kingsmore SF, Schroth GP, Burge CB. 2008. Alternative isoform regulation in human tissue transcriptomes. Nature. 456: 470-476.
Wang Z, Burge CB. 2008. Splicing regulation: from a parts list of regulatory elements to an integrated splicing code. RNA. 14: 802-813.
Will CL, Lührmann R. 2001. Spliceosomal UsnRNP biogenesis, structure and function. Curr. Opin. Cell Biol. 13: 290-301.
“All models are wrong but some are useful.”
George E. P. Box, 1979.
P
UBLICATIONI
Intronic mutational constraints in Primates
Olga Fernando1,2, Arcadi Navarro1,3,4
1
Institut de Biologia Evolutiva (CSIC-UPF), Departament de Ciències Experimentals i de la Salut, Universitat Pompeu Fabra, Barcelona, Spain.
2Instituto de Tecnologia Química e Biológica, Universidade Nova de Lisboa, Oeiras, Portugal.
3
National Institute for Bioinformatics, Universitat Pompeu Fabra, Barcelona, Spain. 4
Institució Catalana de Recerca i Estudis Avançats (ICREA). Catalonia, Spain.
Intronic mutational constraints in Primates ● 45
ABSTRACT
Introns are known to contain a variety of functional elements, the most common being related with splicing and transcription. Many of them are present at variable locations within the intron, have sequence motifs with low information content, and act in a context dependent way, which difficult their identification and characterization. In the present study we look at the frequency of substitutions along human-chimpanzee-macaque orthologous introns in order to define regions in which these elements are more likely to occur. We find a clear sign of the core splicing elements present in the first and last few base pairs of introns, but also a significant signal of the presence of other conserved elements, most likely related to splicing, up to 400 bp from the closest splice site. We show that first introns, defined as the 5’-most intron in the gene, form a separate class with a distinct substitution pattern and biological role. In these introns conservation extends for several kilobases from the donor splice site, most likely due to the presence of elements involved in transcription. The regions here described can be used for defining target regions when studying functional elements present in introns (either computational scans of over-represented motifs or functional experiments), and for selecting intronic regions in studies using introns as neutrally evolving sequences, from which these more conserved regions should be excluded.
INTRODUCTION
splicing signals – 5’ splice site, branch site, polypyrimidine tract (PPT), and 3’ splice site – contain only about half of the information necessary to locate even short human introns (Lim & Burge 2001). Much of the other half of the information is expected to come from a large variety of much harder to identify short cis-acting sequence elements.
These splicing regulatory elements (SREs) are located at variable distances from splice sites (SSs) in both introns and exons, and enhance or inhibit splicing in a context dependent way (i.e. the same element can act as an enhancer or an inhibitor depending on its location) (Wang & Burge 2008). This complex regulation of splicing together with the low information content of their motifs make it hard to locate SREs accurately, despite their high frequency in human genes (Fairbrother et al. 2002). Defining regions in which these elements are more likely to occur would facilitate their study with both experimental approaches and computational screens for overrepresented motifs.
The presence of functional elements should affect sequence conservation, which in turn could be used to predict regions where they are more likely to be found. In this study, we take advantage of levels of conservation along primate introns to locate highly conserved regions that are more likely to be of functional relevance.
We focus on introns because little attention has been given to intronic SREs in comparison with exonic elements (Sorek and Ast 2003) and, more importantly, because introns may contain higher proportion of SREs, just like they contain the great majority of sequence information at splice junctions (Stephens and Schneider 1992).
Intronic mutational constraints in Primates ● 47
reflect the presence of these and possibly other unidentified functional elements in introns. Additionally, knowing which regions within introns have higher probability of containing functional elements is also of extreme importance for population genetics, historical inference, and other studies that use introns as neutrally evolving sequences (Hare and Palumbi 2003).
MATERIALS AND METHODS
Genomic Sequences and Gene Annotations
Whole genome DNA sequences for human (hg18), chimpanzee (panTro2) and macaque (rheMac2), together with chimpanzee and macaque sequence quality scores, were downloaded from the UCSC Genome Browser (http://genome.ucsc.edu/).
Human gene annotations and one-to-one orthology information were obtained from Ensembl (http://www.ensembl.org/) release 48.
Gene Alignments
Full sequences of genes with at least one intron in the human gene annotation were extracted from the corresponding chromosome sequence file of each species according to the one-to-one orthology information. Nucleotides with quality scores of less than 40 were masked in the chimpanzee and macaque gene sequences, which leaves a high confidence sequence with an error rate of less than 1/10,000. A three-species alignment was then produced with TBA (Blanchette et al. 2004) for each gene.
Data Filtering
exons) was chosen to represent the gene. As a further measure to ensure that each locus is present only once in the final dataset, overlapping genes were excluded from the analysis.
In order to avoid possible annotation errors, genes with incorrect splice sites, coding sequences (CDS) not multiple of three, without a start or a stop codon, with non-sense mutations or with introns smaller than 20 bp5, were excluded. Additionally, in genes suspected to have incomplete annotation because they are missing a 5’ or 3’ UTR, the first or last intron of the gene, respectively, was excluded to avoid possible misclassifications in the first, last and single intron classes.
Finally, introns whose aligned chimpanzee or macaque sequence contained more than 50% of Ns and/or gaps were excluded as a measure to avoid possible false orthology, leaving 9,106 genes with 74,756 introns for analysis.
Data Analysis and Plotting
We studied introns in a position-per-position basis. Each position along an intron was labeled as the distance of that nucleotide from the closest splice site (SS). The total number of introns in which that nucleotide was present in our alignments was counted (alignment columns with Ns or gaps were deemed uninformative) and the percentage of introns in which at least one of the species’ sequence differed from humans at that position was measured. That percentage constitutes an estimate of the degree of conservation of each nucleotide along an intron.
Fisher's exact test was performed with the R (R Development Core Team 2009) function fisher.test and the resulting estimates of the odds ratio and p-value under a two-sided alternative hypothesis were used to produce Figure 4 and Figure 6. The number of substitutions observed in a given window of size k is simply the sum of the
5
Intronic mutational constraints in Primates ● 49
number of substitutions observed for each of the k nucleotides in that window. To account for multiple comparisons resulting from testing several windows on the same intron classes, p-values were conservatively adjusted using the Bonferroni correction. The significance thresholds for the 50, 100 and 500 bp window analyses were, respectively, 0.05, 0.01 and 0.001, accommodating for the fact that counts for wider windows will tend to be higher – as a result of being the sum of a higher number of observations/nucleotides – and thus yield smaller p-values.
Sequence logos (Schneider and Stephens 1990) were created with WebLogo (Crooks et al. 2004) from intronic sequence aligned at the closest SS.
RESULTS
Conservation at the ends of introns extends up to 400 bp
The percentage of substitutions observed in human-chimpanzee-macaque orthologous introns is shown up to 1 kb from the SSs in Figure 2. A low percentage of introns with substitutions at a given position implies that the nucleotide at that location has been conserved along the evolution of the three species in almost all the introns, independently of what that nucleotide is.
Two general patterns standout in Figure 2: the 3’ and 5’ ends of introns are approximately symmetrical, except for the ~100 bp closest to the nearest SS, and; after a sharp initial increase, the number of substitutions continues to accumulate steadily up to 400 bp towards the center of introns, when it stabilizes.
(left y-axis in Figure 3, measured as the percentage of introns without substitutions, which is the complement of the percentage of introns with substitutions in the y-axis of Figure 2). Only the human sequence logos are shown in Figure 3, since they are identical to the chimpanzee and macaque (and previously published (e.g. Stephens & Schneider 1992) human) logos. Thus, this striking relationship between the two measures is actually present in all three species.
Figure 2 Distribution of substitutions in the first and last 1,000 bp of introns. Positions along the intron
are given as a distance from the closest SS, either the donor (red) or the acceptor (blue) SS. The inset
shows a close-up of the extreme-most 70 bp of introns; grey was used when the two colors overlapped.
Intronic mutational constraints in Primates ● 51
Figure 3 Conserved motifs in human intron ends and sequence conservation in the three species
(human, chimpanzee and macaque). The total height of each stack of letters corresponds to the amount
of information at that position measured in bits (y-axis on the right). Within each stack letters are sorted
so that the most frequent appear on top, and their height within the stack is proportional to their
relative frequency. Black dashes mark the percentage (y-axis on the left) of introns with the same
nucleotide in the three species (regardless of what the actual base, A, C, T or G, is) in the first ten and
last 30 nucleotides of introns.
First introns have a different substitution profile
Because first introns are reported to have more regulatory elements than other introns (Majewski and Ott 2002; Keightley and Gaffney 2003) and have been shown to present different substitution rates than other introns (Gazave et al. 2007) we looked at their substitution profile separately. Contrary to the pattern seen with all introns, in first introns, after the sharp increase within the first 50 bp, the number of substitutions starts dropping until, at around 750 bp from the 5’ SS, it begins to increase slowly (Figure 5, top panel, and Figure 4, “1st” intron class).
Intronic mutational constraints in Primates ● 53
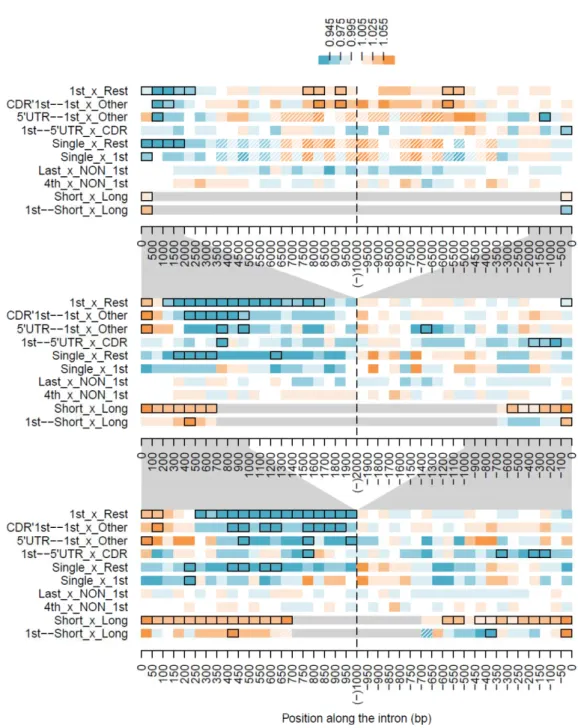
Figure 4 Differences in the number of substitutions in consecutive windows along introns belonging to
several classes. The number of substitutions in 500 (top panel) 100 (middle panel) and 50 bp windows
(bottom panel) is compared with the subsequent window (left of the dashed vertical line) or previous
window (right of the dashed vertical line). The magnitude of the differences, represented by the odds
ratio (see Material and Methods), are color coded according to the thresholds indicated in the figure
legend. Windows colored in blue have fewer substitutions than the contiguous window they were
compared to and windows colored in orange have more substitutions. Black borders were drawn around
windows with significant differences according to Fisher's exact test. Windows which could not be
studied (involving short introns) were colored grey, and windows with less than a mean of 100 intron
alignments were hatched. Grey polygons between panels emphasize the overlap in the x-axes. As in
previous plots, distance from the acceptor SS is given in negative values. Intron classes: All, all introns in
the study; Long, introns longer than 1455 bp; Short, introns shorter than 1456 bp; 1st, the first intron in
a gene; 1st_long, first intron in a gene if longer than 1455 bp; 1st_short, first intron in a gene if shorter
than 1456 bp; 1st_CDR, first intron in a gene if located in the coding region; 1st_5'UTR, first intron in a
gene if located in the 5’ UTR; CDR'1st_other, the first intron found in the coding region but not first in
the gene; 5'UTR_other, introns in the 5’ UTR other than the first; 4th, the fourth intron in the gene; Last,
last intron in the gene; Single, introns from genes with only two exons. Single introns were not included
in the first or the last intron classes.
At their 3’ end, first introns are not strikingly different from other introns (Figure 5, top panel, and Figure 6, “1st_x_Rest” series), except for a tendency for higher number of substitutions, that is also present, and more evident, in the central part of large (> 8 kb long) first introns.
“CDR’1st_other” intron classes), and there are significant differences between these two classes (Figure 6, “CDR’1st—1st_x_Other”).
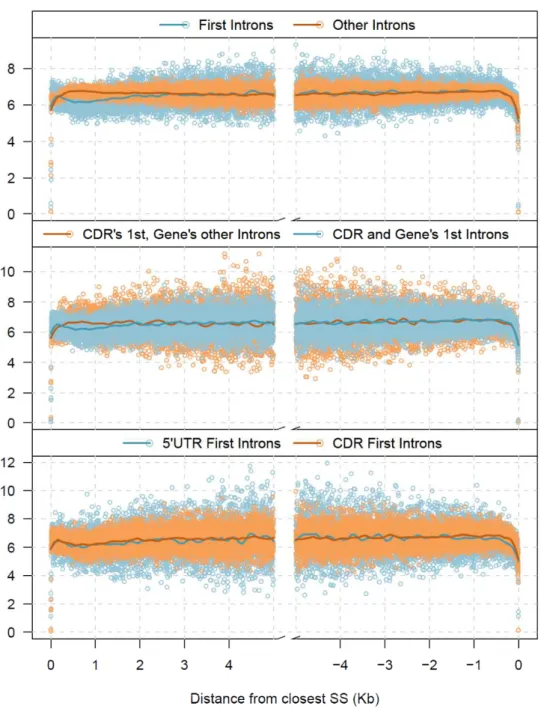
Figure 5 Distribution of substitutions along the first and last 5 Kb of introns. On the top panel introns
Intronic mutational constraints in Primates ● 55
introns. On the middle panel only the first introns in the CDR are shown, separated into two classes
depending on whether or not they are also the first intron in the gene. On the bottom panel first introns
of genes are separated according to their location, the 5’UTR or the CDR. Open circles represent the raw
data, one circle each bp, to which a LOESS curve was fitted.
Another possibility was that first introns in the 5’ UTR showed a different pattern from those in the CDR, perhaps common to all the introns in the 5’ UTR. As shown in the bottom panel of Figure 5, their substitution pattern is very similar to that of CDR first introns that are also gene first introns, except for the 3’ end which shows significantly less substitutions (Figure 6, “1st—5’UTR_x_CDR”). Moreover, 5’ UTR first introns (which, by definition, are also gene first introns) are different from other introns in the 5’ UTR (Figure 6, “5’UTR—1st_x_Other”).
Short introns evolve faster
As done by other authors (Haddrill et al. 2005; Gazave et al. 2007), we classified introns as short or long according to the median length of all the introns studied. In our current dataset, that median was 1,455 bp, which of course differs from the median in other organisms. As when all introns were considered, in both short and long intron classes there is an increase in the number of substitutions up to 400 bp from each SS (Figure 4, “Short” and “Long”), but when compared to each other, short introns exhibit significantly more substitutions in virtually all comparable windows along their length (Figure 6, “Short_x_Long”).
Figure 6 Differences in the number of substitutions in equivalent windows of distinct classes of introns.
Plot annotations are as in Figure 4. Comparisons: 1st_x_Rest, the first introns in a gene compared with
introns in other positions along the gene; CDR'1st--1st_x_Other, from the first introns found in the
coding region those that are also the first intron in the gene compared with those that are not (1st_CDR
vs CDR'1st_other); 5'UTR--1st_x_Other, from the introns found in the 5’ UTR those that are the first
Intronic mutational constraints in Primates ● 57
first introns in the gene located in the 5’ UTR compared with those located in the CDR (1st_5'UTR vs
1st_CDR); Single_x_Rest, single introns compared to all the other introns; Single_x_1st, single introns vs
first introns in the gene; last_x_NON_1st, last introns in the gene compared with the other introns in the gene except first; 4th_x_NON_1st, fourth intron in the gene compared with the other introns in the
gene except first; Short_x_Long, introns shorter than 1456 bp compared with introns longer than 1455
bp; 1st--Short_x_Long, from the first intron in a gene those shorter than 1456 bp vs those longer than
1455 bp.
Other intron classes
The first kilobases in single introns are more conserved than in the rest of the introns studied, including first introns (Figure 6, “Single_x_Rest” and “Single_x_1st”). In fact, although few significant differences are found between single and first introns, single introns don’t even show the higher number of substitutions in the initial 200 bp typical of first introns when compared to other introns.
Last introns do not differ significantly from other non first introns in the gene, as expected for a random non first intron, such as, for example, the fourth intron in the gene (Figure 6, “Last_x_NON_1st” and “4th_x_NON_1st”). Still, last introns longer than 3 kb seem to accumulate fewer substitutions in their central portion.
DISCUSSION
In these first and last 400 bp, the percentage of introns with substitutions increases gradually with the distance to the closest SS, except for the SS neighboring nucleotides where the increase is steep. Looking at intron sequence conservation at single base pair resolution, we see that this sharp increase and the high conservation in the first 6 and last 20 bp of an intron are explained by the presence of core splicing motifs that are shared by the three species (Figure 3).
Due to its variable distance from the 3’ SS, the core splicing motif corresponding to the branch site is not apparent in our sequence logos. Nevertheless, there is a clear local decrease in the number of substitutions upstream of, and marginally overlapping, the PPT motif (inset of Figure 2, and Figure 3) which almost perfectly coincides with the reported preferential location of the branch site 18-37 nucleotides upstream of the 3' SS (Green 1986). Likewise, the several SREs, which are also present at variable distance from the SSs, are expected to increase sequence conservation at their preferred locations.
Accordingly, we interpret the slow increase in the number of substitutions following the core splicing signals as the result of a gradual decrease in the combined frequency of distinct SREs. In fact, both SREs (Majewski and Ott 2002) and intronic sequences disfavoring nucleosome binding (Schwartz et al. 2009) are expected to have higher frequency close to the SSs. Two not necessarily mutually exclusive scenarios can explain the observed pattern. If the majority of the motifs decrease in frequency with the distance to the SS this would produce the gradual decrease in conservation we found. Alternatively, the same result can be obtained if different SREs have a frequency peak at different distances from the SS but there is a negative correlation between the distance to the SS and the number of SREs that peak at that distance.