i
DO METAL TOLERANCE TRAITS EXPLAIN SPATIAL
DISTRIBUTION PATTERNS IN METALLICOLOUS
VASCULAR PLANT SPECIES?
Juan Carlos Arias Jimenez
Orientadora
Profª Alessandra Rodrigues Kozovits
Co-orientadora
Profª Maria Cristina Teixeira Braga Messias
Dissertação apresentada ao Programa de Pós-Graduação em Ecologia de Biomas Tropicais do Instituto de Ciências Exatas e Biológicas da Universidade Federal de Ouro Preto como requisito parcial para obtenção do Título de Mestre em Ecologia.
OURO PRETO
ii
iii
FUNDAÇÃO UNIVERSIDADE FEDERAL DE OURO PRETO
Reitor
Prof. Marcone Jamilson Freitas Souza
Vice-Reitora
Profª Célia Maria Fernandes Nunes
PRÓ-REITORIA DE PESQUISA E PÓS-GRADUAÇÃO
Pró-Reitor de Pesquisa e Pós-Graduação
Prof. Fábio Faversani
Pró-Reitor Adjunto de Pesquisa e Pós-Graduação
Prof. Alberto de Freitas Castro Fonseca
PROGRAMA DE PÓS-GRADUAÇÃO EM ECOLOGIA DE BIOMAS TROPICAIS
Coordenador
Prof. Sérvio Pontes Ribeiro
Vice-Coordenadora
iv
A696d Arias Jimenez, Juan Carlos.
Do metal tolerance traits explain spatial distribution patterns in metallicolous vascular plant species [manuscrito] / Juan Carlos Arias Jimenez.
- 2016.
52f.: il.: color; grafs; tabs; mapas.
Orientadora: Profa. Dra. Alessandra Rodrigues Kozovits. Coorientadora: Profa. Dra. Maria Cristina Teixeira Braga Messias.
Dissertação (Mestrado) - Universidade Federal de Ouro Preto. Instituto de Ciências Exatas e Biológicas. Departamento de Biodiversidade, Evolução e Meio Ambiente. Programa de Pós-graduação em Ecologia de Biomas Tropicais.
Área de Concentração: Evolução e Funcionamento de Ecossistemas.
1. Plantas - Efeito dos metais. 2. Grupos funcionais de plantas. 3. Campos ferruginosos (cangas). 4. Distribuição espacial. I. Kozovits, Alessandra Rodrigues. II. Messias, Maria Cristina Teixeira Braga. III. Universidade Federal de Ouro Preto. IV. Titulo.
CDU: 581.9:669-11
vi
vii
Agradecimentos
À Omaira, Wilmer e Monica, por ser meu apoio, meu exemplo de vida. À Elena, simplesmente por existir.
À minha orientadora Alessandra R. Kozovits e a minha co-orientadora Maria Cristina T. Braga Messias pelos ensinamentos e confiança. À professora Mariângela Garcia Praça-Leite pelo apoio no desenvolvimento desta pesquisa.
Ao Programa de Pós-Graduação em Ecologia de Biomas Tropicais (PPGBT) e à Universidade Federal de Ouro Preto (UFOP) pelo fundamental apoio. À Organização dos Estados Americanos (OEA) e o Grupo Coimbra de Universidades Brasileiras (GCUB).
Aos professores Fernando A. de Oliveira e Silveira, e Hildeberto Caldas de Souza pelas contribuições na revisão do manuscrito.
Aos meus amigos do DETRAN, Helio, Bráulio, Girlei, Niko, Sapo, Joelson, Carlos, Sergio e Daniel, imprescindíveis no campo.
Aos meus amigos no Laboratório de Geoquímica Ambiental (LGqA): Adriana Trópia, Antônio Celso, Leonardo e Maurílio Figueiredo.
À minha equipe de campo, sempre dispostas a ajudar: Bruna V. Tavares, Mariana Dairel e Adriana Diniz.
A meus companheiros do Laboratório de Ecofisiologia Vegetal (ICEB-UFOP) Dani Boanares, Antonella Tonidandel e Iuri Martins pela boa convivência.
Aos professores Jorge Lena, Ricardo Soares, Silvia Penna, Hermínio A. Nalini e Maria Augusta Fujaco pelos novos conhecimentos.
Aos amigos que incondicionalmente me apoiaram durante este tempo:
Eduardo e Breno (Filho); Fabricio, Simone, Rejane, Isis, André (os “Dame Casino”);
Christ, Ivon, Patricia, Cesar, Jaqeline, Ivette, Claudia, Bruno, Viviane, Frederico,
Pedro, Vinicius “Jirafais”, Vinicius “Sako”, Claudio “Dizispero”, Gustavo “Bolshoi”, “Napraça”, Pedro “Sarakura”. Aos amigos em Cuiabá, Vitória, Rio, BH, e muito
ix
Table of Contents
Abstract ... xii
Resumo ...xiii
Introduction ... 1
Hypothesis ... 2
Materials and Methods ... 2
Study Area ... 2
Plant species and sampling method ... 3
Sampling and foliar chemical analysis ... 5
Measures of spatial dispersion patterns ... 6
Statistical analysis ... 6
Results ... 7
Species inventory ... 7
Soil particle-size distribution. ... 8
Total concentration of chemical elements in soils. ... 8
Foliar concentration of chemical elements. ... 9
Multivariate analysis. ... 10
Plant species distribution ... 14
Dispersion indices. ... 14
Spatial distribution and foliar concentration relationship ... 15
Discussion ... 17
Is there a dominant functional group between Al-accumulators and non-accumulators? ... 17
Is there a relationship between local spatial distribution and metal tolerance traits? ... 18
Considerations on some species as prospects for ecological modelling ... 20
Conclusions ... 21
Bibliography ... 22
Appendix ... 29
x
List of figures
Figure I.Study area located in Serra da Brigida, Minas Gerais, Brazil………….….3
Figure II. Species richness distribution across the study area………...7
Figure III. Soil particle size distribution (with values expressed as percentages)....8
Figure IV. Average foliar concentration of 15 chemical elements..…..………10
Figure V. Diagram of ordination showing the first two axes of a principal component analysis (PCA) of foliar concentration of different chemical elements in the 17
studied vascular plant species……….11
Figure VI. Concentration of Al, Ba, Sr and Ti between Al accumulators and
non-accumulators……….……….…………....12
Figure VII. Concentration of the “Macronutrients” Ca, K and P between Al accumulators and non-accumulators…..………13
Figure VIII. Group ordination among two functional strategies by Non-Metric
Dimensional Scaling (NMDS)……….…….…14
Figure IX. Density distribution of Al-accumulators functional group inversely related to foliar Al concentrations..………...………...………....15
Figure X. Density distribution of T. heteromalla versus species richness…..…….16
Figure XI. Density (m2) compared in Al-accumulators and non-accumulators
functional groups………17
List of tables
Table I.Species list……….4
Table II. Soil mean concentration of selected chemical elements………….……….9
Appendix list
xi
Figure II-A. Plant material for foliar element concentration analysis: E. microphyllum (left, superior); Ouratea sp. (right, superior); E. erythropappus (left, inferior); B. variabilis (right, inferior)…………...………30
Figure III-A. Plant material for foliar element concentration analysis: M. corallina (left, superior); T. laniflora (right, superior); B. reticularia (left, inferior); M. splendens
(right, inferior)...……31
Figure IV-A. Plant material for foliar element concentration analysis: M. marginata (left, superior); H. campestris (right, superior); A. rotunda (left, inferior); Myrsine sp.
(right, inferior)………...…..32
Table I-A–Soil particle size distribution by percentage (%)………...………33
Table II-A - Foliar average concentration of some chemical elements on 17 selected vascular plant species………..………...……….34
Table III-A. Dispersion indices……….……….…………..35
Figure V-A. Spatial distribution of B. reticularia (left, superior); B. variabilis (right, superior); M. corallina (left, inferior) and M. marginata (right, inferior) across the
study area……….………..………...36
Figure VI-A. Spatial distribution of T. heteromalla across the study area.…...37
Figure VII-A. Spatial distribution of T. laniflora across the study area.…………..37
Figure VIII-A. Surface matrix plot of T. heteromalla across the studied area. The
diagram shows a diagonal spatial pattern, also known as “bishop’s move”
neighborhood (Dale 1999)………..……….38
Figure IX-A. Surface matrix plot of T. laniflora across the studied area……...…38
Attachment list
Table I-aT. Comparative foliar concentrations of some metal elements in two
xii
Do metal tolerance traits explain spatial distribution patterns in metallicolous vascular plant species?
Abstract
Knowledge on natural spatial variation of metallicolous vascular plant species is fundamental both for theoretical (ecological, evolutionary) and applied (ecological restoration, bioremediation) purposes. However, the local variation between species and populations remains almost unexplored and it is still not known if there exists a dominant functional trait in metal tolerance or spatially related patterns among cohabiting metallicolous vascular plant species. For this reason, this study proposes to test, 1) if a dominant plant functional trait of metal tolerance can be found in ferruginous rocky ironstone outcrops, and 2) if there are local spatial patterns related to metal tolerance traits in these metallicolous plant functional groups. Through a systematic sampling design in a continuous grid of 115 plots (10x10m2), data on plant density, distribution and foliar concentration of 25 chemical elements were collected for seventeen native vascular plant species in a rocky ironstone outcrop (also known in Brazil as Canga). Two different metal tolerance traits of foliar Al-accumulation and non-Al-accumulation were identified among the studied vascular plant species. The most of the studied species were non-accumulators, while only 3 from the same family (Melastomataceae) were Al-accumulators (including both the most and the least frequent species), suggesting a phylogenetically constrained pattern. No clear evidence of a dominant metal tolerance trait was detected among functional groups; neither on relating plant spatial patterns to strategies of accumulation or exclusion of metals and other chemical elements. Thus, other factors may explain better the spatial distribution of metallicolous vascular plant species. Possibly, the local spatial variation of the studied species and functional groups is more related to other adaptive strategies (like resilience or competence) than to eco-physiological traits of metal tolerance or avoidance.
xiii
Estratégias de tolerância a metais serão explicativas da distribuição espacial de plantas vasculares metalófitas?
Resumo
O conhecimento da variação espacial natural das plantas vasculares metalófitas é fundamental tanto para fins teóricos (ecológicos e evolutivos) quanto aplicados (restauração ecológica e biorremediação). A variação espacial local de espécies e populações metalófitas ainda permanece quase inexplorada, sendo preciso entender se existe alguma diferenciação funcional ou padrões espacialmente relacionados entre espécies de plantas vasculares metalófitas. Por esta razão, o presente estudo se propõe a testar, 1) se espécies metalófitas cohabitantes apresentam uma estratégia funcional dominante de tolerância a metais, e 2) Se a distribuição espacial de grupos funcionais de metalófitas está relacionada com estratégias de tolerância a metais. Por meio de um plano de amostragem sistematizado em uma grade contínua de 115 parcelas (10x10m2), foram amostrados dados sobre densidade, distribuição de plantas e concentração foliar de 25 elementos químicos em 17 espécies de plantas vasculares nativas de um Campo Ferruginoso, localizado noQuadrilátero Ferrífero (QF), Minas Gerais, Brasil. Entre as espécies estudadas, duas estratégias de tolerância a metais foram reconhecidas: acumuladoras de Al e não acumuladoras. Não foi detectada evidência concluinte da existência de padrões espaciais relacionados ao acúmulo de metais em folhas; nem sobre o domínio de grupos funcionais de acumuladoras ou não acumuladoras de metais. Isto sugere outro tipo de relação entre os padrões funcionais e espaciais das espécies metalófitas de plantas vasculares. Possivelmente, as variações populacionais locais são expressões mais relacionadas às capacidades adaptativas das espécies estudadas (resiliência ou competência) do que a estratégias funcionais de acumulação e exclusão de metais.
1
Introduction
Processes that structure plant communities continue to be a primary focus of plant ecological research (Rayburn et al. 2011). Among these processes, plant adaptations to extreme environments are of key interest in evolutionary biology (Broadley et al. 2001) and for the ecological modeling and restoration of degraded areas (Whiting et al. 2004). Such is the case of metallicolous plant communities related to natural metal ore formations, which are highly prone to suffer severe disturbances due to mining industry operations. Negative consequences of mining activities, however, are not restricted to vegetation, but also can reach the local biota as a whole, spreading to larger areas through the pollution of soils, atmosphere and water bodies (Salomons 1995). These widely documented processes of environmental degradation derive into the need to restore soils, vegetation cover, and the ecological balances (biotic interactions, functional processes and biogeochemical cycles) that had been disturbed or even lost. The successful management of natural metal-rich ecosystems requires not only understanding the plant species specific potential of metal tolerance, but also their patterns of natural spatial variation in order to conserve or restore these ecological balances (Baker et al. 2010; Baumbach 2012).
2
some of the main iron ore deposits worldwide subjected to mining exploitation (Jacobi & Carmo 2008; Fernandes et al. 2014; Silveira et al. 2015).
In the context of ecological modeling for the conservation and recovery of metal-rich ecosystems, Cangas vascular plant species are a highly promising prospect for understanding how natural spatial variation occurs among plant functional groups aiming to parameterize the ecological requirements for the successful ecological management of ferruginous rocky ironstone outcrops. For this reason is critically important to find the answer to these questions: 1) if a dominant plant functional strategy of metal tolerance can be found in ferruginous rocky outcrops, and 2) If there are spatial patterns related to metal tolerance strategies among plant functional groups.
Hypothesis
Among metallicolous vascular plant species in ferruginous rocky outcrops could be expected that metal excluders dominate as a whole, and that metal accumulators evidence a relationship between spatial aggregation patterns and metal concentration in foliar tissues. In that sense, two specific hypotheses were tested in this work: 1) the dominance of a functional pattern of metal tolerance among vascular plants in ferruginous rocky outcrops, and 2) local spatial distribution patterns are related to strategies of metal tolerance among metallicolous plant functional groups.
Materials and Methods
Study Area
3
vegetation islands (Simmons 1963; Jacobi et al. 2007; Vincent & Meguro 2008; Messias et al. 2013).
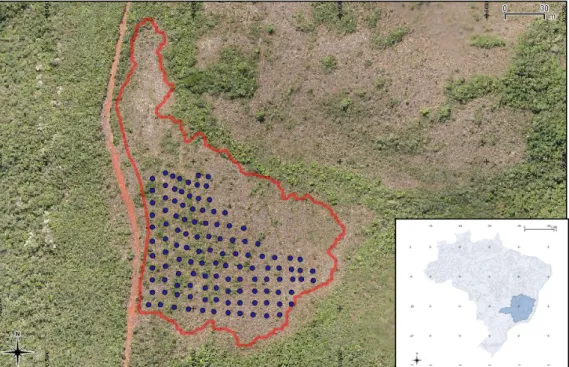
The local climate is mesothermic (Cwb according to Köppen), with a rainy summer during November-March and a dry winter (Álvares et al. 2013). A meteorological station (Watch Dog 2000) installed in the study area measured 1172mm of precipitation between February 2012 and January 2013, with an average annual temperature of 17ºC (Figueiredo et al. 2015).
Figure I. Study area (the red line represents the perimeter and blue dots represent plot corners) located in Serra da Brigida, Minas Gerais, Brazil. On the inferior right corner, a scale map (1:1000.000) of Brazil, with the intense blue area representing the state of Minas Gerais, the points indicate a grid with distances of 1000 km.
Plant species and sampling method
4
other chemical elements. From 115 plots, sixty were sampled to estimate frequency and 31 plots to estimate distribution data of seventeen native vascular plant species (all shrubs). These species were selected based on its frequency/rarity within the study area following the results on a previous phytosociological survey (Vale 2013), to satisfy the assumptions for hypothesis test. Ten frequent (I, II, III, IV, V, XI, XII, XIII, XIV, XV) and seven rare species (VI, VII, VIII, IX, X, XVI, XVII) were selected (See Table I for complete species names).
Table I. Species list by frequency categories.
Category1 Code2 Species3 Family3 Voucher4 Most
frequent species
I Tibouchina heteromalla (D. Don) Cogn. Melastomataceae 46
II Periandra mediterranea (Vell.) Taub. Leguminosae 47
III Senna reniformis (G.Don) H.S.Irwin & Barneby
Leguminosae 53
IV Diplusodon microphyllus Pohl Lythraceae 51
V Erythroxylum microphyllum A.St.-Hil. Erythroxylaceae 58
XI Baccharis reticularia DC. Compositae 62
XII Myrcia splendens (Sw.) DC. Myrtaceae 50
XIII Matayba marginata Radlk. Sapindaceae 60
XIV Heteropterys campestris A.Juss. Malpighiaceae 49
XV Alibertia rotunda (Cham.) K.Schum. Rubiaceae 48
Least frequent (rare) species
VI Ouratea sp. Ochnaceae 55
VII Eremanthus erythropappus (DC.) MacLeish
Compositae 52
VIII Byrsonima variabilis A.Juss. Malpighiaceae 61
IX Miconia corallina Spring Melastomataceae 57
X Trembleya laniflora (D. Don) Cogn. Melastomataceae 63
XVI Myrsine sp. Primulaceae 54
XVII Eremanthus incanus (Less.) Less. Compositae 56 1The order of the species names within categories does not necessarily reflect their
abundance/frequency order. 2Codes were assigned to each plant species for data ordination and simplification. 3Taxonomically accepted names were obtained from The Plant List (2010). Version 1. Published on the Internet; http://www.theplantlist.org/. 4Voucher specimens are deposited in the Herbarium "Professor José Badini" (OUPR); collection numbers correspond to B. V. Tavares.
As in Struik and Curtis (1962) the data was registered on a millimeter sheet for each sample unit (plot) with a representation scale of 1:100.
5
georeferencing all plots, with an error 3m for each coordinate (registered in DDD WGS 84).
Soil analysis
Samples for chemical and granulometric soil analyses were collected at 0-10 cm depth in 20 plots, by mixing five subsamples per plot. For granulometric analysis, soil samples of 2 Kg each were air-dried and the particles were separated by size fractions using sieves with different mesh sizes (4.0, 2.0, 1.0, 0.5, 0.25, 0.125, and 0.063 mm). After sieving, each size fraction mass was determined and the material was classified according to Wentworth (1922) nominal classes.
Concentrations of trace elements and macroelements (Al, As, Ba, Be, Bi, Ca, Cd, Co, Cr, Cu, Fe, K, Li, Mg, Mn, Ni, P, S, Ti, V, Y, Zn and Zr) in soils were determined by Inductively Coupled Plasma Optical Emission Spectrometry (ICP-OES) (Agilent 725) after total acid digestion as described by Boss and Fredeen (1999). For this analysis, it was used the soil fraction <0.063mm. The total digestion method used concentrated chlorite, nitric and fluoride acids as extractors for subsamples of 0.25g. Certified reference material (GBW 07406 soil) was used in order to validate the extraction and quantification of chemical elements.
Sampling and foliar chemical analysis
Plant material was collected in the same 20 plots selected for soil analyses. In order to perform a representative sampling for foliar element concentration analysis, the procedure was standardized by collecting mature plant leaves from the same ontogenetic phase, at the same climatic period interval (Ernst 1995; Markert 1989, 1995; Markert & Klausmeyer 1990; Kovacheva et al. 2000) (Figures I-A, II-A, III-A & IV-A in the Appendix for an example of species foliar samples). For each plant species, a sample consisted of n ≥ 30 leaves from one or more plant individuals per plot. Among 4 and 9 samples per species were obtained across the 20 plots, resulting in a total of 121 samples.
Foliar concentrations of Al, As, Ba, Be, Ca, Cd, Co, Cr, Cu, Fe, K, Li, Mg, Mn, Mo, Na, Ni, P, Pb, S, Sr, Ti, V, Y and Zn were quantified by ICP-OES. Leaf samples were washed with deionized water, dried at 60 ◦C during 48 h and re-dried at 50 ◦C
for 3 hours, prior to pre-digestion of approximately 0.3125 g of each sample on Teflon tubes with 8.750 mL HNO3 (65%) and 1.250 mL H2O2 (23%) for 14 hours,
6
minutes (with 60 min heat-up and 40 min cooldown time). The digests were checked to be clear and fully digested, then diluted to 20 ml with 18.2 mohm water (Milli-Q Plus, Millipore, Nepean, ON), and the diluted samples were analyzed by ICP-OES (Agilent 725, HP) (Zarcinas et al. 1987; Boss & Fredeen 1997).
A certified reference material (SRM 1515 Apple Leaves) from the National Institute of Standards and Technology NIST was also measured for quality assurance. The quantification limits (mg.Kg-1) are provided in Table IV (Appendix).
Measures of spatial dispersion patterns
To analyze spatial dispersion patterns of those species and functional groups identified by multivariate (PCA) and non-metric ordination analysis, were calculated seven closely related indices: Index of Dispersion (ID), Index of Cluster Size (ICS),
Green’s Index (GI), Index of Cluster Frequency (ICF), Index of Mean Crowding (IMC), Index of Patchiness (IP), and Morisita’s Index (IM). These indices, which primarily examine the deviation from a random (Poisson) distribution (Hurlbert 1990) were performed with PASSaGE software v2 (Rosenberg & Anderson 2011).
Statistical analysis
7
Results
Species inventory. Tibouchina heteromalla was the only species with 100% frequency across all sampled plots, followed by Baccharis reticularia (98%), Diplusodon microphyllus (96%), Periandra mediterranea (96%), Erythroxylum microphyllum (85%), Alibertia rotunda (78%), Matayba marginata (65%), Senna reniformis (65%), Heteropterys campestris (63%), Myrcia splendens (60%), Eremanthus erythropappus (45%), Byrsonima variabilis (41%), Myrsine sp. (41%), Miconia corallina (35%), Ouratea sp. (28%), Eremanthus incanus (33%) and Trembleya laniflora (23%). Along 31 sampled plots, 6807 individuals from the 17 studied species were recorded, with a density of 21958.06 individuals ha-1; T. heteromalla was the most abundant species, with 3232 individuals, followed by P. mediterranea (1222 individuals), D. microphyllus (556), E. microphyllum (458), B. reticularia (241), M. marginata (216), A. rotunda (183), H. campestris (164), S. reniformis (127), M. splendens (106), Myrsine sp. (83), M. corallina (76), B. variabilis (51), E. erythropappus (31), E. incanus (30), T. laniflora (18) and Ouratea sp. (13). It was also observed a gradient in species richness (R) decreasing across the spatial matrix declivity (altitudinal range of 1490-1420 masl, Figure II).
8
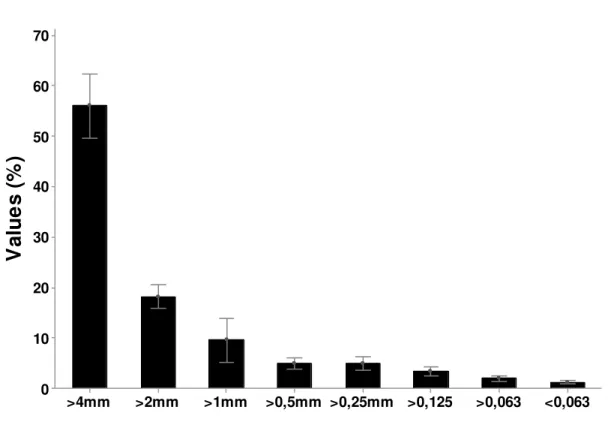
Soil particle-size distribution. The Figure III and Table I-A (Appendix) present the percentage distribution of each soil particle size class: 56.0% (>4mm), 18.2% (>2mm), 9.5% (>1mm), 4.9% (>0.5mm), 5.0% (>0.25mm), 3.4% (>0.125mm), 1.9% (>0.063mm) and 1.2% (<0.063mm).
Figure III. Soil particle size distribution (values are expressed as percentages). 95% CI for the Mean. Individual standard deviations were used to calculate the intervals.
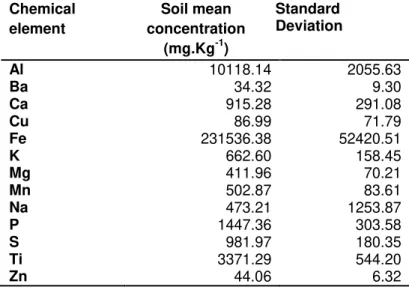
Total concentration of chemical elements in soils. Soil mean concentrations for the most of the analyzed chemical elements were under 1000 mg.Kg-1 (see Table II). From a geochemical viewpoint those chemical elements are considered as
“trace elements” (Kabata-Pendias 2011). Only Fe, Al, Ti and P presented concentrations over 1000 mg.Kg-1. Fe represents 92.22% of soil mass, followed by Al (4.22%), and Ti (1.39%).
<0,063 >0,063
>0,125 >0,25mm
>0,5mm >1mm
>2mm >4mm
70
60
50
40
30
20
10
0
V
al
u
e
s
(%
9
Table II. Soil mean concentration of the analyzed chemical elements. Standard deviations are shown as SE.
Chemical element
Soil mean concentration
(mg.Kg-1)
Standard Deviation
Al 10118.14 2055.63
Ba 34.32 9.30
Ca 915.28 291.08
Cu 86.99 71.79
Fe 231536.38 52420.51
K 662.60 158.45
Mg 411.96 70.21
Mn 502.87 83.61
Na 473.21 1253.87
P 1447.36 303.58
S 981.97 180.35
Ti 3371.29 544.20
Zn 44.06 6.32
10
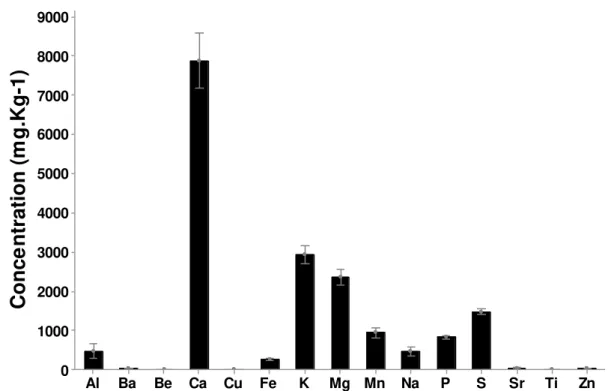
Figure IV. Average foliar concentration of 15 chemical elements. 95% Bonferroni CI for the Mean. Individual standard deviations were used to calculate the intervals.
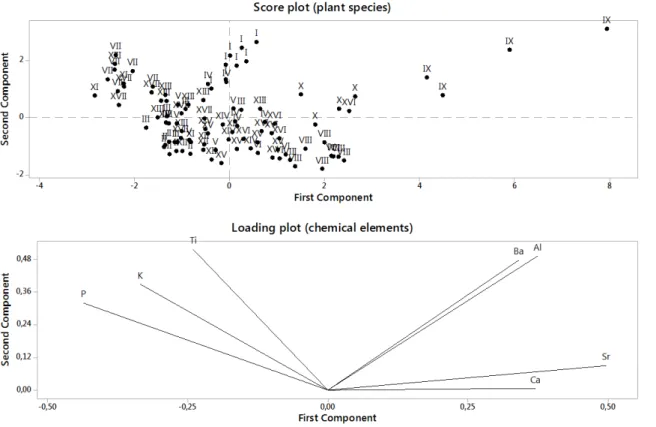
Multivariate analysis. A Principal Component Analysis (PCA) was performed to analyze the variance contribution on the foliar concentration of metals and other chemical elements (Figure V). To avoid statistical noise, those variables with low contribution weight to the most significant principal components (λ≥ 1.0) as well as the highly correlated ones were excluded after an exploratory PCA. The first two principal components explained over 64% of the cumulative total variance; with the first principal component accounting for about 45.3% and the second for 19.2% of the total variance. On the loadings, the first component reflects high values for Sr, Al, and the second component for Ti and Ba. In that sense, the first axis (PC1) was highly positively related to Sr and Al concentrations; and the second axis (PC2) was positively related to Ti and Ba concentrations. In PC1, the most positively related species were M. corallina (IX), T. laniflora (X) and T. heteromalla (I).On the other hand, B. variabilis (VIII) and Myrsine sp. (XVI) were negatively related to this axis. In PC2, the most positively related species were E. erythropappus (VII), B. reticularia (XI) and M. marginata (XIII).
By performing a t-test statistical analysis, no significant differences within (p=0.198; p=0.734) or between (p=0.185) score variances of the PCA’s first and second
11
principal components were detected. Thus, there was no statistical evidence of a major variance contribution related to these element concentration groups.
Figure V. Diagram of ordination showing the first two axes of a principal component analysis (PCA) of foliar concentration of different chemical elements in the 17 studied vascular plant species. Species codes are listed in Table I.
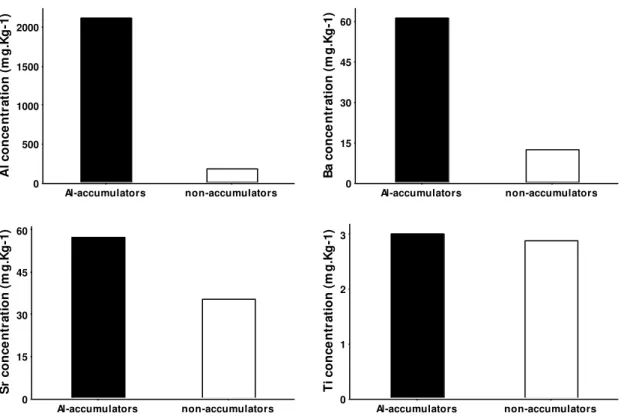
The foliar concentration of metals expressed a considerable variation between those species associated with the first, and the second principal components of the PCA. The Melastomataceae species showed a significant foliar Al accumulation pattern (over >1000 mg.Kg-1) with Al concentrations varying between three and sixty folds over the other vascular plant species (Myrsine sp., a frequent neighbor of M. corallina presented the lowest average foliar Al concentration) (see Table II-A, Appendix). The foliar concentrations of Ba (65 mg.Kg-1<), Sr (115 mg.Kg-1<) and Ti (6 mg.Kg-1<) were considerably inferior, showing higher values in Al
12
Figure VI. Average foliar concentration of Al, Ba, Sr and Ti between Al accumulators and non-accumulators.
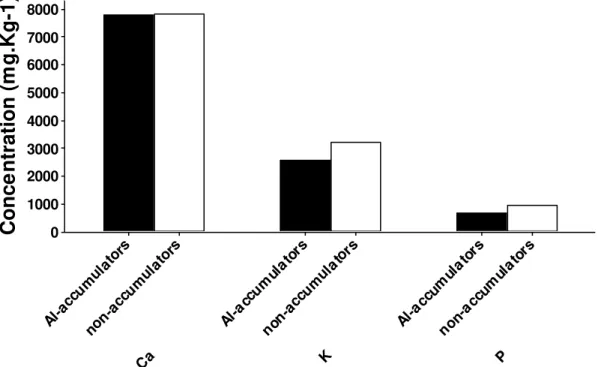
The foliar concentration of the macronutrients Ca, K, and P varied as observed in Figure VII, with higher values in non-accumulators.
13
Figure VII. Foliar concentration of the macronutrients Ca, K and P (mg.Kg-1) between Al accumulators and non-accumulators.
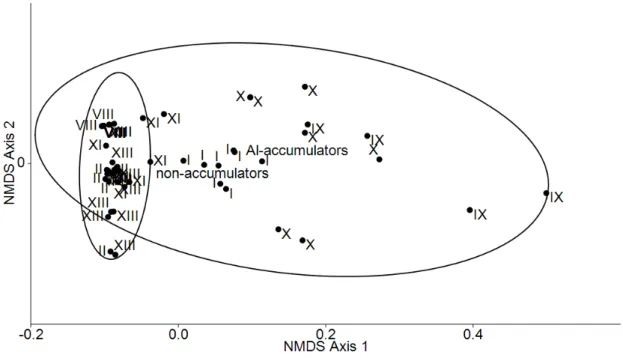
On the PCA multivariate ordination, the studied species were clearly identified with two functional groups of metal tolerance traits: Al accumulators (recognized on the first principal component) and non-accumulators (recognized on the second principal component) which were also confirmed by non-metric ordination (see Figure VIII). The pattern of Al accumulation in Melastomataceae included the most and the least frequent species across the studied area (T. heteromalla and T. laniflora respectively) which evidences a clear differentiation not only between accumulators and non-accumulating species, but also within Al accumulators.
14
Figure VIII. Functional groups ordination (for metal tolerance traits) by Non-Metric Dimensional Scaling (NMDS). Species significantly related to the first and second principal components in the PCA were selected for this analysis, were the functional groups are Al-accumulators (I, IX, X) and non-accumulators (II, VIII, XI, XIII) (see Table I for species names). Euclidean distances were used for ordination. Accumulators: plants which accumulate more than 1000 mg.Kg-1 of Al in their leaves (Jansen et al. 2002).
Plant species distribution
15
maximum coefficient value corresponded to T. heteromalla, and the minimum to T. laniflora.
Spatial distribution and foliar concentration relationship.
Multiple regression analysis: This analysis was performed by computing the species and functional group (Al-accumulators/non-accumulators) values of density (m2) and dispersion coefficients (from standardized IM) as responses in each case for the continuous predictors: foliar Al, foliar Ba, foliar Fe, foliar Sr, foliar Ti and versus species richness per plot. The idea on this analysis was to find if there exist any relationship between spatial aggregation and foliar concentrations of chemical elements (with species richness as control). Neither the foliar concentrations of Al, Sr, Ti or species richness were good predictors for functional group aggregation or for individual species aggregation. In the other hand, foliar Al was a suitable predictor for Al-accumulators density (m2) showing a decrease in foliar Al when increasing Al-accumulators functional group density (see Figure IX).
Figure IX. Density distribution of Al-accumulators functional group inversely related to foliar Al concentrations.
3000 2500
2000 1500
1000 2,0
1,5
1,0
0,5
0,0
S 0,400422 R-Sq 66,5% R-Sq(adj) 62,8%
foliar_Al
d
e
n
si
ty
(m
16
Also, species richness was a suitable predictor for density (m2) of the dominant T. heteromalla with an R-sq(adj) of 59,2% (S = 0.256423) evidencing an inversely proportional relationship between density and species richness (see Figure X).
Figure X. Density distribution of T. heteromalla versus species richness.
When observing functional groups, only for Al-accumulators the density showed a linear relation with foliar Al accumulation, while for individual species there were no linear relationship between foliar concentration of any of the chemical elements and density per plots. Al, Ba, Fe, Sr and Ti foliar concentration were not suitable predictors for individual species spatial aggregation. For the dominant T. heteromalla, species richness explained better the density distribution than foliar concentration of Al, Ba, Fe, Sr or Ti.
The average densities of Al-accumulators and non-accumulators are shown in Figure XI, in which the slightly higher density (m2) value corresponds to the non-accumulators functional group. When performing a test for equal variances (2) no
significant differences were detected among Al-accumulators and non-accumulators (p=0.275 for Multiple comparisons; p=0.248 for Levene’s Test).
17
Figure XI. Density (m2) compared in Al-accumulators and non-accumulators functional groups.
Discussion
Is there a dominant functional group between Al-accumulators and non-accumulators?
Although two functional strategies of metal tolerance (Al-accumulators and non-accumulators) were clearly identified in this study, there was no clear evidence of a dominant functional group among the studied vascular plant species, since the difference in relative abundances as in relative densities between Al-accumulators and non-accumulators was statistically not significant.
Considering the seventeen studied species only from a phylogenetic point of view, there is a dominant functional group of non-accumulators summarizing 14 species, and only 3 species (from the family Melastomataceae) being Al accumulators (including both the most and the least frequent species across the studied area). Foliar Al concentration is a phylogenetically constrained trait (Jansen et al. 2002),
non-accumulators
Al-accumulators
1,2
1,0
0,8
0,6
0,4
0,2
0,0
D
en
si
ty
(m
2)
18
and Al accumulators are apparently more frequent among tropical woody plants than in plants of other life-forms and in different regions (Metali et al. 2012).
Is there a relationship between local spatial distribution and metal tolerance traits?
Both Al-accumulators and non-accumulators species and functional groups presented clustered spatial distribution patterns, evidencing a clear departure for randomness in metallicolous vascular plant species distribution in ferruginous rocky outcrops. The large majority of species tends to aggregate in species rich systems (Perry et al. 2009).
Despite of this, no evidence of a relationship between spatial aggregation patterns and foliar concentration of metals or other chemical elements was detected for any of the studied species and functional groups. Thus, there was no relationship between local spatial distribution and metal tolerance traits in the studied metallicolous vascular plant species.
A general feature in field studies of plant distribution is that even single species may display several scales of pattern, being common to find a combination of effects like clustering at large scales and regularity at small scales (Dale 1999; Dixon 2012). In the present study, different local patterns within Al-accumulators (T. heteromalla, M. corallina) and non-accumulators (P. mediterranea, B. variabilis) were observed with random distribution within plots and clustering being globally expressed in species and functional groups distribution patterns. This seems to indicate strong heterogeneity of exogenous (climate, topography, nutrient) and/or endogeneous (life history, competition, facilitation) factors occurring inside these plots (Pelissier & Goreaud 2001).
On the relationship of density patterns with metal tolerance traits, Al-accumulators showed a density response to foliar Al concentration, which surprisingly was inversely related; this relationship was not detected in non-accumulators. This could be an expression of a physiological constraint among Al-accumulators that will require further research and experimentation to know the extent and causes of this relationship. There is evidence supporting the positive influence of Al concentration on density and richness of herbaceous vegetation in Brazilian Cerrado soils (Ruggiero et al. 2002; Amorim & Batalha 2008) although this relationship was not observed in rocky outcrops from the Iron Quadrangle (Carmo & Jacobi 2015).
García-19
Gonzalez & Clark (1989) detected differences between the distribution of M. verna and T. alpestre related to Ca, Cd, Pb and Zn in soils from the British Isles at a regional scale. Párraga-Aguado et al. (2013) founded that metal concentrations accounted for a minor role in the plant distribution of mine tailings from a Mediterranean semiarid area.
So far, two studies have tested the local spatial patterns of vascular plant species in metalliferous rocky outcrops. Ilunga et al. (2013) founded that Cu concentration was the most discriminant edaphic factor between different plant assemblages in a copper rocky outcrop from Upper Katanga, D.R.Congo; however, the same authors evidenced correlation for different edaphic factors (since they also found differences in soil properties due to horizon depth between habitats). In another study at the same geographic region, Séleck et al. (2013) identified a strong site effect in plant distribution.
Nunes et al. (2015) indicate soil properties as crucial in explaining the types and distributions of metallicolous vegetation associated with ferruginous rocky outcrops (Canga) in Carajás, eastern Brazilian Amazonia. Yates et al. (2011) similarly identified species habitat preferences associated with soil depth for banded iron plant communities in Western Australia.
This may suggest microsite constraints (restraining root development, accelerating water runoff) affecting functional group distributions (Carmo & Jacobi 2015; Carmo et al. 2016). This theory is supported by recent studies on plant traits focusing on the CSR strategy scheme (competitive, stress tolerant, ruderal) were fine-scale environmental differences explained better the distribution of distinct functional trait groups among highly diverse tropical grasslands (Negreiros et al. 2014) and were soil-related variables (depth, patch size) were the most important environmental filter influencing competitive vs. stress tolerant species proportions within an Atlantic rainforest inselberg (Paula et al. 2015).
20
The observed pattern in the present study fits into the theoretical context suggested by previous results in metalliferous rocky outcrops (Yates et al. 2011; Ilunga et al. 2013; Séleck et al. 2013; Serrano et al. 2014; Paula et al. 2015; Nunes et al. 2015; Carmo & Jacobi 2015). In addition, to the author’s knowledge this seems to be the first study to test the relationship between plant species distribution and metal tolerance traits.
Considerations on some species as prospects for ecological modelling
In this study was found that T. heteromalla was clearly the dominant species across the studied environmental matrix, being mostly aggregated when species richness and abundance decreased. This may suggest a “dominant” resilience strategy among metallicolous vascular plant species, which decreases in relation to the availability of soil resources, were competitive strategies increase (see Negreiros et al. 2014). In the other hand P. mediterranea, the second species in dominance which is remarkably a “non-accumulator” seems to show a competitive strategy, suggested by its increase in density where the species richness increases.
A similar spatial and functional pattern (to that observed in T. heteromalla) was founded in the Mediterranean Al hyperaccumulator Plantago almogravensis, which was locally limited by shrub competition, also suggesting that the species has a poor capability to compete but has expressed the ability to find refuge in geochemical islands that are too harsh for most of the other species (Serrano et al. 2014).
21
Conclusions
Two different metal tolerance traits of foliar Al-accumulation and non-accumulation were identified among the studied vascular plant species. The most of the studied species were non-accumulators, but in the terms of relative abundances there was no clear dominant group between Al-accumulators and non-accumulators in this metallicolous plant community, since the Al-accumulators (Melastomataceae) represented half of the total abundance from all inventoried taxa.
For all studied species, there was a clustered spatial pattern and there was no relationship between spatial aggregation and foliar accumulation of metals or other chemical elements. Neither between density and foliar Al in the case of non-accumulators; but in the other hand, Al-accumulators showed a (inverse) density response to foliar Al concentration, which may reflect a phylogenetically functional trait among Al-accumulators, but further field and experimental research is required to identify the extent and causes of this pattern.
22
Bibliography
Adriano, D.C. 2013. Trace elements in the terrestrial environment. Springer Science & Business Media.
Alvares, C. A., Stape, J. L., Sentelhas, P. C., de Moraes, G., Leonardo, J. & Sparovek, G. 2013. Köppen's climate classification map for Brazil. Meteorologische Zeitschrift, 22(6): 711-728.
Amorim, P.K. & Batalha, M.A. 2008. Soil chemical factors and grassland species density in Emas National Park (central Brazil). Brazilian Journal of Biology 68(2): 279–285
Baker, A.J.M. & Brooks, R.R. 1989. Terrestrial higher plants which hyperaccumulate metallic elements – a review of their distribution, ecology and phytochemistry. Biorecovery 1(2): 81–126
Baker, A.J., Ernst, W.H., van der Ent, A., Malaisse, F. & Ginocchio, R. 2010. Metallophytes: the unique biological resource, its ecology and conservational status in Europe, central Africa and Latin America. Ecology of industrial pollution. Cambridge University Press, Cambridge, 7-40.
Baumbach, H. 2012. Metallophytes and metallicolous vegetation: evolutionary aspects, taxonomic changes and conservational status in Central Europe. INTECH Open Access Publisher.
Boots, B. 2003. Developing local measures of spatial association for categorical data. Journal of Geographical Systems 5(2):139–160.
Boss, C.B. & Fredeen, K.J. 1997. Concepts, Instrumentation and Techniques in Inductively Coupled Plasma Optical Emission Spectrometry. Second Edition. The Perkin-Elmer Corporation, printed in USA.
Broadley, M. R., Willey, N. J., Wilkins, J. C., Baker, A. J., Mead, A. & White, P. J. 2001. Phylogenetic variation in heavy metal accumulation in angiosperms. New Phytologist 152(1): 9-27.
Brown, J.D. 2001. Using surveys in language programs. Cambridge: Cambridge University Press.
23
Carmo, F.F., Campos, I.C. & Jacobi, C.M. 2016. Effects of fine‐scale surface heterogeneity on rock outcrop plant community structure. Journal of Vegetation Science 27(1): 50-59.
Clemens, S., Palmgren, M.G. & Krämer, U. 2002. A long way ahead: understanding and engineering plant metal accumulation. Trends in plant science 7 (7): 309-315.
Dale, M.R.T. 1999. Spatial pattern analysis in plant ecology. Cambridge Univ. Press.
Dixon, P. 2012. Ripley's K function Encyclopedia of Environmetrics 2nd ed.
Dungan, J.L., Perry, J.N., Dale, M.R.T., Legendre, P., Citron‐Pousty, S., Fortin, M.J., ... & Rosenberg, M. 2002. A balanced view of scale in spatial statistical analysis. Ecography 25(5): 626-640.
Ernst, W.H.O. 1995. Sampling of plant material for chemical analysis. Science of the total environment 176(1): 15–24.
Ernst, W.H.O. 2006. Evolution of metal tolerance in higher plants. Forest Snow and Landscape Research 80(3): 251-274.
Fernandes, G.W., Barbosa, N.P., Negreiros, D., & Paglia, A.P. 2014. Challenges for the conservation of vanishing megadiverse rupestrian grasslands. Natureza & Conservação 12(2): 162-165.
Figueiredo, M.A., Leite, M.G.P. & Kozovits, A.R. 2015. Influence of soil texture on nutrients and potentially hazardous elements in Eremanthus erythropappus. International journal of phytoremediation 18(5): 487-493.
Fortin, M.-J., Dale, M.R.T. & ver Hoef, J. 2001. Spatial analysis in ecology. Pages 2051–2058 in A. H. El-Shaarawi and W. W. Piegorsch, editors. The encyclopedia of environmetrics. John Wiley and Sons, New York, New York, USA.
Garcia-Gonzalez, A. & Clark, S.C. 1989. The distribution of Minuartia verna and Thlaspi alpestre in the British Isles in relation to 13 soil metals. Vegetatio,84(2): 87-98.
Ginocchio, R., Carvallo, G., Toro, I., Bustamante, E., Silva, Y., & Sepúlveda, N. 2004. Micro-spatial variation of soil metal pollution and plant recruitment near a copper smelter in Central Chile. Environmental Pollution127(3): 343-352.
Greig-Smith, P. 1952. The use of random and contiguous quadrats in the study of
24
Grime, J.P. 2001. Plant strategies, vegetation processes, and ecosystem properties, 2nd edn. Wiley, Chichester
Hammer, Ø., Harper, D.A.T. & Ryan, P.D. 2001. PAST: Paleontological statistics software package for education and data analysis. Palaeontologia Electronica 4: 9. Hengl, T. 2007. A practical guide to geostatistical mapping of environmental variables (Vol. 140, No. 4, pp. 417-427).
Hurlbert, S.H. 1990. Spatial distribution of the montane unicorn. Oikos 257-271. Ilunga, EI., Séleck, M., Colinet, G., Faucon, M-P., Meerts, P. & Mahy, G. 2013. Small-scale diversity of plant communities and distribution of species niches on a copper rock outcrop in Upper Katanga, D. R. Congo. Plant Ecology and Evolution 146(2): 173–182.
Jacobi, C.M., Carmo, F.F., Vincent, R.C., Stehmann, J.R. 2007. Plant communities
on ironstone outcrops: a diverse and endangered Brazilian ecosystem. Biodiversity
& Conservation 16(7): 2185–2200.
Jacobi, C. M. & Fonseca do Carmo, F. 2008. The contribution of ironstone outcrops to plant diversity in the Iron Quadrangle, a threatened Brazilian landscape. AMBIO: A Journal of the Human Environment 37(4): 324-326.
Jacobi, C.M., Carmo, F.F., & de Campos, I.C. 2015. Iron geosystems: priority areas for conservation in Brazil. Mining in Ecologically Sensitive Landscapes 55. Jansen, S., Watanabe, T. & Smets, E. 2002. Aluminium accumulation in leaves of 127 species in Melastomataceae with comments on the order Myrtales. Annals of Botany 90(1): 53–64.
Jansen, S., Broadley, M.R., Robbrecht, E. & Smets, E. 2002b. Aluminium hyperaccumulation in Angiosperms: a review of its phylogenetic significance. The Botanical Review 68(2): 235–269.
Kabata-Pendias, A. 2011. Trace Elements in Soils and Plants. CRC Press, Florida. Kovacheva, P., Djingova, R. & Kuleff, I. 2000. On the representative sampling of plants for multielement analysis. phytologia balcanica 6(1): 91-102.
Krämer, U. 2010. Metal hyperaccumulation in plants. Annual review of plant biology 61: 517-534.
25
Markert, B. & Klausmeyer, N. 1990. Variations in the elemental compositions of plants, and computer‐aided sampling in ecosystems. Toxicological & Environmental Chemistry 25(4): 201-212.
Markert, B. 1989. Multi-element analysis in ecosystems: basic conditions for representative sampling of plant materials. Fresenius' Zeitschrift für analytische Chemie 335(6): 562 - 565.
Markert, B. 1995. Sample preparation (cleaning, drying, homogenization) for trace element analysis in plant matrices). Science of the total environment 176(1): 45-61. Messias, M.C.T.B., Leite, M.G.P., Neto, J.A.A.M., Kozovits, A.R. & Tavares, R. (2013). Soil-vegetation relationship in quartzitic and ferruginous Brazilian rocky outcrops. Folia Geobotanica 48(4): 509-521.
Metali, F., Salim, K.A. & Burslem, D.F. 2012. Evidence of foliar aluminium accumulation in local, regional and global datasets of wild plants. New Phytologist 193(3): 637-649.
Metali, F., Abu Salim, K., Tennakoon, K. & Burslem, D.F. 2015. Controls on foliar nutrient and aluminium concentrations in a tropical tree flora: phylogeny, soil chemistry and interactions among elements. New Phytologist 205(1): 280-292. Negreiros, D., Le Stradic, S., Fernandes, G.W., & Rennó, H.C. 2014. CSR analysis of plant functional types in highly diverse tropical grasslands of harsh environments. Plant ecology 215(4): 379-388.
Nunes, J.A., Schaefer, C.E., Ferreira, J.W.G., Neri, A.V., Correa, G.R. & Enright, N.J. 2015. Soil-vegetation relationships on a banded ironstone'island', Carajás Plateau, Brazilian Eastern Amazonia. Anais da Academia Brasileira de Ciências 87(4): 2097-2110.
Párraga-Aguado, I., González-Alcaraz, M.N., Álvarez-Rogel, J., Jiménez-Cárceles, F.J. & Conesa, H.M. 2013. The importance of edaphic niches and pioneer plant species succession for the phytomanagement of mine tailings. Environmental Pollution 176:134–143.
Paula, L.F.A., Negreiros, D., Azevedo, L.O., Fernandes, R.L., Stehmann, J.R. & Silveira, F.A.O. 2015. Functional ecology as a missing link for conservation of a resource-limited flora in the Atlantic forest. Biodiversity and Conservation 24(9): 2239–2356.
26
Perry, G.L.W., Enright, N.J., Miller, B.P. & Lamont, B.B. 2009. Nearest-neighbor interactions in species-rich shrublands: the roles of abundance, spatial patterns and resources. Oikos 118(2):161-174.
Pilon‐Smits, E.A.H. & El Mehdawi, A.F. 2012. Ecological aspects of plant selenium hyperaccumulation. Plant Biology 14(1): 1-10.
Porto, M.L. & Silva, M.F.F. 1989. Tipos de vegetação metalófila em áreas de Serra de Carajás e de Minas Gerais. Acta Botanica Brasilica 3(1): 13-21.
Quinn, G.P & Keough, M.J. 2002. Experimental design and data analysis for biologists. Cambridge University Press.
Rayburn, A.P., Schiffers, K. & Schupp, E.W. 2011. Use of precise spatial data for describing spatial patterns and plant interactions in a diverse Great Basin shrub community. Plant Ecology 212(4): 585–594.
Rosenberg, M.S. & Anderson, C.D. 2011. PASSaGE: pattern analysis, spatial statistics and geographic exegesis. Version 2. Methods in Ecology and Evolution 2(3): 229-232.
Ruggiero, P.G.C., Batalha, M.A., Pivello, V.R. & Meirelles, S.T. 2002. Soil-vegetation relationships in cerrado (Brazilian savanna) and semideciduous forest, Southeastern Brazil. Plant Ecology 160(1): 1–16.
Salomons, W. 1995. Environmental impact of metals derived from mining activities: processes, predictions, prevention. Journal of Geochemical Exploration 52(1): 5-23.
Scalco, R.F. & Gontijo, B.M. 2009. Mosaico de unidades de conservação: da teoria à prática: o caso do mosaico de unidades de conservação da APA Cachoeria das Andorinhas – Ouro Preto/MG. Book Geografias v5 n2: 75-92p.
Schettini, A.T. 2015. Espécies acumuladoras de metais influenciam a composição química do solo e a composição de espécies em campos ferruginosos?. Master's Degree Thesis. Universidade federal de Ouro Preto (UFOP), 167p.
Séleck, M., Bizoux, J. P., Colinet, G., Faucon, M. P., Guillaume, A., Meerts, P., ... & Mahy, G. 2013. Chemical soil factors influencing plant assemblages along copper-cobalt gradients: implications for conservation and restoration. Plant and soil 373(1-2): 455-469.
Serrano, H.C., Antunes, C., Pinto, M.J., Máguas, C., Martins-Loução, M.A. & Branquinho, C. 2014. The ecological performance of metallophyte plants thriving in geochemical islands is explained by the Inclusive Niche Hypothesis. Journal of Plant Ecology rtu007.
27
Silveira, F.A., Negreiros, D., Barbosa, N.P., Buisson, E., Carmo, F.F., Carstensen, D.W., ... & Garcia, Q.S. 2015. Ecology and evolution of plant diversity in the endangered campo rupestre: a neglected conservation priority. Plant and Soil 1-24. Simmons, G.C. 1963. Canga caves in the Quadrilátero Ferrífero, Minas Gerais, Brazil. Bulletin of the National Speleological Society 25: 66–72.
Skirycz, A., Castilho, A., Chaparro, C., Carvalho, N., Tzotzos, G. & Siqueira, J.O. 2014. Canga biodiversity, a matter of mining. Frontiers in Plant Science (5): 653. Struik, G.J. & Curtis, J.T. 1962. Herb Distribution in an Acer saccharum Forest. American Midland Naturalist 68(2): 285-296.
Taylor, J.K. 1988. Quality assurance of chemical measurements. Lewis Publ., Inc., Chelsea, MI.
Teixeira, W.A. & Lemos-Filho, J.P. 1998. Metais pesados em folhas de espécies lenhosas colonizadoras de uma área de mineração de ferro em Itabirito, Minas Gerais. Revista Árvore 22: 381-388.
Thompson, H.R. 1958. The statistical study of plant distribution patterns using a grid of quadrats. Australian Journal of Botany 6(4): 322-342.
Thompson, S.K. & Seber, G.A.F. 1995. Adaptive Sampling. Wiley, New York. Vale, P. N. C. 2013. Solo e topografia como condicionantes da distribuição da vegetação em fitofisionomias campestre e florestal em contato direto na serra da Brígida, Ouro Preto, MG. Master's Degree Thesis. Universidade federal de Ouro Preto (UFOP), 79p.
Verbruggen, N., Juraniec, M., Baliardini, C. & Meyer, C.L. 2013. Tolerance to cadmium in plants: the special case of hyperaccumulators. Biometals 26(4): 633–
638.
Vincent, R.D.C. & Meguro, M. 2008. Influence of soil properties on the abundance of plant species in ferruginous rocky soils vegetation, southeastern Brazil. Revista Brasileira de Botânica 31(3): 377–388.
Wentworth, C.K., 1922. A scale of grade and class terms of clastic sediments. Journal of Geology, 30(5): 377-392.
28
Yates, C.J., Gibson, N., Pettit, N.E., Dillon, R. & Palmer, R. 2011. The ecological relationships and demography of restricted ironstone endemic plant species: implications for conservation. Australian Journal of Botany 59(7): 692-700.
Zar, J.H. 1999. Biostatistical analysis. 4th. Upper Saddle River, NJ: Prentice Hall, 1, 389-94.
29
Appendix
30
31
32
33
Table I-A–Soil particle size distribution by percentage (%).
Plot sample >4mm >2mm >1mm >0,5mm >0,25mm >0,125 >0,063 <0,063
A2 49.0 31.5 7.7 2.9 2.9 3.0 1.6 1.3
A10 54.6 27.4 6.3 3.4 3.7 2.6 1.3 0.6
C2 49.6 21.0 8.8 7.0 5.6 4.1 2.7 1.2
C8 72.1 16.5 4.2 2.5 2.4 1.4 0.6 0.3
C10 65.4 16.2 5.2 3.2 4.3 3.2 1.6 0.8
C12 44.9 19.0 8.1 5.9 7.3 6.6 5.1 3.2
D1 48.4 19.8 8.6 6.6 7.1 4.8 2.7 2.0
E6 60.7 19.0 6.2 3.8 4.8 4.3 0.8 0.4
E8 72.6 14.3 4.4 3.0 2.6 1.6 1.0 0.6
G10 62.3 15.7 6.5 4.8 4.3 3.4 2.3 0.6
H3 64.6 16.1 5.7 4.1 3.4 2.6 2.1 1.4
H7 75.6 10.9 4.1 2.9 2.7 1.7 1.1 1.0
I4 29.1 17.0 47.1 2.4 1.8 1.1 0.8 0.6
I6 51.0 15.3 9.1 8.0 8.4 4.8 2.0 1.4
I8 49.3 22.0 11.4 6.1 5.1 3.2 1.7 1.2
J5 26.9 11.8 19.0 12.5 13.3 9.0 4.5 3.0
K4 76.4 11.1 3.1 2.9 2.8 1.9 1.2 0.5
K6 49.9 19.8 9.1 8.0 8.2 1.2 2.4 1.4
L7 57.6 20.2 6.9 4.3 5.2 3.3 1.5 0.8
34
Table II-A - Foliar average concentration (mg.Kg-1) of some chemical elements in 17 studied vascular plant species.
Species Al Ba Be Ca Cu Fe K Mg Mn Na P S Sr Ti Zn
I 1243.33 63.04 0.081 6503.66 5.14 422.25 3361.04 2041.92 348.31 376.20 928.85 1504.64 30.82 3.90 16.62
II 135.11 2.72 0.081 4883.61 4.51 239.52 2449.14 2701.83 736.30 58.87 818.67 1352.80 11.24 2.39 47.05
III 160.48 16.57 0.081 6731.50 3.97 261.23 3108.87 2923.05 623.76 109.16 1133.99 1472.42 34.32 2.76 23.42
IV 223.03 31.83 0.088 10113.41 6.92 230.03 3318.33 2324.13 1483.51 404.65 760.21 1328.18 48.04 2.64 65.87
V 288.19 3.14 0.087 7200.41 5.58 391.92 1757.27 2262.20 415.05 145.43 823.55 1453.06 26.24 4.83 20.77
VI 59.85 24.78 0.079 8069.74 5.23 103.82 2120.17 1135.61 1639.86 115.89 595.11 1251.67 55.51 0.88 35.26
VIII 87.63 17.36 0.081 13071.75 3.99 160.91 1875.50 1468.27 777.99 64.52 544.27 967.12 68.63 1.38 18.82
IX 4195.29 59.08 0.084 15315.46 4.65 196.54 1757.07 3738.29 944.51 182.80 405.55 1456.83 113.44 1.91 49.32
X 1772.95 58.89 0.093 2843.50 3.08 222.59 1666.61 1424.23 313.58 1119.01 386.41 1001.56 55.81 2.29 25.51
XI 209.11 9.92 0.091 5520.26 17.41 287.69 3984.60 2385.41 2017.42 2055.86 1094.07 1989.91 21.93 3.47 67.11
XII 108.29 13.41 0.081 5140.45 7.49 140.22 2824.65 2172.79 1133.54 97.22 711.02 1645.61 26.47 1.50 24.38
XIII 155.56 20.26 0.083 8203.08 6.25 259.42 3819.47 4164.41 1472.39 206.86 1212.51 2064.24 38.64 2.43 30.51
XIV 166.68 9.45 0.088 12361.08 17.31 284.06 2563.71 1982.14 2606.06 177.94 822.94 1257.04 26.68 2.79 73.95
XV 125.95 8.07 0.082 8063.23 5.42 193.23 2264.83 2184.28 75.95 871.18 698.19 1744.00 49.07 2.04 13.62
XVI 59.36 47.81 0.078 8741.63 5.96 112.67 2828.09 2305.55 425.57 450.63 715.84 1391.26 53.83 1.04 15.57
XVII 162.35 10.79 0.086 6187.63 13.78 261.48 4893.01 2041.26 1023.48 391.62 899.97 1363.67 28.44 2.91 76.08
VII 325.52 8.23 0.085 5893.56 9.50 453.81 4592.41 2082.48 980.33 1609.79 1132.74 1651.15 27.67 5.66 71.82
QL* 2.39 0.05 0.03 2.83 0.58 1.99 26.10 9.21 0.25 3.31 15.04 27.59 0.01 0.72 0.41
*QL = quantification limit for each selected element.
35
Table III-A. Dispersion indices.
Species Mean count
Variance ID ICS GI ICF IMC IP IM
B. reticularia DC. 7.77419 24.78065 3.18 (p = 0.00000)
2.18 0.07 3.55 9.96 1.28 1.27
B. variabilis A.Juss. 1.64 5.36 3.26 (p = 0.00000)
2.26 0.07 0.72 3.90 2.37 2.35
M. marginata Radlk.
6.96 62.36 8.95 (p =
0.00000)
7.95 0.26 0.87 14.91 2.14 2.10
M. corallina Spring 2.45 20.25 8.26 (p = 0.00000)
7.26 0.24 0.33 9.71 3.96 3.90
P. mediterranea (Vell.) Taub.
39.41 537.71 13.64097 (p = 0.00000)
12.64 0.42 3.11 52.06 1.32 1.31
T. heteromalla (D. Don) Cogn.
104.25 2513.46 24.10 (p=0.00000)
23.10 0.77 4.51 127.36 1.22 1.21
T. laniflora (D. Don) Cogn.
0.58 3.45 5.94 (p =
0.00000)
4.94 0.16 0.11 5.52 9.51 9.72
ID( Index of Dispersion) / ICS (Index of Cluster Size) / GI (Green's Index) / ICF (Index of Cluster Frequency) / IMC (Index of Mean Crowding) / IP (Index of Patchiness) / MI (Morisita's Index).
36
37
Figure VI-A. Spatial distribution of T. heteromalla across the study area. Mapping method by ordinary kriging interpolation.
38
Figure VIII-A. Surface matrix plot of T. heteromalla across the studied area. The diagram shows a
diagonal spatial pattern, also known as “bishop’s move” neighborhood (Dale 1999).
39
Attachment
Table I-aT. Comparative foliar concentrations of some metal elements in two metalliferous species from ferruginous rocky outcrops in Brazil.
Species Chemical element concentration (mg/Kg-1) Geographic region Authors
Cd Cr Cu Fe Mn Mo Ni Pb Zn
E.
erythropappus*
0.53 nq 22.9 3
228.95 420.3 1
0.12 7.86 2.45 0
nq Quadrilatero ferrifero - MG
Porto & Silva (1989)
0.41 nq 26.5 8
258.33 443.7 5
0.32 4.64 4.07 0
nq
0.18 2
bql 11.6 395 454 nq 7.87 0.9 34.8 Quadrilatero ferrifero –
MG
Teixeira & Lemos-Filho (1998)
0,49 0,8 7
9,49 453,80 980,3 3
bql 5,21 bql 71,8 1
Quadrilatero ferrifero –
MG
Present study
T. laniflora bql 9.8 1.2 506 169 1.26 bql 14.9 Quadrilatero ferrifero –
MG
Teixeira & Lemos-Filho, (1998)
bql 0,6 2
2,91 212,73 334,8 2
bql bql bql 25,4 8
Quadrilatero ferrifero - MG
Present study
*Referred as Vanillosmopsis erythropappa (DC.) Sch.Bip on Porto & Silva (1989) and Teixeira & Lemos-Filho (1998) nq = not quantified.