Genetic Diversity and Spatial Genetic
Structure of the Grassland Perennial
Saxifraga granulata
along Two River Systems
Sascha van der Meer*, Hans Jacquemyn
KU Leuven, Laboratory of Plant Conservation and Population Biology, Kasteelpark Arenberg 31- bus 02435, Heverlee, Belgium
Abstract
Due to changes in land use, the natural habitats of an increasing number of plant species have become more and more fragmented. In landscapes that consist of patches of suitable habitat, the frequency and extent of long-distance seed dispersal can be expected to be an important factor determining local genetic diversity and regional population structure of the remaining populations. In plant species that are restricted to riparian habitats, rivers can be expected to have a strong impact on the dynamics and spatial genetic structure of popula-tions as they may enable long-distance seed dispersal and thus maintain gene flow
between fragmented populations. In this study, we used polymorphic microsatellite markers to investigate the genetic diversity and the spatial genetic structure of 28 populations of Sax-ifraga granulataalong two rivers in central Belgium. We hypothesized that rivers might be essential for gene flow among increasingly isolated populations of this species. Genetic diversity was high (HS= 0.68), which to a certain extent can be explained by the octoploid
nature ofS.granulatain the study area. Populations along the Dijle and Demer rivers were also highly differentiated (G”ST= 0.269 and 0.164 andDEST= 0.190 and 0.124, respec-tively) and showed significant isolation-by-distance, indicating moderate levels of gene flow primarily between populations that are geographically close to each other. Along the river Demer population genetic diversity was higher upstream than downstream, suggesting that seed dispersal via the water was not the primary mode of dispersal. Overall, these results indicate that despite increasing fragmentation populations along both rivers were highly genetically diverse. The high ploidy level and longevity ofS.granulatahave most likely buff-ered negative effects of fragmentation on genetic diversity and the spatial genetic structure of populations in riparian grasslands.
Introduction
Habitat loss and fragmentation decrease the size and increase the spatial isolation of many plant populations in Europe and elsewhere in the world [1,2]. Plant populations rely on
OPEN ACCESS
Citation:van der Meer S, Jacquemyn H (2015) Genetic Diversity and Spatial Genetic Structure of the Grassland PerennialSaxifraga granulataalong Two River Systems. PLoS ONE 10(6): e0130463. doi:10.1371/journal.pone.0130463
Academic Editor:Mingxi Jiang, Wuhan Botanical Garden,CAS, CHINA
Received:February 24, 2015
Accepted:May 20, 2015
Published:June 16, 2015
Copyright:© 2015 van der Meer, Jacquemyn. This is an open access article distributed under the terms of theCreative Commons Attribution License, which permits unrestricted use, distribution, and reproduction in any medium, provided the original author and source are credited.
Data Availability Statement:Genetic information of all individuals in the current study are available from the Dryad repository. DOI:http://dx.doi.org/10.5061/ dryad.q3d2m.
Funding:This work was supported by the Fonds Wetenschappelijk onderzoek project 11G1715N to SM (http://www.fwo.be/), and the European Research Council ERC starting grant 260601–MYCASOR to
ecological and genetic processes that ensure connectivity and meta-population viability. Ensur-ing pollen or seed flow between remnant habitat patches is therefore vital for species persis-tence in patchy landscapes as recurrent gene flow affects the rate of population expansion, recruitment, and colonization of new suitable habitat and allows replenishment of alleles that were lost after fragmentation [3–6].
In riparian habitats, rivers can be expected to be important to maintain gene flow between populations. Natural river landscapes consist of a mosaic of habitats that are tightly connected to each other by water movement [7,8]. Rivers within riparian ecosystems are characterized by unidirectional water movement, are generally dynamic and often show large variation in dis-charge levels after periods of low or heavy rainfall [9]. Gene flow between linearly arranged populations, as seen along rivers, can follow two main patterns; it can occur primarily between adjacent populations, leading to increasing genetic distances with increasing geographical dis-tances (i.e. isolation-by-distance) [10]. Alternatively, gene flow can occur at a similar rate among all populations, even over long distances, leading to low genetic differentiation among populations without an isolation-by-distance effect. Interpretation of the direction and dis-tance of gene flow in relation to measures of isolation-by-disdis-tance may be complicated by meta-population dynamics such as extinction and colonization events [11,12]. Founder events, for instance, can increase genetic population differentiation and can cause the relation-ship between genetic and geographic distances to disappear [13–15]. Furthermore, the direc-tion of gene flow along linearly arranged populadirec-tions can be unidirecdirec-tional or
bi-directional and gene flow in both directions can occur at a different rate. Moreover, gene flow can occur through both pollen and seeds. When gene flow occurs mainly via pollinators one would expect a bi-directional isolation-by-distance pattern.
Given that river systems can be characterized by unidirectional water movement seed dis-persal via the water (i.e. hydrochory) will most likely occur downstream. When downstream migration is slightly higher than upstream migration, genetic diversity could accumulate downstream, while populations upstream may gradually lose genetic diversity and in the most extreme case may disappear due to stochastic events [16]. This phenomenon is known as‘the unidirectional dispersal hypothesis’[12,17–19]. However, the observation that upstream habi-tats along rivers are not depleted of riparian plant species and populations upstream are gener-ally geneticgener-ally diverse as well, indicates that species are capable of dispersing seeds, pollen or vegetative structures upstream as well as downstream [11,20,21]. For instance, riparian popula-tions ofSparganium emersumandPopulus nigradisperse upstream via birds and wind, while downstream migration might have occurred via river systems [22,23].
The occurrence and frequency of long-distance seed dispersal via rivers also depends on the distance to the streamline. Several studies of riparian plant species have shown that there is a clear relationship between distance to the river and population genetic differentiation [12,19]. Some riparian plant species grow right at the waterfront, which enables them to drop seeds directly into the water. Grassland populations that are situated further from the river might still depend on river dynamics to ensure connectivity between populations, for instance, through enabling seed dispersal over long distances during seasonal or less frequent flooding events [23,24]. However, construction of dams and dikes along rivers can diminish connectiv-ity between riparian grassland populations [25].
The aim of this study was to assess whether rivers shape the genetic diversity and spatial genetic structure of fragmented populations of the grassland perennialSaxifraga granulata along two rivers in Belgium. Over the last decades, populations ofS.granulatahave become smaller and more isolated due to habitat loss and fragmentation [26,27]. The species used to occur in dry to mesic grasslands all over Western Europe. Due to intensification of agricultural practices the majority of populations in the study area is now restricted to riparian meadows Competing Interests:The authors have declared
[26]. Hence, rivers can be expected to be important in ensuring connectivity among popula-tions of this species and therefore in maintaining genetic diversity. To test this hypothesis, we used highly polymorphic microsatellite markers to study the spatial genetic structure ofS. gran-ulataalong two dynamic river systems. More specifically, we asked the following questions:
1. Are populations ofS.granulatagenetically differentiated within both river systems?
2. Does gene flow mainly occur between populations that are geographically close to each other?
3. Do we find accumulation of genetic diversity downstream, indicating that the river is the main dispersal vector?
Material and Methods
Study species
S.granulata, meadow saxifrage, is a self-compatible, insect-pollinated, protandrous, perennial rosette herb [28]. The species can reproduce sexually as well as clonally by formation of small bulbils at the base of the plant [29]. Individual ramets flower in May and June, producing flow-ering stems of up to 57 cm in height with small white flowers that are pollinated predominantly by unspecialized flies and solitary bees [30]. Populations in Western Europe have shown a decline during the last decades. In our study area the species is also listed as‘declining’[31], mainly as a result of the increasing use of fertilizers in meadows and agricultural landscapes [26,27].
Study area and population sampling
The study was conducted in the central part of Belgium (Fig 1), whereS.granulataused to be a widespread species in the first half of 20th century, but nowadays is confined to riparian grass-lands. The study was conducted along the rivers Dijle and Demer (Fig 1), which are both about 90 km long, dynamic, rain-fed rivers, with soft riversides. Both rivers can reach high discharge levels after heavy rainfall, but have a low discharge during dry periods. Alongside both rivers are valleys with mesic to wet grasslands that are well-connected to the river systems. Both rivers regularly flooded and inundated the adjacent river valleys in the past [32–34].
Nowadays, large-scale flooding events that affected the whole study area roughly take place once every ten years. Along the river Demer the last large-scale flooding events were in 1998 and 2002 [34], while populations along the Dijle were flooded in 2010 [35]. Small-scale flood-ing events are common along the river Dijle [35], but are less frequent along the Demer river [34].
During the flowering season of 2012 we visited 15 populations ofS.granulataalong the Dijle River and 13 populations along the Demer River (Fig 1). Sampled populations were situ-ated at least 200 m and at most 47 km apart within both river systems (Dijle: mean dis-tance = 4.4 km, SD = 3.7; Demer: mean disdis-tance = 23.6 km, SD = 17.7). Differences in elevation of the populations were very small as they were all situated on the floodplains of the rivers. We tried to sample all populations that were situated within 5 km of the studied river systems using information from local reserve managers and the website‘waarnemingen.be’
[36].
total number of flowering ramets and measured the average distance to the river in each popu-lation (Table 1).
S.granulatais not protected in Belgium, therefore, no collection permit was required. How-ever, we did collect leaf material in nature reserves managed by the nature protection NGO Natuurpunt, this concerns populations‘Doode Bemde 1, 2 and 3’,‘Zoet Water’,‘Wijgmaal’,
‘Achter Schoonhoven 1 and 2’,‘Kleine Laak’,‘Grote Laak’and‘Delfkensdonk’. Natuurpunt granted us permission to work in these grasslands. All other populations were located outside protected areas and were not situated on private land, hence, no specific permission was required for working in these populations.
Fig 1. Study area in Belgium and locations of the 28 sampling sites along the rivers Dijle and Demer.The arrows indicate the direction of the water flow. The figure was constructed based on maps of the NGI (Nationaal Geographisch Instituut) using QGIS 2.6.0 [65].
DNA extraction and microsatellite analysis
For DNA extraction circa 20 mg of dried plant material was homogenized to a fine powder using the mixer mill MM 200 (Retsch, Haan, Germany) and two small ceramic beads. DNA was extracted from a total of 560 plants following the NucleoSpin Plant II protocol for genomic DNA (Macherey-Nagel, Düren, Germany). For cell lysis we used buffer PL1 and incubated the cell lysis suspension for 60 min. DNA concentration and quality were measured using a Nano-Drop ND-2000 spectrophotometer (Thermo Scientific, Wilmington, DE, USA).
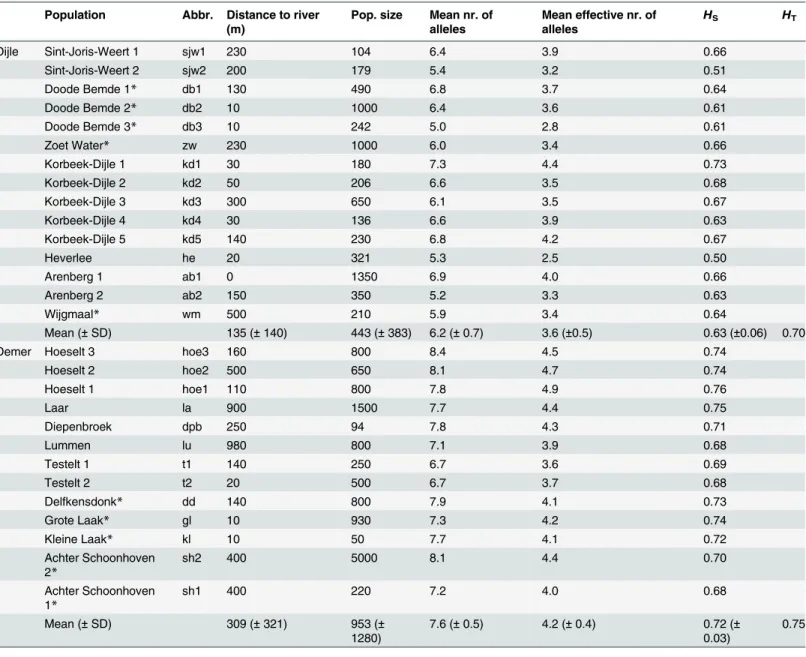
Table 1. Characteristics of the studiedSaxifraga granulatapopulations along the river systems Dijle and Demer. Population Abbr. Distance to river
(m)
Pop. size Mean nr. of alleles
Mean effective nr. of alleles
HS HT
Dijle Sint-Joris-Weert 1 sjw1 230 104 6.4 3.9 0.66
Sint-Joris-Weert 2 sjw2 200 179 5.4 3.2 0.51
Doode Bemde 1* db1 130 490 6.8 3.7 0.64
Doode Bemde 2* db2 10 1000 6.4 3.6 0.61
Doode Bemde 3* db3 10 242 5.0 2.8 0.61
Zoet Water* zw 230 1000 6.0 3.4 0.66
Korbeek-Dijle 1 kd1 30 180 7.3 4.4 0.73
Korbeek-Dijle 2 kd2 50 206 6.6 3.5 0.68
Korbeek-Dijle 3 kd3 300 650 6.1 3.5 0.67
Korbeek-Dijle 4 kd4 30 136 6.6 3.9 0.63
Korbeek-Dijle 5 kd5 140 230 6.8 4.2 0.67
Heverlee he 20 321 5.3 2.5 0.50
Arenberg 1 ab1 0 1350 6.9 4.0 0.66
Arenberg 2 ab2 150 350 5.2 3.3 0.63
Wijgmaal* wm 500 210 5.9 3.4 0.64
Mean (±SD) 135 (±140) 443 (±383) 6.2 (±0.7) 3.6 (±0.5) 0.63 (±0.06) 0.70
Demer Hoeselt 3 hoe3 160 800 8.4 4.5 0.74
Hoeselt 2 hoe2 500 650 8.1 4.7 0.74
Hoeselt 1 hoe1 110 800 7.8 4.9 0.76
Laar la 900 1500 7.7 4.4 0.75
Diepenbroek dpb 250 94 7.8 4.3 0.71
Lummen lu 980 800 7.1 3.9 0.68
Testelt 1 t1 140 250 6.7 3.6 0.69
Testelt 2 t2 20 500 6.7 3.7 0.68
Delfkensdonk* dd 140 800 7.9 4.1 0.73
Grote Laak* gl 10 930 7.3 4.2 0.74
Kleine Laak* kl 10 50 7.7 4.1 0.72
Achter Schoonhoven 2*
sh2 400 5000 8.1 4.4 0.70
Achter Schoonhoven 1*
sh1 400 220 7.2 4.0 0.68
Mean (±SD) 309 (±321) 953 (±
1280)
7.6 (±0.5) 4.2 (±0.4) 0.72 (± 0.03)
0.75
Populations are ordered according to their position along the river, the upper most population in the table occurs most upstream.
HSis the heterozygosity within populations,HTthe total heterozygosity for both river systems.
Nine recently developed microsatellite markers were used for genetic analysis. In a previous study these markers indicated thatS.granulatais octoploid in our study area [37]. All loci con-tained at least three and a maximum of eight alleles per genotype. As the microsatellite profiles showed no differentiation of allele sets and allele combinations were completely random (no fixed heterozygosity)S.granulatais presumably an auto- rather than an allopolyploid [38].
The markers were amplified in two separate PCR multiplexes in a 2720 Thermal Cycler (Applied Biosystems, CA, USA). The total PCR multiplex reaction volume was 10μl; contain-ing 5μl Qiagen Multiplex PCR Master Mix (Qiagen, Hilden, Germany), 3μl RNAse-free water, 1μl of one of the two multiplexed primer combinations (25 ng/μl) and 1μl of template DNA (50 ng/μl). Both PCR multiplexes followed the same thermocycler program with initial dena-turation of 15 min at 95°C; 27 cycles of 30 sec at 95°C, 1.5 min at 58°C and 1 min at 72°C; and a final elongation of 30 min at 60°C. Then, 1μl of the PCR reaction was added to a solution of 8.8μl formamide and 0.2μl of GeneScan 500 LIZ (-35; -250) size standard (Applied Biosys-tems). Fragments were sized on an ABI Prism and analyzed by capillary electrophoresis using the 3130 Genetic Analyzer (Applied Biosystems). Samples from all populations were randomly distributed across the ABI plates to prevent influence of gel-artifacts in the data. The raw genetic data were scored using GeneMapper Software v4.0 (Applied Biosystems) using the default settings for microsatellites. Panels and bins for GeneMapper were manually constructed and all data were visually checked to make sure that the loci were identified correctly.
Data analysis
Because of the octoploid nature ofS.granulatain the study area, population genetic data were analyzed using the program GENODIVE2.0 [39] and the r-package‘adegenet’1.3–6 [40] in R 2.15.1 [41]. Three measures of genetic diversity [42] were calculated for each population using the program GENODIVE: the number of alleles, the effective number of alleles (i.e. the number of alleles in a population weighted by their frequencies), and the so-called‘gametic heterozygosity’
(HS) [43], which is equivalent to the expected heterozygosity (HE) in diploid species [44].
Anal-yses were corrected for unknown dosage of alleles, based on the method of [45], since it is hard to estimate allele dosage in octoploid individuals.
Several measures of population differentiation;GST,G”ST[44] andDEST[46], were calcu-lated in GENODIVEto assess the genetic structure among populations along both river systems. These population differentiation statistics have their specific advantages and disadvantages. GST(FSTanalogue), for instance, relates the amount of genetic variation among populations to the total genetic variation over all populations and is determined by the amount of within-population diversity (HS). Hence,GST= (HT−HS)/HT[42]. However, when
within-population diversity is high, as can be expected in polyploid individuals analyzed with multi-allelic markers,GSTmay be underestimated. For this reason, we also calculatedG”STandDEST, which have the advantage that they are not negatively dependent on the amount of within-population diversity [47]. To assess the significance of the obtained population differentiation statistics we performed 9999 permutations and we corrected for unknown dosage of alleles. Pairwise population differentiation (G”ST) values were calculated as well.
network was built between populations and the largest eigenvalues, based on genetic variance and spatial structure, were retained for the analysis [49]. To identify genetic groups of popula-tions within both river systems we performed an AMOVA based K-means clustering analysis in GENODIVE[50]. The simulated annealing algorithm was run with 50 000 steps, with correc-tion for unknown dosage of alleles and with 1000 algorithm repeats. The optimal number of clusters was chosen based on pseudo-f scores [51].
To investigate patterns of genetic diversity ofS.granulataalong the two rivers, we first related genetic diversity to population size and distance to the river. We expected genetic diver-sity to increase with increasing population size and that populations closer to the river would be more genetically diverse since the chances of receiving seeds via the water is higher. These relationships were assessed using linear models in R. Finally, we tested the hypothesis that the rivers are the main seed dispersal vectors (i.e. the unidirectional dispersal hypothesis) by relat-ing the position of each population along the river to the population genetic diversity measure
‘number of alleles’, using a linear model in R. Position along the river was quantified as the log transformed distance between populations starting from the first upstream population.
Results
Genetic diversity
Populations along the river Demer were significantly more diverse than populations along the Dijle (mean effective number of alleles:t26= 4.0,P<0.001 andHS: t26= 4.8,P<0.001; Table 1). Overall, the number of alleles per locus, for all 560 individuals, ranged from 6 to 21. The total number of alleles per locus within populations ranged from 5 to 8 and the mean effec-tive number of alleles per locus was lower, ranging from 2.50 to 4.87. Within population het-erozygosities were high, ranging from 0.50 to 0.76 (Table 1). In general, the most diverse populations were Hoeselt 1 and Laar, two upstream populations along the Demer River. Popu-lations with the lowest genetic diversity were Heverlee and Sint-Joris-Weert 2, two popuPopu-lations along the Dijle River. All multilocus genotypes analyzed were unique, indicating that we did not sample clones.
Population differentiation
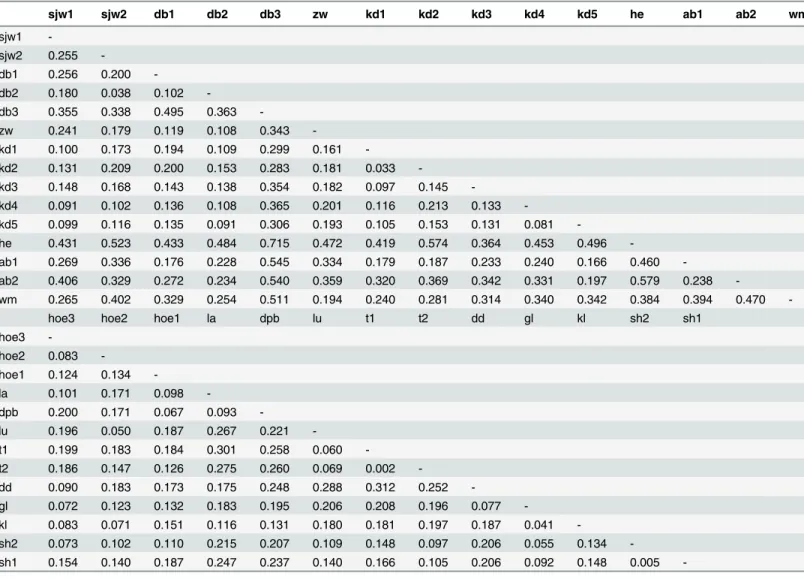
The population differentiation statisticGSTwas low for both the Dijle and Demer Rivers, 0.093 and 0.042, respectively. The more recently developed population differentiation statisticsG”ST andDESTwere higher thanGSTalong both river systems (G”ST= 0.269 and 0.164 and DEST= 0.190 and 0.124 for the rivers Dijle and Demer, respectively). All population differentiation sta-tistics were highly significant (P<0.001) for both rivers. Pairwise genetic differentiation values (G”ST) for populations along the river Dijle ranged from 0.033 to 0.715 with an average of 0.264 (SD = 0.144;Table 2). Population‘Heverlee’, situated in the middle of the Dijle range, seemed to be most genetically differentiated among the Dijle populations, despite being geo-graphically close to several other populations. Along the Demer, pairwise differentiation values were lower, ranging from 0.002 to 0.312 with an average of 0.152 (SD = 0.066;Table 2).
Spatial genetic structure
Patterns of spatial autocorrelation were slightly different between the two river systems. Popu-lations along the River Dijle showed no significant isolation-by-distance effect (Mantel’s r= 0.229,P= 0.179). However, this was caused mainly by the highly differentiated population
Dijle (Mantel’sr= 0.327,P= 0.048;Fig 2A). Hence, gene flow among populations along the Dijle River takes place generally between populations that are situated close to each other. Along the Demer River we found a lower, yet also significant isolation-by-distance effect (Man-tel’sr= 0.231,P= 0.036;Fig 2B).
The sPCA results for populations along the river Dijle showed a clear spatial pattern, in which upstream populations were different from downstream populations (Fig 3A). Upstream populations along the Dijle River had negative values on the first principal component axis, while populations downstream had positive principal component values on the first axis. Popu-lations along the Demer River did not show differentiation between upstream and downstream populations. However, a group of populations in the middle of the river was genetically differ-ent from populations on either side, upstream and downstream (Fig 3B).
Table 2. Pairwise population differentiation (G”ST) ofS.granulataalong the Dijle and Demer river systems, corrected for unknown dosage of alleles.
sjw1 sjw2 db1 db2 db3 zw kd1 kd2 kd3 kd4 kd5 he ab1 ab2 wm
sjw1
-sjw2 0.255
-db1 0.256 0.200
-db2 0.180 0.038 0.102
-db3 0.355 0.338 0.495 0.363
-zw 0.241 0.179 0.119 0.108 0.343
-kd1 0.100 0.173 0.194 0.109 0.299 0.161
-kd2 0.131 0.209 0.200 0.153 0.283 0.181 0.033
-kd3 0.148 0.168 0.143 0.138 0.354 0.182 0.097 0.145
-kd4 0.091 0.102 0.136 0.108 0.365 0.201 0.116 0.213 0.133
-kd5 0.099 0.116 0.135 0.091 0.306 0.193 0.105 0.153 0.131 0.081
-he 0.431 0.523 0.433 0.484 0.715 0.472 0.419 0.574 0.364 0.453 0.496
-ab1 0.269 0.336 0.176 0.228 0.545 0.334 0.179 0.187 0.233 0.240 0.166 0.460
-ab2 0.406 0.329 0.272 0.234 0.540 0.359 0.320 0.369 0.342 0.331 0.197 0.579 0.238
-wm 0.265 0.402 0.329 0.254 0.511 0.194 0.240 0.281 0.314 0.340 0.342 0.384 0.394 0.470
-hoe3 hoe2 hoe1 la dpb lu t1 t2 dd gl kl sh2 sh1
hoe3
-hoe2 0.083
-hoe1 0.124 0.134
-la 0.101 0.171 0.098
-dpb 0.200 0.171 0.067 0.093
-lu 0.196 0.050 0.187 0.267 0.221
-t1 0.199 0.183 0.184 0.301 0.258 0.060
-t2 0.186 0.147 0.126 0.275 0.260 0.069 0.002
-dd 0.090 0.183 0.173 0.175 0.248 0.288 0.312 0.252
-gl 0.072 0.123 0.132 0.183 0.195 0.206 0.208 0.196 0.077
-kl 0.083 0.071 0.151 0.116 0.131 0.180 0.181 0.197 0.187 0.041
-sh2 0.073 0.102 0.110 0.215 0.207 0.109 0.148 0.097 0.206 0.055 0.134
-sh1 0.154 0.140 0.187 0.247 0.237 0.140 0.166 0.105 0.206 0.092 0.148 0.005 -For abbreviations of population names seeTable 1.
Fig 2. The relationship between pairwise genetic distances (G”ST) and log transformed geographic distances (ln(m)) for (A) 15 populations ofS.
granulataalong the Dijle River.Black triangles denote distances from the highly differentiated population‘Heverlee’to the other populations and grey circles represent distances between the remaining 14 populations. The result of the mantel test that included population‘Heverlee’was not significant, however, we did find a significant isolation-by-distance effect between the other 14 populations (Mantel’s r = 0.327;P= 0.048). (B) 13 Populations along the Demer River with a significant isolation-by-distance effect (Mantel’s r = 0.231;P= 0.036).
doi:10.1371/journal.pone.0130463.g002
Fig 3. Principal Components of the first axis of the sPCA analysis projected on the spatial structure of the populations along the rivers (A) Dijle and (B) Demer.The size of the squares indicates the size of the PC-value, with black squares representing a positive PC-value and white squares a negative PC-value.
Population clustering
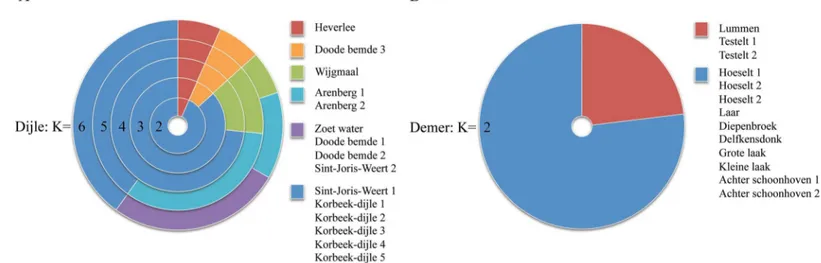
The K-means population clustering analysis showed that populations along the Dijle River grouped to form six separate clusters (Fig 4A). Most clusters are formed between populations that are situated relatively close to each other, illustrating the isolation-by-distance effect, or consisted of one population only. For instance, the highly differentiated population‘Heverlee’
had a separate cluster for every number ofk. The K-means cluster analysis of populations along the river Demer showed very similar results as shown by the sPCA analysis and grouped the populations together in two genetic clusters. Populations‘Testelt 1 and 2’and‘Lummen’, situated in the middle of the river's range, were grouped to form one of the two clusters (Fig 4B). These populations in the middle of the Demer River had relatively low allelic diversity (Table 1). As a result they were clustered because these populations were probably missing alleles that were present in all other populations upstream and downstream.
Unidirectional flow hypothesis
Based on the distribution of genetic diversity along the two rivers, we did not find any indica-tion for an increase in genetic diversity downstream as expected when the river is the main dis-persal vector (Table 1). Populations along the Dijle River were not significantly more diverse downstream (F1,13= 0.0004,P= 0.99) and populations along the river Demer were actually sig-nificantly more diverse upstream than downstream (F1,11= 5.89,P= 0.03).
Moreover, we did not find a relationship between genetic diversity and distance to the river (Dijle:F1,13= 0.36,P= 0.56; Demer:F1,11= 0.0002,P= 0.99), indicating that populations closer to the stream did not receive more alleles via the water than populations that were situated further from the river. Finally, genetic diversity was not significantly related to population size (Dijle: F1,13= 0.44,P= 0.52 Demer:F1,11= 1.58,P= 0.23;Table 1). Some relatively small populations were genetically very diverse, while several large populations did not show high genetic diversity.
Discussion
Genetic structure and among-population differentiation
In this study we investigated the genetic diversity and spatial genetic structure of fragmented and isolated populations of the grassland herbS.granulataalong two river systems. Genetic
Fig 4. K-means clustering analysis of populations (A) along the Dijle River, showing populations divided into 2–6 clusters.(B) Clusters along the Demer River.
differentiation of populations along both rivers, based onGST, was low in comparison to several other riparian species, such asMyrica laxiflora[52],Silene tatarica[4] andViscaria alpina [53], but similar to values of population differentiation of other species [6,12,18,54–56]. How-ever, values ofGSTwere potentially underestimated inS.granulatadue to the use of multi-allelic markers and its high ploidy level.G”STandDESTvalues indicated that genetic differentia-tion between populadifferentia-tions ofS.granulatawas substantially higher than that based onGST.
High population differentiation in combination with a significant isolation-by-distance effect indicates moderate levels of gene flow, primarily between populations that are geographi-cally close to each other. Mantel’srwas not very high, suggesting that long-distance seed dis-persal and disdis-persal between non-adjacent populations might take place. Pollen flow could have played an important role in shaping the isolation-by-distance effect since pollen flow mainly occurs between populations that are situated close to each other. Pollen flow across large distances is unlikely given that populations were on average more than 4 km apart along the Dijle and 23 km along the Demer and the species is mainly pollinated by small flies and sol-itary bees. Seed dispersal probably explains gene flow patterns across larger distances. Gene flow through dispersal of asexually produced bulbils is unlikely since they generally remain attached to the plant until roots have been formed (S. van der Meer, personal observation).
On the other hand, the observed population differentiation patterns might also reflect his-toric connectivity. A study of the grassland perennialSuccisa pratensishas shown that current genetic similarity between populations was affected by past connectivity as a result of the long life-span and a persistent seed bank ofS.pratensis[57]. In the past,S.granulataused to be more abundant in the study area and was not entirely restricted to riparian grasslands, but also occurred in meadows and grasslands of the traditional small-scale agricultural landscape. Cur-rent population genetic diversity patterns might reflect historical connectivity, since clonal propagation and polyploidy can buffer loss of genetic diversity.
The observed differences in population differentiation between the two studied rivers were unexpected, since the distances between the populations along the Dijle were smaller, while populations showed higher genetic differentiation. These differences might be explained by a higher population turnover rate along the Dijle. For instance, population‘Heverlee’shows signs of a founder event, it has the lowest effective number of alleles but it does not have the lowest number of alleles, suggesting that this population probably had one high frequency allele at most of its loci that were uncommon in other populations. InHelmholtzia glaberrima persis-tent founder effects also increased population differentiation [58].
Within-population genetic diversity
The studied populations also showed high levels of genetic diversity within populations, which could be explained by the polyploid nature ofS.granulata. Polyploid populations contain more copies of each gene than similar sized diploid populations. Hence, they could be more genetically diverse due to a higher number of mutations and a lower impact of genetic drift [59]. Most other riparian plant species had lower mean values of gene diversity ranging from 0.04 to 0.31 [4,18,52,53,56,58,60,61], while gene diversity ranged from 0.50 up to 0.76 with a mean of 0.68 in the current study. Only seedlings of the riparian tree speciesPopulus nigra showed similar high levels of genetic diversity [55]. High genetic diversity is often observed in tree species, which could be explained by selection processes acting at an early stage.
other riparian plant species [11,22,55,58,62–64]. Upstream dispersal ofS.granulatacould occur via pollen and seed flow mediated, for instance, by animals, while downstream seed dis-persal across large distances could occur during flooding events that inundate the river valleys and riparian grasslands. InOriganum vulgare, another inhabitant of riparian grasslands, occa-sional long distance seed dispersal events could be traced back to extreme-floods of the river Meuse and local colonization was mostly observed after regular flooding events [24]. Thus, even thoughS.granulataoccurred at a distance from the river, flooding events in the past could have been important for gene flow, shaping the spatial genetic structure of the studied populations.
Conclusion
Despite the recent decline ofS.granulatain Western Europe, populations along the Dijle and Demer are still genetically diverse. The high ploidy level and longevity of this species may have buffered the negative effects of increasing isolation due to anthropogenic habitat modification. The levels of population differentiation found in this study imply a history of moderate levels of gene flow, mostly between populations that are geographically close to each other. However, these patterns might also reflect historical connectivity when populations were more wide-spread. In the riparian plantMyricaria germanicathe historic pattern of gene flow in one of the studied catchments was mainly directed downstream, while contemporary gene flow was bidi-rectional. This indicates that the importance of individual dispersal vectors (i.e. water, animals, wind) can change over time [64], for instance, due to river confinement. Overall, rivers might play an important role in enabling long-distance seed dispersal during flooding events, but our results suggest thatS.granulatarelies on other dispersal vectors that maintain connectivity between increasingly isolated populations.
Acknowledgments
The authors thank the nature protection NGO Natuurpunt for granting permission to work in nature reserves‘Doode Bemde’,‘Achter Schoonhoven’and‘Wijgmaalbroek’, special thanks to L. Vervoort, K. Lambeets and I. Verstuyft and reserve managers F. Wouters, R. Weckhuysen, P. De Becker and M. Lehouck. We would also like to thank J.S. van Zweden for assistance in the field, T. Reijnders for assistance in the lab and P.G. Meirmans for his help regarding genetic analyses.
Author Contributions
Conceived and designed the experiments: SM HJ. Performed the experiments: SM. Analyzed the data: SM. Contributed reagents/materials/analysis tools: SM. Wrote the paper: SM HJ.
References
1. Lande R. Anthropogenic, ecological and genetic factors in extinction and conservation. Res Popul Ecol. 1998; 40: 259–269.
2. Young A, Boyle T, Brown T. The population genetic consequences of habitat fragmentation for plants. Trends Ecol Evol. 1996; 11: 413–418. PMID:21237900
3. Higgins SI, Cain ML. Spatially realistic plant metapopulation models and the colonization–competition trade-off. J Ecol. 2002; 90: 616–626.
4. Tero N, Aspi J, Siikamäki P, Tuomi J. Genetic structure and gene flow in a metapopulation of an endan-gered plant species,Silene tatarica. Mol Ecol. 2003; 12: 2073–2085. PMID:12859630
6. Jacquemyn H, Honnay O, Van Looy K, Breyne P. Spatiotemporal structure of genetic variation of a spreading plant metapopulation on dynamic riverbanks along the Meuse River. Heredity. 2006; 96: 471–478. PMID:16622473
7. Ward JV. Riverine landscapes: Biodiversity patterns, disturbance regimes, and aquatic conservation. Biol Conserv. 1998; 83: 269–278.
8. Van Looy K, Honnay O, Pedroli B, Muller S. Order and disorder in the river continuum: the contribution of continuity and connectivity to floodplain meadow biodiversity. J Biogeogr. 2006; 33: 1615–1627. 9. Wetzel RG. Morphology and flow in river ecosystems. Limnology. Third edit. San Diego, California,
USA: Academic Press; 2001. pp. 18–22.
10. Slatkin M. Isolation by distance in equilibrium and non-equilibrium populations. Evolution. 1993; 47: 264–279.
11. Honnay O, Jacquemyn H, Van Looy K, Vandepitte K, Breyne P. Temporal and spatial genetic variation in a metapopulation of the annualErysimum cheiranthoideson stony river banks. J Ecol. 2009; 97: 131–141.
12. Honnay O, Jacquemyn H, Nackaerts K, Breyne P, Van Looy K. Patterns of population genetic diversity in riparian and aquatic plant species along rivers. J Biogeogr. 2010; 37: 1730–1739. doi:10.1007/ s00259-010-1463-8PMID:20419371
13. Whitlock MC, McCauley DE. Some population genetic consequences of colony formation and extinc-tion: genetic correlations within founding groups. Evolution. 1990; 44: 1717–1724.
14. Lande R. Neutral theory of quantitative genetic variance in an island model with local extinction and col-onization. Evolution. 1992; 46: 381–389. PMID:1363442
15. Slatkin M. Gene flow and genetic drift in a species subject to frequent local extinctions. Theor Popul Biol. 1977; 12: 253–262. PMID:601717
16. Lande R. Risks of population extinction from demographic and environmental stochasticity and random catastrophes. Am Nat. 1993; 142: 911–927.
17. Ritland K. Genetic differentiation, diversity, and inbreeding in the mountain monkeyflower (Mimulus caespitosus) of the Washington Cascades. Can J Bot. 1981; 67: 2017–2024.
18. Markwith SH, Scanlon MJ. Multiscale analysis ofHymenocallis coronaria(Amaryllidaceae) genetic diversity, genetic structure, and gene movement under the influence of unidirectional stream flow. Am J Bot. 2007; 94: 151–160. doi:10.3732/ajb.94.2.151PMID:21642217
19. Schleuning M, Becker T, Vadillo GP, Hahn T, Matthies D, Durka W. River dynamics shape clonal diver-sity and genetic structure of an Amazonian understorey herb. J Ecol. 2011; 99: 373–382.
20. Nilsson C, Grelsson G, Johansson M, Sperens U. Patterns of plant species richness along riverbanks. Ecology. 1989; 70: 77–84.
21. Nilsson C, Brown RL, Jansson R, Merritt DM. The role of hydrochory in structuring riparian and wetland vegetation. Biol Rev. 2010; 85: 837–858. doi:10.1111/j.1469-185X.2010.00129.xPMID:20233190
22. Pollux BJA, Jong MDE, Steegh A, Verbruggen E, van Groenendael JM, Ouborg NJ. Reproductive strat-egy, clonal structure and genetic diversity in populations of the aquatic macrophyteSparganium emer-sumin river systems. Mol Ecol. 2007; 16: 313–325. PMID:17217347
23. Smulders MJM, Cottrell JE, Lefèvre F, van der Schoot J, Arens P, Vosman B, et al. Structure of the genetic diversity in black poplar (Populus nigraL.) populations across European river systems: conse-quences for conservation and restoration. For Ecol Manage. 2008; 255: 1388–1399.
24. Van Looy K, Jacquemyn H, Breyne P, Honnay O. Effects of flood events on the genetic structure of riparian populations of the grassland plantOriganum vulgare. Biol Conserv. 2009; 142: 870–878. 25. Werth S, Schödl M, Scheidegger C. Dams and canyons disrupt gene flow among populations of a
threatened riparian plant. Freshw Biol. 2014; 59: 2502–2515.
26. De Becker P.Saxifraga granulataL. Knolsteenbreek. In: Van Landuyt W, Hoste I, Vanhacke L, Van den Bremt P, Vercruysse W, De Beer D, editors. Atlas van de Flora van Vlaanderen en het Brussels Gewest. Instituut voor natuur- en bosonderzoek (INBO), Nationale Plantentuin, and Flo.Wer; 2006. pp. 799–800.
27. Walisch TJ, Colling G, Poncelet M, Matthies D. Effects of inbreeding and interpopulation crosses on performance and plasticity of two generations of offspring of a declining grassland plant. Am J Bot. 2012; 99: 1300–1313. doi:10.3732/ajb.1100479PMID:22859653
28. Andersson S. Floral variation inSaxifraga granulata: phenotypic selection, quantitative genetics and predicted response to selection. Heredity. 1996; 77: 217–223.
30. Lindgaard Hansen JE, Molau U. Pollination biology, mating system, and seed set in a Danish popula-tion ofSaxifraga granulata. Nord J Bot. 1994; 14: 257–268.
31. INBO. Rode lijst hogere planten. 2006.https://www.inbo.be/nl/rode-lijst-hogere-planten-2006. 32. Bauwens W, Marien J, Van Der Beken A, Vandewiele GL. Het real time computerbeheer van een
hoog-waterreservoir op de Dijle te Neerijse. Water. 1985; 23: 125–129. PMID:4041042
33. De Becker P, Hermy M, Butaye J. Ecohydrological characterization of a groundwater-fed alluvial flood-plain mire. Appl Veg Sci. 1999; 2: 215–228.
34. Breckpot M, Agudelo OM, Meert P, Willems P, De Moor B. Flood control of the Demer by using Model Predictive Control. Control Eng Pract. 2013; 21: 1776–1787.
35. De Becker P. Advies betreffende de verenigbaarheid van de instandhoudingsdoelen met de waterbe-heersingsmaatregelen in de Dijlevallei. 2013.
36. De Vries H, Verheul D. Waarnemingen. 2006.http://waarnemingen.be/.
37. van der Meer S, Van Houdt JKJ, Maes GE, Hellemans B, Jacquemyn H. Microsatellite primers for the gynodioecious grassland perennialSaxifraga granulata(Saxifragaceae). Appl Plant Sci. 2014; 2: 1400040.
38. Trapnell DW, Hamrick JL, Parker KC, Braungart KW, Glenn TC. Evaluating the utility of microsatellites for investigations of autopolyploid taxa. J Hered. 2011; 102: 473–478. doi:10.1093/jhered/esr045
PMID:21670174
39. Meirmans PG, van Tienderen PH. GENOTYPE and GENODIVE: two programs for the analysis of genetic diversity of asexual organisms. Mol Ecol Notes. 2004; 4: 792–794.
40. Jombart T. adegenet: a R package for the multivariate analysis of genetic markers. Bioinformatics. 2008; 24: 1403–1405. doi:10.1093/bioinformatics/btn129PMID:18397895
41. R development core team. R: A language and environment for statistical computing. 2013.http://www. r-project.org/.
42. Nei M. Molecular Evolutionary Genetics. New York: Colombia University Press; 1987.
43. Moody ME, Mueller LD, Soltis DE. Genetic variation and random drift in autotetraploid populations. Genetics. 1993; 134: 649–657. PMID:8325493
44. Meirmans PG, Hedrick PW. Assessing population structure: Fst and related measures. Mol Ecol Resour. 2011; 11: 5–18. doi:10.1111/j.1755-0998.2010.02927.xPMID:21429096
45. De Silva HN, Hall AJ, Rikkerink E, McNeilage MA, Fraser LG. Estimation of allele frequencies in poly-ploids under certain patterns of inheritance. Heredity. 2005; 95: 327–334. PMID:16094298
46. Jost L. Gst and its relatives do not measure differentiation. Mol Ecol. 2008; 17: 4015–4026. PMID:
19238703
47. Heller R, Siegismund HR. Relationship between three measures of genetic differentiation Gst, Dest and G’st: how wrong have we been? Mol Ecol. 2009; 18: 2080–2083. PMID:19645078
48. Jombart T, Devillard S, Dufour A-B, Pontier D. Revealing cryptic spatial patterns in genetic variability by a new multivariate method. Heredity. 2008; 101: 92–103. doi:10.1038/hdy.2008.34PMID:18446182
49. Jombart T. A tutorial for the spatial Analysis of Principle Components (sPCA) using adegenet 1.3–4. 2012.
50. Meirmans PG. AMOVA-based clustering of population genetic data. J Hered. 2012; 103: 744–750. doi:
10.1093/jhered/ess047PMID:22896561
51. Caliński T, Harabasz J. A dendrite method for cluster analysis. Commun Stat. 1974; 3: 1–27.
52. Liu Y, Wang Y, Huang H. High interpopulation genetic differentiation and unidirectional linear migration patterns inMyricaria laxiflora(Tamaricaceae), and endemic riparian plant in the Three gorges valley of the Yangtze river. Am J Bot. 2006; 93: 206–215. doi:10.3732/ajb.93.2.206PMID:21646181
53. Lundqvist E, Andersson E. Genetic diversity in populations of plants with different breeding and dis-persal strategies in a free-flowing boreal river system. Hereditas. 2001; 135: 75–83. PMID:12035618
54. Kudoh H, Whigham DF. Microgeographic genetic structure and gene flow inHibiscus moscheutos
(Malvaceae) populations. Am J Bot. 1997; 84: 1285–1293. PMID:21708685
55. Imbert E, Lefèvre F. Dispersal and gene flow ofPopulus nigra(Salicaceae) along a dynamic river sys-tem. J Ecol. 2003; 91: 447–456.
56. DeWoody J, Nason JD, Smith M. Inferring demographic processes from the genetic structure of a meta-population ofBoltonia decurrens(Asteraceae). Conserv Genet. 2004; 5: 603–617.
57. Münzbergová Z, Cousins SAO, Herben T, Plačková I, Mildén M, Ehrlén J. Historical habitat connectivity
58. Prentis PJ, Mather PB. Fine-scale patterns of genetic variation indicate non-equilibrium gene frequency divergence in the stream lily,Helmholtzia glaberrima. Freshw Biol. 2008; 53: 973–980.
59. Meirmans PG, Van Tienderen PH. The effects of inheritance in tetraploids on genetic diversity and pop-ulation divergence. Heredity. 2013; 110: 131–137. doi:10.1038/hdy.2012.80PMID:23211786
60. Akimoto M, Shimamoto Y, Morishima H. Population genetic structure of wild riceOryza glumaepatula
distributed in the Amazon flood area influenced by its life-history traits. Mol Ecol. 1998; 7: 1371–1381. 61. Russell JR, Weber JC, Booth A, Powell W, C S-M, Dawson IK. Genetic variation ofCalycophyllum
spruceanumin the Peruvian Amazon Basin, revealed by amplified fragment length polymorphism (AFLP) analysis. Mol Ecol. 1999; 8: 199–204.
62. Soons MB, Van Der Vlugt C, Van Lith B, Heil GW, Klaassen M. Small seed size increases the potential for dispersal of wetland plants by ducks. J Ecol. 2008; 96: 619–627.
63. James EA, Jordan R, Griffin PC. Spatial genetic analysis of two polyploid macrophytes reveals high connectivity in a modified wetland. Freshw Biol. 2013; 58: 2102–2113.
64. Werth S, Scheidegger C. Gene flow within and between catchments in the threatened riparian plant
Myricaria germanica. PLoS One. 2014; 9: e99400. doi:10.1371/journal.pone.0099400PMID:
24932520