85
Looking for Empirical Evidence about the Socio-Economic Activity of Countries
with Social Accounting Matrices
Susana Santos
ISEG (School of Economics and Management) of the Technical University of Lisbon UECE (Research Unit on Complexity and Economics)
and DE (Department of Economics) Rua Miguel Lupi, 20, 1249-078 Lisboa
Portugal.
Abstract
In looking for empirical evidence about the socio-economic activity of countries, a proposal is made for studying it through the use of Social Accounting Matrices (SAMs). SAMs are presented as tools that have specific features for conducting studies in several different areas, as well as for supporting policy decision processes. Based on methodological principles that are derived mainly from the works of Stone and Pyatt, emphasis is placed on the desirability of working in a matrix format, which simultaneously includes activities (or industries), products, factors of production and institutions. This is considered to be a way of capturing the relevant network of linkages and the corresponding multiplier effects in the subsequent modelling of the socio-economic activity of the countries studied. The exposition is accompanied by the example of a SAM applied to Portugal.
Keywords: Social Accounting Matrix; National Accounts.
1. Introduction
SAMs are tools that have specific features for studying the socio-economic activity of countries. Such features allow for the reading and interpretation of the reality under study, leading to the production of an empirical work that is not only capable of highlighting specific aspects of that activity, but also offers the chance to experiment with different interventions in regard to its functioning. A presentation will be made of a proposal for a basic SAM, together with an explanation of possible alternative taxonomies, showing how SAMs can be used as an alternative support for studies being undertaken in several areas, as well as for the work of those taking part in the policy decision process.
In stating that knowledge of the socio-economic activity of countries involves the use of national accounts, Section 2 justifies the decision to use the matrix form for studying the empirical evidence of that same activity.
Section 3 adopts a methodological framework based on the works of Richard Stone and Graham Pyatt, outlining the main features of the SAM-based approach, according to which the SAM can describe the activity of countries either empirically or theoretically, depending on whether it is presented in a numerical or an algebraic version, respectively. In keeping with the conclusions outlined in the latest work by Pyatt and Round, stress will be placed on the recommendation for “the design and the construction of SAMs prior to their use in modelling” (Pyatt& Round, 2012: 272)
86 Section 5 systematises the main ideas of the other sections and makes some concluding remarks in an attempt to illustrate to what extent countries can use SAMs to study (socio-) economic systems and support their policy decision processes.
2.Looking for empirical evidence about the socio-economic activity of countries
Statistics record facts. The activity of a country is a series of facts. Therefore, any attempt to gain knowledge of those facts calls for the use of statistics. However, the complexity of such activity and the innumerable facts and statistics that serve to record it frequently make this task rather difficult, and sometimes render our efforts unfeasible. The challenge lies in defining the best hierarchy of facts, identifying the correct network of linkages between them, ensuring the availability of statistics and making use of good working tools. Those working tools should enable us to read the reality under study and to produce an empirical work that is not only capable of highlighting specific aspects of that activity, but also offers the chance to simulate different interventions in regard to its functioning.
In the preface to the book “Understanding National Accounts”, Giovannini, E. states: “(…) today’s national accounts are the core of a modern system of economic statistics, and they provide the conceptual and actual tool to bring coherence to hundreds of statistical sources available in developed countries” (Lequiller F.& Blades D., 2006: 3). If we accept the truthfulness of this statement, then a plausible statistical base source of information for studying the activity of a country ought to be its national accounts. This methodology can also be applied to countries that are not considered to be developed, but nonetheless seek to produce national accounts. However, we should also bear in mind that underlying the national accounts is a system that defines which facts should be observed and how these same facts should be recorded. The existence of such a system will certainly influence the challenge outlined above. Even so, we will adopt it as a starting point.
On the other hand, working with the accounts in a matrix format can be seen as a convenient way of considering the above-mentioned network of linkages and thus achieving greater analytical content. The matrix format will also allow for the use of the matrix algebra in possible mathematical treatments associated with the above-mentioned empirical work, enabling us to experiment with different interventions in regard to the functioning of reality. Some other advantages to be gained from the use of the matrix format will be mentioned in Section 4.
In looking for empirical evidence about the socio-economic activity of countries, our proposal of a SAM will make use of the specific hierarchy of the facts that are supposedly observed through the system of national accounts. This will make it possible to identify networks of linkages that can be worked upon with different purposes in mind, always operating within a macro framework. From that work, which exhaustively explores the features of the national accounts and their underlying system, further work can be carried out, discovering alternative hierarchies of facts, identifying the importance of the non-observed facts, and criticising the way in which the observed facts are recorded, etc. As the behaviour of facts is explained by theories, our empirical work will also allow us to either test or better define these theories.
3.The SAM-based approach
Richard Stone, Graham Pyatt and Jeffery Round in particular played a key role in the in the study and dissemination of the SAM-based approach.
In the foreword to the book that can now be regarded as a pioneering work in terms of the SAM-based approach, “Social Accounting for Development Planning with special reference to Sri Lanka”, Stone stated that the framework of the system of national accounts can be rearranged and “the entries in a set of accounts can be presented in a matrix in which, by convention (…), incomings are shown in the rows and outgoings are shown in the columns; and in which, reflecting the fact that accounts balance, each row sum is equal to the corresponding column sum”. That matrix, with an equal number of rows and columns, is the SAM, in the construction of which “it may be possible to adopt a hierarchical approach, first adjusting the entries in a summary set of national accounts and then adjusting subsets of estimates to these controlling totals”. (Pyatt and Roe, 1977: xix, xxiii).
87 conceptual terms how the corresponding transaction values might be determined”. Thus, the SAM is used as “the basic framework for model presentation”. (Pyatt, 1988: 327; 337).
Looking at the question from the perspectives outlined above, it can be said that a SAM can have two versions: a numerical version, which describes the activity of a country empirically; and an algebraic version, which describes that same activity theoretically. In the former version, each cell has a specific numerical value, with the sums of the rows being equal to the sums of the columns. In the latter version, each cell is filled with algebraic expressions that, together with those of all the other cells, form a SAM-based model, the calibration of which involves a replication of the numerical version.
In the words of Pyatt, “the essence of (...) the SAM approach to modelling is to use the same SAM framework for both the empirical and the theoretical description of an economy”. (Pyatt, 1988: 337). In 1953, with the first and most fundamental contribution written by Stone, the United Nations recommended the System of National Accounts (SNA), which continued to be published in successive versions until 2008. Also working on the last two versions of that system, published in 1993 and 2008, were, besides the United Nations, the International Monetary Fund, the World Bank, the Organisation for Economic Cooperation and Development and the Statistical Office of the European Communities (Eurostat). Together, they formed the Inter-Secretariat Working Group on National Accounts (ISWGNA). This system establishes the rules for measuring the socio-economic activity of countries or groups of countries, which, in turn, have been adopted and adapted to specific realities by the corresponding statistical offices. The construction of algebraic versions (or SAM-based models) can be seen, among others, in Pyatt (2001; 1988), Pyatt and Roe (1977), Pyatt and Round (1985; 2012) and Santos (2010; 2009).
In their latest article, Pyatt and Round (2012) explore and derive conditions for a phenomenon that they identify as distributional invariance within a SAM-based model. That phenomenon, which they also call “the Stone phenomenon”, is associated with the study of a component of the multiplier effects identified during research into the interrelationship between the structure of production and the distribution of income in the context of economic development. The implications of those conditions were identified by the authors in the design of SAMs and in the consequent quality of results generated via subsequent modelling. Consequently, they conclude by appealing for renewed efforts to be made in the design and construction of SAMs with a view to obtaining a more realistic starting point for subsequent modelling.
4.Constructing numerical versions of SAMS from the SNA: application to Portugal
The latest versions of the SNA have devoted a number of paragraphs to discussing the question of SAMs. The 2008 version mentions SAMs in Section D of its Chapter 28, entitled “Input-output and other matrix-based analysis” (ISWGNA, 2009: 519-522), in which a matrix representation is presented of the accounts identified and described in the whole SNA. This representation is not, however, to be identified with the SAM presented in this paper, although they both cover practically all the flows recorded by those accounts. In turn, the European System of National and Regional Accounts in the European Union of 20101 (the adaptation for Europe of the 2008 version of the SNA) makes a reference to the SAM, stating that, among other features, it can be thought of as an expanded system of labour (satellite) accounts (Chapter 22).
The SAM that will be presented below results from the work that the author has undertaken within the methodological framework presented in Section 3, based especially on the works of Graham Pyatt and his associates (Pyatt, 1988 and 1991; Pyatt& Roe, 1977; Pyatt& Round, 1985 and 2012), as well as from the efforts made to reconcile that framework with what has been defined by (the successive versions of) the SNA (Pyatt, 1985 and 1991a; Round, 2003; Santos, 2009). Thus, the author will propose a version of the SAM that seeks to be as exhaustive as possible regarding the flows observed by the SNA. Pyatt (1999) and Round (2003) also approach this same issue with the use of their own versions.
The following proposal will be accompanied by an applications made of the SAM to Portugal in 2009. In that year, the Portuguese national accounts adopted the European System of National and Regional Accounts in the European Community of 1995 – the adaptation for Europe of the 1993 version of the SNA. Because the general differences
1 At the time when this article was written, the system was outlined in the form of a Proposal for a Regulation of the
88 between the accounts identified in this application and described in the 1993 and 2008 versions of the SNA are not significant, they will be used to illustrate the following exposition.
Thus, returning to the description provided in Section 3, a square matrix will be worked upon, in which the sum of the rows is equal to the corresponding sum of the columns. In keeping with what is conventionally accepted, and after some adjustments have been made to adapt this to the SNA, resources, incomes, receipts or changes in liabilities and net worth will be represented in the entries made in the rows, while uses, outlays, expenditures or changes in assets will be represented in the entries made in the columns. Each flow will therefore be recorded only once, in a cell of its own. The following description will be made in accordance with the 2008 SNA.
The starting point for the construction of a numerical SAM should be its design, i.e. the classification or taxonomy of its accounts. That taxonomy and the levels of disaggregation adopted will depend on the purposes for which the SAM is to be used, as well as on the way that the available information is organised. Adopting the national accounts as the base source of information, a basic structure is proposed below, which takes into account the underlying SNA and highlights the consistency of the whole system. The flexibility of that basic structure will be shown, together with the possibilities that it presents for characterising problems and for achieving specific purposes. These will also be seen as possibilities for going beyond the SNA, which is considered as a starting point, as mentioned in Section 2.
In this respect, we are aware of the dangers associated with the adoption of international standards and systems of classification and their failure to recognise important issues and realities. This problem is also mentioned by Pyatt and Round when they consider the choice of taxonomies within a SAM framework and the strategic influence that these can have on the potential usefulness of subsequent applications. According to those authors: “the taxonomies that are embedded within [the SAM framework] predetermine what any subsequent modelling exercise might have to say in response to specific distributional questions” (Pyatt& Round, 2012: 270).
4.1.The SAM’s basic structure and its consistency with the whole system
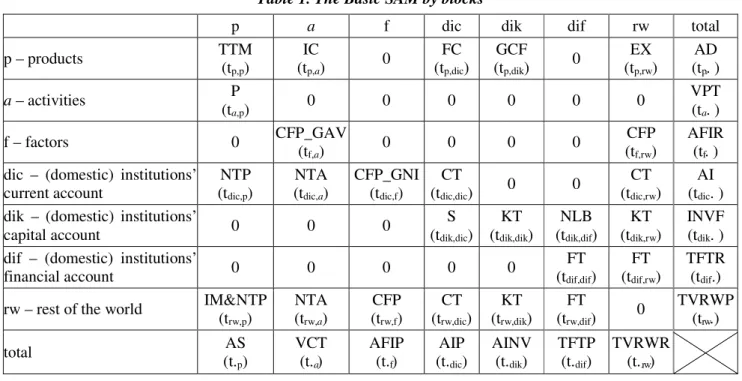
Adopting the working method recommended by Stone in the second paragraph of Section 3 of this paper, the basic structure for the SAM presented here will be a summary set of the national accounts and the controlling totals for the other levels of disaggregation, which will later be analysed in Section 4.2. Thus, in keeping with the conventions and nomenclatures defined by the SNA, besides a rest of the world account, the proposed SAM will also include both production and institutional accounts.
Table 1. The Basic SAM by blocks
p a f dic dik dif rw total
p – products TTM
(tp,p)
IC
(tp,a) 0
FC (tp,dic)
GCF
(tp,dik) 0
EX (tp,rw)
AD (tp.. )
a – activities P
(ta,p) 0 0 0 0 0 0
VPT (ta . )
f – factors 0 CFP_GAV
(tf,a) 0 0 0 0
CFP (tf,rw)
AFIR (tf. ) dic – (domestic) institutions’
current account
NTP (tdic,p)
NTA (tdic,a)
CFP_GNI (tdic,f)
CT
(tdic,dic) 0 0
CT (tdic,rw)
AI (tdic. ) dik – (domestic) institutions’
capital account 0 0 0
S (tdik,dic)
KT (tdik,dik)
NLB (tdik,dif)
KT (tdik,rw)
INVF (tdik. ) dif – (domestic) institutions’
financial account 0 0 0 0 0
FT (tdif,dif)
FT (tdif,rw)
TFTR (tdif.)
rw – rest of the world IM&NTP (trw,p)
NTA (trw,a)
CFP (trw,f)
CT (trw,dic)
KT (trw,dik)
FT
(trw,dif) 0
TVRWP (trw.)
total AS
(t.p)
VCT (t.a)
AFIP (t.f)
AIP (t.dic)
AINV (t.dik)
TFTP (t.dif)
TVRWR (t..rw)
89 Note: The first three accounts (p = products (or goods and services), a = activities (or industries) and f = factors (of
production)) are the production accounts of the economy and the next three accounts (dic = current; dik = capital; dif = financial) are the accounts of the (domestic) institutions. The last account (rw = rest of the world) represents the “outside” part of the (domestic) economy.
Table 1 shows the above-mentioned basic structure, representing the nominal transactions (“t”) with which two indexes are associated. The location of these transactions within the matrix framework is described by those indexes, the first of which represents the row account while the second represents the column account. Each cell of this matrix will be converted into a submatrix, with the number of rows and columns corresponding to the level of disaggregation of the row and column accounts. This same table also identifies blocks, which are submatrices or sets of submatrices with common characteristics. The specification of these blocks will be made below and involves an identification of the flows of the National Accounts, which will continue to be the same even if some disaggregation is performed – thereby preserving the consistency of the whole system.
Description of the blocks (included in the texts are letters followed by numbers between brackets, which are the flow codes of the National Accounts, in accordance with the 2008 SNA):
a) Production – P (cell: ta,p) – represents the output of goods and services (P1).
b) Domestic Trade is represented by the value of domestically transacted products, which can be either domestically produced or imported.
b.1)Intermediate Consumption – IC (cell: tp,a) – consists of the value of the goods and services consumed as inputs by a process of production, excluding those fixed assets whose consumption is recorded as consumption of fixed capital (P2).
b.2) Final Consumption – FC (cell: tp,dic) – consists of the expenditure incurred by resident institutional units on goods or services that are used for the direct satisfaction of individual needs or wants, or the collective needs of members of the community (P3).
b.3)Gross Capital Formation – GCF (cell: tp,dik) – includes gross fixed capital formation, changes in inventories, and acquisitions less disposals of valuables (P5).
c) External Trade includes the transactions in goods and services from non-residents to residents, also known as imports (P7), or IM (cell: trw,p), and the transactions in goods and services from residents to non-residents, also known as exports (P6), or EX (cell: tp,rw).
d) Trade and Transport Margins – TTM (cell: tp,p) – amounts to zero and, when it is disaggregated and takes the form of a submatrix, it allocates the output of the trade and transport services used in the domestic trade to the supplied products.
e) Net taxes on production and imports
e.1)Net Taxes on Production – NTA (cells: tdic,a; trw,a) – represents the (other) taxes on production (D29) minus the (other) subsidies to production (D39).
e.2) Net Taxes on Products – NTP (cells: tdic,p; trw,p) – represents the taxes on products (D21) minus the subsidies on products (D31).
f) Compensation of Factors of Production – CFP (cells: tf,a; tdic,f; tf,rw; trw,f) – consists of the income of the institutional sectors originating from the compensation of employees (D1) and the compensation of employers and/or own-account (or self-employed) workers, and the compensation of capital, including property income (D4; B2g-B3g). The functional distribution is represented by the Gross Added Value – GAV (cell: tf,a), whereas the institutional distribution is represented by the Gross National Income – GNI (cell: tdic,f).
90
h) Capital Transactions – KT (cells: tdik,dik; tdik,rw;trw,dik) – includes: capital taxes (D91); investment grants (D92); other capital transfers (D99); and acquisitions less disposals of non-financial non-produced assets (NP1-3).
i) Financial Transactions – FT (cells: tdif,dif; tdif,rw; trw,dif) – includes: monetary gold and special drawing rights (F1); currency and deposits (F2); debt securities (F3); loans (F4); equity and investment fund shares (F5); insurance, pension and standardised guarantee schemes (F6); financial derivatives and employee stock options (F7); and other accounts receivable/payable (F8).
j) Gross Saving – S (cell: tdik,dic) – measures the portion of aggregate income that is not used for final consumption expenditure and current transfers to domestic institutions or to the rest of the world (B9g).
k) Net Borrowing/Lending – NLB (cell: tdik,dif)
The net lending or borrowing of the total economy is the sum of the net lending or borrowing of the institutional sectors. It represents, respectively, the net resources that the total economy makes available to the rest of the world or the net resources that it receives from the rest of the world to finance the corresponding needs of investment funds (B9).
Here, those amounts are recorded in the row(s) of the capital account, i.e. as changes in liabilities and net worth, and in the column(s) of the financial account, i.e. as changes in assets. This is why the mathematical signs of this item have been changed in relation to the SNA.
The construction of a SAM is easier when it is performed by blocks.
The totals of each account represent the corresponding sums of the cells in rows and in columns, with the following description:
• Products account (p): Aggregate Demand – AD, the row sum (cell: tp.); Aggregate Supply – AS, the column sum (cell: t.p).
• Activities account (a): Production Value – VPT, the row sum (cell: ta.); Total Costs – VCT, the column sum
(cell: t.a).
• Factors of Production (f): Aggregate Factors Income (Received) – AFIR, the row sum (cell: tf.); Aggregate Factors Income (Paid) – AFIP, the column sum (cell: t.f).
• Current account of (domestic) institutions (dic): Aggregate Income (received) – AI, the row sum (cell: tdic.); Aggregate Income (Paid) – AIP, the column sum (cell: t.dic).
• Capital account of (domestic) institutions (dik): Investment Funds – INVF, the row sum (cell: tdik.); Aggregate Investment – AINV, the column sum (cell: t.dik).
• Financial account of (domestic) institutions (dif): Total Financial Transactions (Received) – TFTR, the row
sum (cell: tdif.); Total Financial Transactions (Paid) – TFTP, the column sum (cell: t.dif).
• Rest of the world account (rw): Value of Transactions to the Rest of the World (Paid) – TVRWP, the row sum (cell: trw.); Value of Transactions from the Rest of the World (Received) – TVRWR, the column sum (cell: t.rw).
91
Table 2. Basic SAM of Portugal in 2009 (unit: 106 euros)
p a f dic dik dif rw total
p – products 0 162 661 146 934 34 051 47 236 390 882
a – activities 311 365 311 365
f – factors 149 403 9 039 158 443
dic – (domestic)
institu-tions’ current account 19 694 522 141 423 85 711 4 581 251 931
dik – (domestic)
institu-tions’ capital account 15 865 1 536 16 222 2 232 35 856
dif – (domestic)
institu-tions’ financial account 36 659 37 209 73 868
rw – rest of the world 59 823(a) - 1 222 17 019 3 421 268 20 987 100 297
total 390 882 311 365 158 443 251 931 35 856 73 868 100 297
Sources: Statistics Portugal (INE); Portuguese Central Bank (Banco de Portugal). (a)
59 717 (imports) + 106 (net taxes on products sent to the institutions of the European Union)
Therefore, as mentioned above, and again using the words of Stone, the basic SAM that has just been described can be considered as the most aggregate “summary set of national accounts”, representing a first level of the intended hierarchical method, with all the controlling totals for the next level of that hierarchy. From here the consistency of the whole (supposedly) observed system can be ensured.
From the above description, two further advantages of the matrix presentation of the national accounts can be highlighted: each transaction represents a single entry and can be characterised by its position; each account is represented by a row and a column, whose balance is ensured by the equality of their sums.
4.2. Disaggregations and extensions
Since the national accounts cover all the details covered by the basic structure presented in Section 4.1, some other levels of the hierarchical method, mentioned in Section 3, can be identified within the national accounts, providing other controlling totals for greater levels of disaggregation. As will be seen below, this disaggregation can be made at the levels of the production, institutional and rest of the world accounts either within the scope of the SNA conventions or not. Reverse reasoning can be applied to the case of aggregation. Therefore, besides the above-mentioned advantages of presenting the national accounts in the form of a matrix, it is also possible to make an easier aggregation and disaggregation of the accounts, in accordance with the specific requirements of the exercise and the available information, without losing the consistency of the system.
In the words of Round, in his Foreword to Santos (2009): “The key to constructing a useful SAM and developing an effective SAM-based model is the SAM design. A SAM need not be dimensionally large as long as it represents the most significant features of economy-wide interdependence. More precisely, this means designing the SAM so that the key sectors, markets and institutions are as fully represented as is practicable. Estimation of the transactions between accounts is obviously also important but this needs to go in tandem with the SAM design” (Santos, 2009: xiv).
It is also worth mentioning that, although the quarterly national accounts are not as complete as the annual ones, it will nonetheless be possible to make some further disaggregations from these in terms of time.
Furthermore, disaggregations can be made in terms of space, since regional accounts are also considered. In that case, it is possible to work with regions and countries, either individually or as a group. Round (1994; 1991), for example, experimented with the case of Europe. It would even be possible to think in world terms, if the SNA could be adopted worldwide.
Extensions are also possible, either from the national accounts or from other sources of information, with the convenient adjustment to, or connection with, the whole system in order to maintain its consistency.
The 2008 SNA dedicates its Chapter 29 to “Satellite accounts and other extensions” (ISWGNA, 2009: 523-544)2, where the main idea is to serve specific analytical purposes, in a way that is consistent with the central framework,
92 although not fully integrated into it (ISWGNA, 2009: 37-38). In this respect, the author would like to support Steven Keuning and Willem Ruijter’s idea of a “complete data set” which “could be tentatively labelled: a System of Socio-economic Accounts” (Keuning and Ruijter, 1988: 73).
4.2.1. Production accounts
In the basic structure proposed in Section 4.1, the production accounts are the accounts of products, activities and factors of production. These accounts correspond respectively to the SNA accounts of goods and services, production and the primary distribution of income. Thus, within these accounts and depending on the available level of disaggregation, it can be seen how the available products are used, with some details being provided about the process of production and about the way in which the incomes resulting from that process and the ownership of assets are distributed among institutions and activities.
As described above, in the characterisation of the block representing the compensation of the factors of production, the disaggregation that can be made from the already mentioned tables of the national accounts is between labour (or the compensation of employees) and what has been referred to as the compensation of other factors, which includes the compensation of employers and/or own-account (or self-employed) workers, and the compensation of capital, namely property income. Such information can only be derived from the Integrated Economic Accounts Table if the products and activities accounts are not disaggregated, or from the Supply and Use Table if those same accounts are disaggregated. Table 3, which contains the above-mentioned application to Portugal, in which the products and activities accounts are not disaggregated, presents the possible disaggregation of the factors of production accounts based on the Integrated Economic Accounts Table.
Regarding the design of SAMs and in order to establish a connection between the taxonomies dealt with in this section and in the next, it should be mentioned that in their latest work, besides a rest of the world account, Pyatt and Round identify accounts for goods and non-factor services and factor services, as well as, accounts for institutions. In the latter, they identify private and public sector current accounts and combined capital accounts. About this classification, they say the following: “taxonomies for goods and services serve to distinguish different markets and should therefore be constructed in ways that recognise significant market failures and segmentation. In contrast, the institutions within the private sector are differentiated by the assets they own (or do not own…) and the productive activities they are responsible for…. Factors of production and the assets that provide them are therefore the defining feature of institutions.” (Pyatt& Round, 2012: 268).
4.2.2. Institutions and rest of the world accounts
In the basic structure proposed in Section 4.1, the domestic institutions are divided into current, capital and financial accounts. These accounts correspond, respectively, to the following SNA accounts: secondary distribution of income, redistribution of income in kind and use of income; capital; and financial accounts. Within these accounts, depending on the level of disaggregation available, the current accounts show how the national income is transformed into disposable income through the receipt and payment of current transfers, and how the latter is distributed between final consumption and saving. In turn, the capital account records the transactions linked to acquisitions of non-financial assets and capital transfers involving the redistribution of wealth, whereas the financial account records the transactions in financial assets and liabilities between institutional units, and between these and the rest of the world.
All the linkages between the domestic economy and the rest of the world, i.e. all the transactions between resident and non-resident units, are recorded both in the SAM and in the SNA through the rest of the world account.
93
Table 3. SAM of Portugal in2009, with disaggregated factors of production and the (domestic) institutions’ current and capital accounts (unit: 106 euros)
Outlays (expenditures)
Incomes (receipts)
PRODUCTION INSTITUTIONS
PRODUCTS ACTIVITIES
FACTORS CURRENT ACCOUNT
Labour
(employees) Other Total Households
Nonfinancial corporations
Financial
corporations Government NPISH Total
1 2 3 4 5 6 7 8 9
P R O D U C T IO N
PRODUCTS 1 0 162 661 0 0 0 106 206 0 0 37 160 3 568 146 934
ACTIVITIES 2 311 365 0 0 0 0 0 0 0 0 0 0
F A C T O R
S Labour (employees) 3 0 85 888 0 0 0 0 0 0 0 0 0
Other 4 0 63 515 0 0 0 0 0 0 0 0 0
Total 0 149 403 0 0 0 0 0 0 0 0 0
IN S T IT U T IO N S C U R R E N T A C C O U N
T Households 5 0 0 85 757 34 258 120 015 801 1 830 5 226 28 998 95 36 949
Nonfinancial corporations 6 0 0 0 14 615 14 615 1 830 0 613 171 0 2 613
Financial corporations 7 0 0 0 5 990 5 990 5 289 519 131 42 32 6 013
Government 8 19 694 522 0 - 34 - 34 31 224 5 684 671 8 22 37 610
NonProfitInstitutionsServing
Households(NPISH) 9 0 0 0 837 837 324 154 50 1 997 0 2 525
Total 19 694 522 85 757 55 666 141 423 39 468 8 187 6 690 31 215 150 85 711
C A P IT A L A C C O U N T
Households 10 0 0 0 0 0 13 728 0 0 0 0 13 728
Nonfinancial corporations 11 0 0 0 0 0 0 8 903 0 0 0 8 903
Financial corporations 12 0 0 0 0 0 0 0 5 283 0 0 5 283
Government 13 0 0 0 0 0 0 0 0 - 11 695 0 - 11 695
NonProfitInstitutionsServing
Households(NPISH) 14 0 0 0 0 0 0 0 0 0 - 354 - 354
Total 0 0 0 0 0 13 728 8 903 5 283 - 11 695 - 354 15 865
FINANCIAL ACCOUNT 15 0 0 0 0 0 0 0 0 0 0 0
REST OF THE WORLD 16 59 823 - 1 222 370 16 649 17 019 1 345 240 110 1 726 0 3 421
TOTAL 390 882 311 365 86 127 72 315 158 443 160 747 17 331 12 082 58 407 3 363 251 931
94
Table 3. SAM of Portugal in2009, with disaggregated factors of production and the (domestic) institutions’ current and capital accounts (unit: 106 euros)
(continued)
Outlays (expenditures)
Incomes (receipts)
INSTITUTIONS
REST OF THE
WORLD TOTAL
CAPITAL ACCOUNT FINANCIAL ACCOUNT Households Nonfinancial corporations Financial
corporations Government NPISH Total
10 11 12 13 14 15 16
P R O D U C T IO N
PRODUCTS 1 7 269 19 812 1 064 5 071 834 34 051 0 47 236 390 882
ACTIVITIES 2 0 0 0 0 0 0 0 0 311 365
F A C T O R
S Labour (employees) 3 0 0 0 0 0 0 0 239 86 127
Other 4 0 0 0 0 0 0 0 8 800 72 315
Total 0 0 0 0 0 0 0 9 039 158 443
IN S T IT U T IO N S C U R R E N T A C C O U N
T Households 5 0 0 0 0 0 0 0 3 783 160 747
Nonfinancial corporations 6 0 0 0 0 0 0 0 103 17 331
Financial corporations 7 0 0 0 0 0 0 0 79 12 082
Government 8 0 0 0 0 0 0 0 615 58 407
NonProfitInstitutionsServing
Households(NPISH) 9 0 0 0 0 0 0 0 1 3 363
Total 0 0 0 0 0 0 0 4 581 251 931
C A P IT A L A C C O U N
T Households 10 0 0 53 139 0 192 - 9 004 177 5 093
Nonfinancial corporations 11 0 0 0 795 0 795 11 407 924 22 029
Financial corporations 12 0 0 53 24 0 77 - 4 157 0 1 202
Government 13 3 95 28 0 2 129 17 135 1 118 6 687
NonProfitInstitutionsServing
Households(NPISH) 14 0 0 0 344 0 344 840 14 844
Total 3 95 135 1 301 2 1 536 16 222 2 232 35 856
FINANCIAL ACCOUNT 15 0 0 0 0 0 0 36 659 37 209 73 868
REST OF THE WORLD 16 - 2 179 2 122 3 315 8 268 20 987 100 297
TOTAL 5 093 22 029 1 202 6 687 844 35 856 73 868 100 297
95 The detailed study of the specific accounts of domestic institutions and their corresponding transactions also makes it possible to analyse specific aspects of that same activity: the distribution and redistribution of income, using the current account; the redistribution of wealth, using the capital account; investment, its financing, and the implicit levels of the financing requirements and availability of the institutional sectors and the whole economy, using the capital and financial accounts. In turn, the rest of the world account can provide many possibilities for studying the international economic relations of the domestic economy.
Table 3 presents the possible disaggregation of the institutions’ current and capital accounts, made from the Integrated Economic Accounts Table and the “from whom to whom matrices”, for the above-mentioned application to Portugal. Due to the unavailability of “from whom to whom matrices” for financial transactions, the financial account could not be disaggregated. Just as the matrix form of the production accounts may be easily worked on from the supply and use tables, it would also be possible to work on the matrix form of the institutional accounts if some kind of “from whom to whom tables” were made official. This would be a crucial factor for implementing the SAM-based approach, in which SAMs with production and institutional accounts, conveniently capturing the circular flow of income and the underlying network of linkages, would form the basis for macroeconomic models capable of reproducing the multiplier processes implicit in the activity of countries.
4.3. Aggregates, indicators and balancing items
As was seen above, practically all the transactions of the national accounts are covered by the SAM, so that macroeconomic aggregates, indicators and balancing items can be identified from it (see the description of the cells or blocks in Table 1, as well as Tables 2 and 3 for the application to Portugal).
Gross Domestic Product at market prices (GDPpm), which is usually considered the main macroeconomic aggregate, can be calculated in the three known approaches:
- Production approach: GDPpm = P – IC + NTP = ta,p – tp,a + (tdic,p+ (part of)trw,p);
- Expenditure approach: GDPpm = FC + GCF + Ex – IM = tp,dic + tp,dik + tp,rw – (part of) trw,p; - Income approach: GDPpm = GAV + NTP + NTA = tf,a + (tdic,p+ (part of) trw,p) + (tdic,a + trw,a).
The Portuguese GDPpmin 2009 was 168 504 * 106 euros, which can be calculated from these three approaches as follows:
- Production approach: GDPpm = 311 365 – 162 661 + (19 694 + 106);
- Expenditure approach: GDPpm = 146 934 + 34 051 + 47 236 – 59 717;
- Income approach: GDPpm = 149 403 + (19 694 + 106) + (522 – 1 222).
Domestic Product can be converted into National Product by adding the compensation of factors received from the rest of the world and deducting the compensation of factors and the net indirect taxes (on both products and production) sent to the rest of the world, when these exist. Thus, from the described cells of the basic SAM, GDPpm can be converted into Gross National Product at market prices (GNPpm) or Gross National Income (GNIpm), as follows: GDPpm + tf,rw – trw,f – trw,a– (part of) trw,p. On the other hand, as the SAM directly provides Gross National Income, this can also be calculated just by adding the net indirect taxes (on both products and production) received by domestic institutions: tdic,f + tdic,p + tdic,a. The corresponding amount for Portugal in 2009 is 161 639 * 106 euros, for which the underlying calculations are as follows: GNPpm= 168 504 + 9 039 – 17 019 – (–1 222) – 106; GNIpm= 141 423 + 19 694 + 522.
Disposable Income (Domestic or National) is also very important and can be calculated by adding to GNIpm the net current transactions received by domestic institutions: GNIpm + ((received)tdic,dic+ tdic,rw) – ((paid) tdic,dic+ trw,dic). In our application to Portugal: 161 639 + (85 711 + 4 581) – (85 711 + 3 421) = 162 800 * 106 euros. In turn, gross aggregates can be converted into net aggregates (and balancing items) by deducting the consumption of fixed capital, which lies outside the basic SAM but is part of the integrated economic accounts. Gross Saving (S) and Net Lending or Borrowing (NLB) are given directly by the SAM, through tdik,dic and tdik,dif, respectively, which in the case of Portugal in 2009 are: 15 865 and 16 222 * 106 euros. As explained in Section 3.1 - k), the latter amount represents Net Borrowing.
96 In the functional distribution of generated income, the distribution of gross added value – GAV – among the factors of production is given by the structure of the submatrix in cell tf,a of the basic structure, with its level of detail depending on the disaggregation of the activities (column account) and of the factors of production (row account). Table 4 shows the results for the applications to Portugal.
Table 4. Portuguese functional distribution of the income generated in 2009 (in percentage terms)
% Factors of Production
(generated income = gross added value or gross domestic product) Labour
(employees)
57.5
Other
(employers and own-account workers; capital)
42.5
Total 100.0
Source: Table 3
In the institutional distribution of generated income, the distribution of gross national income – GNI – is given by the structure of the submatrix in cell tdic,f of the basic structure. In this case, the level of detail will depend on the disaggregation of the factors of production (column account) and of the current account of the domestic institutions (row account). Table 5 shows the results of our application.
Table 5. Portuguese institutional distribution of the income generated in 2009 (in percentage terms)
Factors of Production
Labour (employees)
Other (employers and own-account workers; capital)
Total
Institutions
(generated income = gross national income)
Households 100.0 61.5 84.9
Non-financial corporations 26.3 10.3
Financial corporations 10.8 4.2
General government - 0.1 0.0
Non-profit institutions serving households 1.5 0.6
Total 100.0 100.0 100.0
Source: Table 3
As described above for the whole economy, the disposable income of the institutional sectors can be calculated in the same way, and then its distribution and use can also be studied – see Table 6.
Table 6.Portuguese distribution and use of disposable income among institutions in 2009(in percentage terms)
Distribution of Disposable
Income
Use of Disposable Income Final Consumption
Expenditure Saving
P
o
rt
u
g
al
Households 73.7 88.6 11.4
Non-financial corporations 5.5 --- 100.0
Financial corporations 3.2 --- 100.0
General government 15.6 145.9 - 45.9
Non-profit institutions serving households 2.0 111.0 - 11.0
Total 100.0 90.3 9.7
97 The main items in the revenue and expenditure of the institutional sectors and of the rest of the world can be calculated from the respective rows and columns of the SAM. In the case of institutional sectors, the total balancing item is the net lending/borrowing (NLB) of the respective institutional sector, with an opposite mathematical sign to the one registered in the SAM; the current balancing item is the respective gross saving (S); and the capital balancing item is the difference between the first and the second. Tables 7 and 8 (not considering the columns “relative importance of D5 and D62 in…”) illustrate the revenue and expenditure of the government and households for Portugal in 2009.
4.4. Examples of policy-type questions that can be addressed using a SAM
From what was seen above, by covering practically all the representative nominal flows of the part of the country’s activity observed by the national accounts (if it is assumed that this is sufficiently representative), the SAM can be used to support the policy decision process in several ways, given the flexibility of the already described basic structure and the possibilities of specifying various aspects of the underlying systems.
97 Table 7. Revenue and expenditure of Portuguese Government in 2009 and the relative importance of current taxes on income, wealth, etc., (transactions D5) received from households and of social benefits other than social transfers in kind (transaction D62) paid to the households.
Resources or Revenue (SAM row) Uses or Expenditure (SAM column) Balancing
item 106 euros
Relative importance of
D5 in.. (%)
106 euros
Relative importance of
D62 in.. (%)
106 euros
1. Current
Account (a) 58 407 17.3 70 102 40.6 -11 695
Gross National Income - 34 Final Consumption 37 160
Net taxes on production 522
Current transactions to domestic institutions
- D62 paid to households
31 215 28 483
91.2
Net taxes on products 19 694 Current transactions to the RW 1 726
Current transactions from domestic institutions
- D5 received from households
37 610 10 107
26.9 Current transactions from the RW
615 2. Capital
Account 1 246 6 687 -5 441
Capital transactions from domestic
institutions 128 Gross Capital Formation 5 071
Capital transactions from the RW 1 181 Capital transactions to domestic
institutions 1 301
Capital transactions to the RW 315
3 = 1 + 2 (b) 59 653 16.9 76 788 37.1 -17 135
Sources: Table 3 (rows/columns 8 and 13); Statistics Portugal (INE)
(a) Balancing item = Gross saving
98 Table 8. Revenue and expenditure of Portuguese Households in 2009 and the relative importance of current taxes on income, wealth, etc., (transactions D5) paid to the government and of social benefits other than social transfers in kind (transaction D62) received from the government.
Resources or Revenue (SAM row) Uses or Expenditure (SAM column) Balancing
item
106 euros
Relative importance of D62 in..
(%)
106 euros
Relative importance
of D5 in.. (%)
106 euros
1. Current
Account (a) 160 747 17.7 147 019 6.9 13 728
Gross National Income 120 015 Final Consumption 106 206
Current transactions from domestic institutions
- D62 received from the government
36 949 28 483
77.1
Current transactions to domestic institutions - D5 paid to the government
39 468 10 107
25.6
Current transactions from the RW 3 783 Current transactions to the RW 1 345
2. Capital
Account 369 5 093 -4 724
Capital transactions from domestic
institutions 192 Gross Capital Formation 7 269
Capital transactions from the RW 177 Capital transactions to domestic
institutions 3
Capital transactions to the RW -2 179
3 = 1 + 2 (b) 161 116 17.7 152 112 6.6 9 004
Sources: Table 3 (rows/columns 5, and 10); Statistics Portugal (INE)
(a) Balancing item = Gross saving
99
5. Concluding remarks
Social Accounting Matrices (SAM) are tools for working with the socio-economic activity of countries either empirically and theoretically, depending on whether they are presented in a numerical or algebraic version. This is the so-called SAM-based approach for studying (measuring and modelling) the socio-economic activity of countries.
Assuming that the national accounts are the core of the statistics representing the socio-economic activity of countries, their adoption is recommended, at least as a starting point, for any study that is looking for empirical evidence about that activity. This will enable us to work with, and gain greater knowledge about, the activity that is (supposedly) observed by the national accounts, which in a SAM framework will benefit from the increased analytical content provided by the matrix format and the possibility of capturing and working with networks of linkages not captured and worked on otherwise.
From the 2008 SNA, a basic structure is proposed for a numerical version of a SAM. That basic structure is considered as a summary set of the flows that the SNA assumes to be observed and the controlling totals for other levels of disaggregation. From that structure, it is possible to study specific aspects and maintain the consistency of the whole system.
That basic structure can be filled in from an integrated economic accounts table, which represents the general structure of the SNA, identifying the institutional sectors in the economy as a whole, besides the rest of the world. That table (complemented with the institutional accounts, for higher levels of detail) and the “from whom to whom matrices”, for specific transactions, allow for the disaggregation of the institutions accounts and for some work with the factors of production account. In turn, disaggregations at the level of the accounts of products and activities are made from the supply and use tables.
Disaggregations of the proposed structure do not affect the consistency of the whole system. Extensions, either from the national accounts or from other sources of information, pass through the convenient adjustment to, or the connection with, the whole system in order to maintain its consistency. This concern with consistency is a condition for ensuring that the network of linkages that underlies the socio-economic activity of countries is complete. Such consistency is only possible when production and institutions are worked on together. That network of linkages can only be identified and worked on in a matrix form in a tool like the SAM, which can be worked on not only for the observed but also for the non-observed activity of countries through the national accounts. The convenient coverage of that network of linkages is a necessary condition for capturing multiplier effects in subsequent modelling, which can provide important knowledge.
From the proposed structure, it is also proposed that work should be performed outside the matrix format with aggregates, indicators and balancing items, which can be seen as elements extracted from our working tool in order to empirically highlight our purposes. Depending on the detail of the SAM, we can therefore calculate more or less detailed aggregates, such as Gross Domestic Product (GDP), Gross National Income, Disposable Income, etc. The same thing happens in the case of the structural indicators of the functional and institutional distribution of generated income, as well as the indicators of the use of disposable income. On the other hand, the ease with which the main items in the revenue and expenditure of the institutional sectors and of the rest of the world can be extracted from the respective rows and columns of the SAM can also be seen as a great advantage.
100
References
Inter-Secretariat Working Group on National Accounts (United Nations, European Commission, International Monetary Fund, Organisation for Economic Cooperation and Development and World Bank) – ISWGNA (2009).System of National Accounts 2008. Series F, No. 2, Rev. 5, New York, United Nations.
Keuning S., & Ruijter W. (1988). Guidelines to the construction of a Social Accounting Matrix. Review of Income and Wealth, 34, 71-100.
Lequiller F., &Blades D. (2006).Understanding National Accounts. Organisation for Economic Co-operation and Development (OECD), Paris, France.
Pyatt, G. (2001). Some Early Multiplier Models of the Relationship between Income Distribution and Production Structure. Economic Systems Research, 13, 139-163.
Pyatt, G. (1999). Some Relationships between T-Accounts, Input-Output Tables and Social Accounting Matrices. Economic Systems Research, 11, 365-387.
Pyatt, G. (1991). Fundamentals of Social Accounting. Economic Systems Research, 3, 315-341.
Pyatt, G. (1991a). SAMs, the SNA and National Accounting Capabilities. Review of Income and Wealth, 37, 177-198.
Pyatt, G. (1988). A SAM Approach to Modeling. Journal of Policy Modeling, 10, 327-352.
Pyatt, G. (1985). Commodity Balances and National Accounts: a SAM Perspective. Review of Income and Wealth, 31, 155-169.
Pyatt, G. & Roe, A. (1977).Social Accounting for Development Planning with Special Reference to Sri Lanka. Cambridge University Press, Cambridge, UK.
Pyatt, G. & Round, J. (2012). Distributional Invariance and the Design of SAMs. Economic Systems Research, 24, 251-273.
Pyatt, G. & Round, J. (1985). Accounting and Fixed Price Multipliers in a Social Accounting Matrix Framework. In G. Pyatt, and J. Round, (coord.), Social Accounting Matrices. A Basis for Planning, 52-69, A World Bank Symposium, World Bank.
Round, J. (2003). Constructing SAMs for Development Policy Analysis: Lessons Learned and Challenges Ahead. Economic Systems Research, 15, 161-183.
Round, J. (1994). The Structure of the European Economy: a SAM Perspective. In: J. Round, (ed.), The European Economy in Perspective. Essays in Honour of Edward Nevin, 59-83, University of Wales Press, Cardiff. Round, J. (1991). A SAM for Europe: Problems and Perspectives. Economic Systems Research, 3, 249-268.
Santos, S. (2012). A SAM (Social Accounting Matrix) approach to the policy decision process. Working Paper No. 28/2012/Department of Economics/Research Unit on Complexity and Economics, ISEG-UTL.
Santos S. (2010). A quantitative approach to the effects of social policy measures. An application to Portugal, using Social Accounting Matrices. EERI (Economics and Econometrics Research Institute) RP (Research Papers) 2010/33; MPRA (Munich Personal RePEc Archive) Paper No. 23676.
Santos S. (2009).From the System of National Accounts (SNA) to a Social Accounting Matrix (SAM)-Based Model. An Application to Portugal. Edições Almedina, Coimbra-Portugal.
Santos S. (2007). Modelling Economic Circuit Flows in a Social Accounting Matrix Framework. An Application to Portugal. Applied Economics, 39, 1753-1771.