Performance of soy cultivars in the south of Minas
Gerais State, Brazil
Elaine Cristina Batista1
José Luiz de Andrade Rezende Pereira2
Adriano Teodoro Bruzi3
Everton Vinicius Zambiazzi4
Karina Barroso Silva5
Abstract
Cultivar evaluation is one of the basic steps recommended for a given region, since the best adapted cultivars have higher yields, and success in this parameter is based on the genotype of the material and its interaction with the environmental variables. The aim of this study was to evaluate the behavior of 23 soy cultivars in the soil-climatic conditions of the south region of Minas Gerais State (MG), Brazil, in the municipality of Inconfidentes. The evaluated traits were grain yield, plant height, height of insertion of the first legume and lodging. The experiments were conducted on the 2013/2014 and 2014/2015 harvests, adopting a randomized block design with three replicates and 23 treatments, which were constituted by the following cultivars: FAVORITA RR, BRS MG 760SRR, NA 5909 RG, NA 7200 RR, CD 2630, CD 250, NA 7620 RR, CD 2737, TMG 123, V-MAX RR, P 98Y11 RR, NS 7100 RR, BMX Potencia, Anta 82 RR, CD 237, V-TOP, TMG 1176 RR, TMG 1174 RR, TMG 1179 RR, TMG 1181 RR, BMX Força, Monsoy 7211 RR and BRS MG 780 RR. Of the studied cultivars, those that most stood out for the traits evaluated in the conditions of Inconfidentes (MG) were TMG 1179 RR (48.6 bags of 60 kg ha-1), NA 7200 RR (45.6 bags), CD 2737 (41.1 bags), CD 237 (41 bags) and
BRS MG 760 SRR (40.6 bags), all of which displayed satisfactory conditions for mechanical harvesting, demonstrating the good performance of the crop in the south region of Minas Gerais State.
Keywords: Glycine max. Grain yield. Evaluation. Regional Trial.
Introduction
At present, the soy crop has a wide geographic distribution, with cultivation present in most coun-tries. Because of its economic value and growth potential under various conditions, this legume species has shown constant technological development, which allowed a significant increase in its yield and ex-pansion of agricultural frontiers, among other benefits (OLIVEIRA et al., 2005). Its importance is mostly attached to food production, as it is used in animal and human feeding, but also in biodiesel production.
In Brazil, until the 1960s decade, soy did not represent economic importance amidst other crops. However, at the end of the 60s, this crop had remarkable growth. The demand for this oil seed
1 Instituto Biológico, mestranda em Sanidade, Segurança Alimentar e Ambiental no Agronegócio. elainebatsta-agro@hotmail.com. Rua Mario Matiolli, 190, Chácara Alvorada, Poços de Caldas (MG), CEP: 37706-005.
2 Instituto Federal de Ciência, Educação e Tecnologia do Sul de Minas Gerais, Campus Inconfidentes, professor pesquisador. joseluiz.pereira@ifsuldeminas.edu.br.
3 Universidade Federal de Lavras, professor pesquisador. adrianobruzi@dag.ufla.br.
has risen over the years inasmuch as that China has increased its soy consumption and opened a growing market for soy producers (WESZ JÚNIOR, 2014).
Among the annual crops planted in Brazil, soy is one of the most sensitive to environmental influences because of its high sensitivity to photoperiodism. This characteristic results in regionalized recommendations using specific cultivars (MORAIS et al., 2003). Cultivar evaluation is one of the basic steps for the recommendation for a given region, since the most adapted cultivars have higher yields, and success in this parameter is based upon the genotype of the material and its interaction with the environmental variables (YUYAMA, 1991).
With respect to the region of cultivation, the recommendation of a specific material should be made after trials using the largest possible number of cultivars, as this allows for a more precise selection of those adapted to the soil-climatic conditions, displaying use potential (YUYAMA, 1979).
The south region of Minas Gerais state holds the coffee, corn and dairy farming as traditional ac-tivities. However, today, it has been directed towards soy growing, which can be an ally in the rotation of crops with corn. In this sense, the intensification of well-adapted varieties is important. The agronomic characterization of soy varieties is also necessary for recommendations to be made with greater accuracy.
In view of the lack of research of this nature in the region and in an attempt to generate bases for an adequate choice of cultivars, the present study aimed to determine the agronomic performance of soy [Glycine max (L.) Merrill] varieties in the municipality of Inconfidentes (MG), Brazil.
Material and methods
The experiments were undertaken in the experimental area of the farm at the Federal Institute of Education, Science and Technology of South of Minas Gerais, Inconfidentes Campus (MG), in the harvest season, from November to April of the years 2013/2014 and 2014/2015.
The municipality of Inconfidentes is located at an altitude of 869 m, 22º19’01’’ S latitude and 46º19’40’’ W longitude (FAO, 1985). According to the Köppen classification, the climate of the re-gion is the typical temperate type, i.e. a dry-winter mesothermal (Cwb) type. Annual temperature in the region is 19.3 ºC, and average annual precipitation is 1,411 mm (BRASIL, 1992; FAO, 1985). Variations in average temperature and precipitation, measured every ten days over the course of the experiment, are depicted in Figures 1 and 2.
Figure 1. Mean temperature and accumulated precipitation per week from November 20, 2013 to April 22,
Figure 2. Mean temperature and accumulated precipitation per week from November 28, 2014 to April 02,
2015. IFSULDEMINAS - Inconfidentes Campus, Inconfidentes (MG), Brazil, 2016.
Source: Created by the authors, with the collaboration of Administrative Technician Bruno Manoel Rezende de
Melo from IFSULDEMINAS – Inconfidentes Campus (2015).
According to Souza (2015), the soil in the experimental area is a Red-Yellow Eutrophic Latosol (Brazilian soil taxonomy) of clayey texture. This area had been cultivated with corn for several years and was lying fallow since the previous summer and covered with weeds, which were mowed and incorporated into the soil during its preparation.
The following results were obtained in the chemical analysis of the 0-20 cm depth in the 2013/2014 harvest: organic matter = 4.14 g.dm-1; pH (H
2O) = 5.76; P = 20.29 mg.dm-3; K =
70.1 mg.dm-3; Ca = 6.16 cmol.dm-3; Mg = 1.42 cmol.dm-3; H+Al = 4.32 cmol.dm-3; Al = 0 cmol.
dm-3; base saturation = 64.24 %. As for the 2014/2015 harvest, the following soil properties were
revealed: organic matter = 3.10 g.dm-1; pH (H
2O) = 6.40; P = 16.99 mg.dm-3; K = 42.0 mg.dm-3;
Ca = 5.24 cmol.dm-3; Mg = 1.21 cmol.dm-3; H+Al = 2.93 cmol.dm-3; Al = 0 cmol.dm-3; base
saturation = 69.15 %. The clay content found in the area is 64 %.
Twenty-three commercial soy cultivars were used, these being the most cultivated in the south region of Minas Gerais, from different companies, and transgenic, as follows: FAVORITA RR, BRS MG 760SRR, NA 5909 RG, NA 7200 RR, CD 2630, CD 250, NA 7620 RR, CD 2737, TMG 123, V-MAX RR, P 98Y11 RR, NS 7100 RR, BMX Potencia, Anta 82 RR, CD 237, V-TOP, TMG 1176 RR, TMG 1174 RR, TMG 1179 RR, TMG 1181 RR, BMX Força, Monsoy 7211 RR, and BRS MG 780 RR.
The area intended for planting was prepared according to the conventional cultivation system, plowed once and disked twice. Subsequently, furrows were dug with a spacing of 0.5 m between rows. Soil amendments and fertilization were applied as recommended by the Committee of Soil Fertility of Minas Gerais State (RIBEIRO; GUIMARÃES; ALVAREZ, 1999); the fertilization applied in the planting furrow contained the 02-30-20 formula and was followed by topdressing with potassium chloride.
Seeds were planted on November 22, 2013 and November 28, 2014. These seeds were inocu-lated with Bradyrhizobium japonicum using the Nitro 1000® peat inoculant at the ratio of 1,200,000
bacteria per seed. Seeding was performed manually, and thinning was carried out 25 days after ger-mination, attempting to maintain 12 plants per linear meter (corresponding to 240,000 plants ha-1).
At stage V4, molybdenum (30 g ha-1) was applied onto the leaves. At 35 days after seeding, the area
All cultivation treatments were similar for both crop years. The treatments were implemented in a randomized-block design with three replicates. Experimental plots consisted of four 5-m rows spaced 0.50 m apart; the two central rows were used for the experimental evaluations.
At the beginning and end of each block, one row was cultivated to reduce the bordering effects. In this way, all plants in the plot underwent competition as they would in a conventional planting system.
During the development of the crop, the following agronomical variables were evaluated, following the phenological table of Fehr and Caviness (1977): plant height (in cm) - measured from the soil surface to the insertion of the raceme of the apex of the main stalk of the plant (R8), at which we determined the average of the height of five plants sampled at random in each plot; height of insertion of the first legume (in cm), from the soil surface to the lower extremity of the first pod (R8) - determined as the average of five plants, which were where the plant height was measured; lodging index - evaluated as recommended by Bernard et al. (1965), by classifying the plots by visual scores, as follows: 1 - all plants upright; 2 - some plants slightly lodged; 3 - all plants moderately bent (25 to 50 % of the plants lodged); 4 - all plants considerably bend (50 to 80 % of the plants lodged); and 5 - all plants lodged. Grain yield was assessed at the final maturation stage (harvest point), determined after harvesting and processing, threshing the pods and weighing the grains harvested in the usable area of each plot, with moisture standardized to 13 % and the values observed in the usable plots extrapolated to t ha-1, using the expression below:
GY= UGY - ((100-M) /87) at which:
GY = grain yield (t ha-1) corrected for the standard moisture of 13 %;
UGY = uncorrected grain yield (t ha-1);
M = grain moisture observed in the field (%).
The data of all variables were initially subjected to an individual analysis of variance in each experiment. With the results of these analyses, we also checked the assumption of homogeneity of va-riances by the Hartley test (RAMALHO; FERREIRA; OLIVEIRA, 2000), which is based on the division of the highest residual mean square by the lowest residual mean square of the individual analyses. A resulting value lower than seven was assumed as homogeneity of variances, which enabled a combi-ned analysis of the experiments. Thus, the data of each variable, obtaicombi-ned in each experiment, were subjected to a combined analysis of variance involving the experiments conducted in both harvests. Means were grouped by the Scott-Knott (1974) test at 1 % and 5 % probability levels. All analyses were carried out using the Sisvar statistical software (FERREIRA, 2011).
Results and discussion
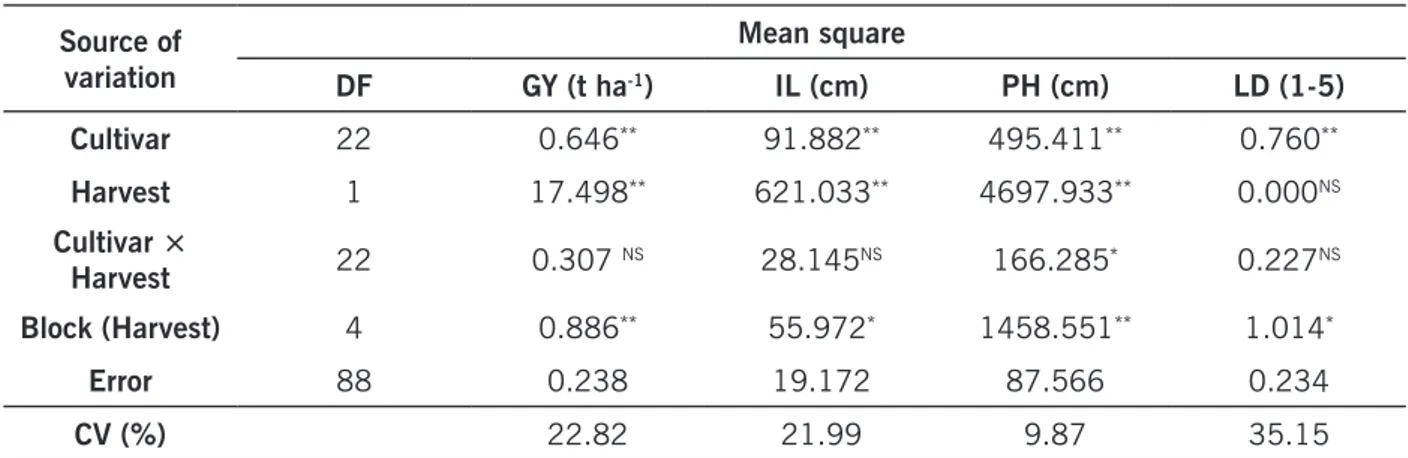
The summary of the combined analysis of variance is given in Table 1. As shown in the table, significant differences were present for the following traits: grain yield (GY), height of insertion of the first legume (IL), plant height (PH), and lodging (LD).
Table 1. Summary of the combined analysis of variance for yield (GY), height of insertion of the first legume
(IL), plant height (PH), and lodging (LD) of 23 soy cultivars evaluated in the 2013/2014 and 2014/2015 crop years. IFSULDEMINAS - Inconfidentes Campus. Inconfidentes (MG), Brazil. 2015.
Source of variation Mean square DF GY (t ha-1) IL (cm) PH (cm) LD (1-5) Cultivar 22 0.646** 91.882** 495.411** 0.760** Harvest 1 17.498** 621.033** 4697.933** 0.000NS Cultivar × Harvest 22 0.307 NS 28.145NS 166.285* 0.227NS Block (Harvest) 4 0.886** 55.972* 1458.551** 1.014* Error 88 0.238 19.172 87.566 0.234 CV (%) 22.82 21.99 9.87 35.15
NS Not significant by the F test; **,* Significant at the 1 and 5 % probability levels by the F test, respectively.
Source: Elaborated by the authors (2015)
All variables showed significant differences for the harvest factor, except for lodging (LD), indicating that the climatic conditions in each year influenced the behavior of the evaluated cultivars in a different manner.
The main differences observed in the performance of the cultivars in the different harvests are possibly due to the water-deficit period that occurred in the 2013/2014 harvest, which might have elevated the rate of absorption and conversion of solar radiation, directly affecting the expression of traits, as shown in Figure 1. According to Confalone and Dujmovich (1999), soy has a constant solar radiation absorption and conversion efficiency over the entire course of the cycle, under optimal development conditions. However, in water-stress situations, this conversion ability is changed, decreasing with severe stresses and increasing with mild stresses. Based on the observed deficit period, it is noted that for the 2013/14 harvest, precipitation reached only an accumulated total of 491 mm; nevertheless, this amount of rain was sufficient to meet water requirements for the crop to complete its physiological cycle, which varies from 450 to 800 mm (EMPRESA BRASILEIRA DE PESQUISA AGROPECUÁRIA - EMBRAPA, 2013). However, a factor that might have caused the crop to be further compromised was the distribution of rain throughout the crop cycle, which occurred non-uniformly when compared with the subsequent harvest, resulting in long intervals without rain. In the 2014/2015 harvest, in turn, precipitation was better distributed throughout the crop cycle, in addition to satisfactorily meeting the water requirement of the crop with 811 mm accumulated, as depicted in Figure 2.
The cultivar × harvest interaction effect was significant only for PH (Table 1). As stated by Lin, Binns and Lefkovitch (1986), the cultivar × harvest (or crop year) interaction depends on unpredictable environmental factors, e.g. occurrence of rain, Indian summer, frost and attacks of pests and diseases. Because these environmental factors occur randomly, breeders cannot minimize them; one alternative is to evaluate the average performance of cultivars in the different environments or cultivation years, which was the strategy adopted in the current study.
The classification for the coefficients of variation of experimental trials with soy depends on the evaluated trait and on the location (ROCHA et al., 2012). The coefficient of variation (CV %) obtained in the analysis of variance of an experimental trial indicates the degree of precision for the experiment (PIMENTEL - GOMES, 1985). Plant height showed a low coefficient of experimental variation (9.87 %). Grain yield (22.82 %) and IL (21.99 %), however, showed relatively high coefficients of variation, which
can be attributed to the fact that these factors are highly influenced by the environment. As for the lodging variable, the high coefficient of variation (35.15 %) is a consequence of the high variation of scores assigned to the treatments in both years under assessment, which were within the range of 1 to 5 (Table 1).
The significant result of the F test in the analysis of variance indicates statistical differences be-tween the treatments. The practical validity of the tests of means used in situations with a large number of treatments is questionable; for such cases, the usual tests of comparison of means, two-by-two, are not the most suitable because they do not allow for an adequate separation of groups of means, thereby complicating the interpretation of results. The applied Scott-Knott test is aimed at clustering the means of treatments into very distinct groups by minimizing the variation within groups.
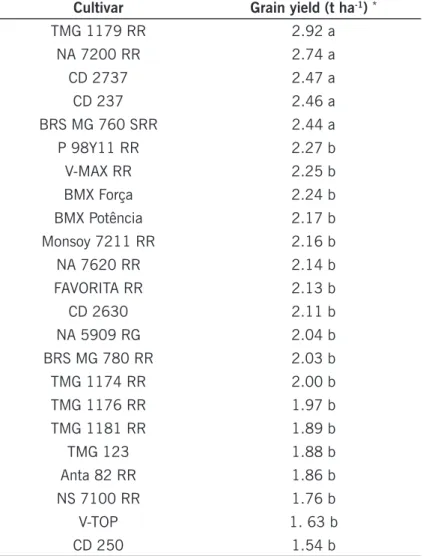
For grain yield, a variation range of 1.38 t ha-1 (23 bags of 60 kg ha-1) was observed between the
evaluated cultivars, with TMG 1179 RR standing out in the group of the most productive ones, yielding 2.92 t ha-1 (48.6 bags). Of the assessed varieties, only TMG 1179 RR and NA 7200 RR had superior
performance to the 2013/2014 average for the state of Minas Gerais, which was 2.658 t ha-1 (44.3 bags)
according to data provided by COMPANHIA NACIONAL DE ABASTECIMENTO -CONAB (2015) (Table 2).
Table 2. Mean values for grain yield (t ha-1) of 23 soy cultivars evaluated in the 2013/2014 and 2014/2015
crop years. IFSULDEMINAS - Inconfidentes Campus. Inconfidentes/MG, Brazil. 2015.
Cultivar Grain yield (t ha-1) *
TMG 1179 RR 2.92 a NA 7200 RR 2.74 a CD 2737 2.47 a CD 237 2.46 a BRS MG 760 SRR 2.44 a P 98Y11 RR 2.27 b V-MAX RR 2.25 b BMX Força 2.24 b BMX Potência 2.17 b Monsoy 7211 RR 2.16 b NA 7620 RR 2.14 b FAVORITA RR 2.13 b CD 2630 2.11 b NA 5909 RG 2.04 b BRS MG 780 RR 2.03 b TMG 1174 RR 2.00 b TMG 1176 RR 1.97 b TMG 1181 RR 1.89 b TMG 123 1.88 b Anta 82 RR 1.86 b NS 7100 RR 1.76 b V-TOP 1. 63 b CD 250 1.54 b
* Means followed by the same letter belong to the same group according to the Scott-Knott (1974) test at the 5 % probability level.
The five cultivars with the highest yield did not differ statistically from each other, with results ranging from 2.92 t ha-1 (48.6 bags of 60 t ha-1) to 2.44 t ha-1 (40.6 bags). In a descending order of
yield, these five were ranked as follows: TMG 1179 RR, NA 7200 RR, CD 2737, CD 237 and BRS MG 760 SRR. The worst yield was obtained by CD 250: 1.54 t ha-1 (25.6 bags).
In a study conducted by Gesteira et al. (2015) for the selection of soy cultivars for cultivation in the south region of Minas Gerais in two crop years (2012/2013 and 2013/2014), the authors found that cultivars CD 2737 (3.685 t ha-1), TMG 1176 (3.539 t ha-1), TMG 1179 (3.518 t ha-1) and BMX
Força (3.474 t ha-1) had superior yields to the other evaluated cultivars and also satisfactory
condi-tions for mechanical harvesting.
It should be noted that the grain yield trait is highly influenced by environmental factors such as moisture, temperature and especially photoperiod, which all vary with the different times of the year. High yields can be obtained when the afore-mentioned conditions allow for optimal development stages (GUIMARÃES et al., 2008).
According to Evans (1993), the grain-yield potential can be defined as the production of a cultivar in an environment to which it is adapted, without soil-climatic or nutritional limitations, free of the action of pests and diseases, and with the other stressing agents effectively controlled. In this scenario, relevant factors might have negatively influenced yield in this experiment, especially concer-ning the supply of water to the plants, since the 2013/2014 crop year was considered atypical due to the high temperatures and low rainfall during the experimental period.
The soy crop is strongly influenced by climatic factors (temperature, light, precipitation, among others); therefore, the harvest effect was expected to be significant and to influence the average grain yield of the experiments, since the climatic conditions oscillated considerably from one year to the other, as it was shown in Figures 1 and 2.
Thus, the average GY obtained in the 2014/2015 harvest was superior by 71 % in comparison with the 2013/2014 harvest (Table 3).
Table 3. Mean values for grain yield (t ha-1) of soy in the 2013/2014 and 2014/2015 crop years. IFSULDEMINAS
- Inconfidentes Campus. Inconfidentes (MG), Brazil. 2015.
Crop year Mean (t ha-1) *
2013/2014 1.782 b
2014/2015 2.494 a
* Means followed by different letters differ by the F test (P ≤ 0.05).
Source: Elaborated by the authors (2015).
This was mainly due to the greater precipitation occurring in the 2014/2015 crop year (811 mm) as compared with 2013/2014 (491 mm), in addition to a more uniform distribution of the rain from pre-planting to harvest. However, these differences were expected, since there are reports in the literature (MEOTTI et al., 2012) confirming the effect of crop year or harvest in the soy crop.
Three groups were formed for IL (Table 4), with an average variation of 13.47 to 30.96 cm, corresponding to cultivars CD 250 and BRS MG 780 RR, respectively.
Table 4. Mean values for height of insertion of the first legume (cm) of the 23 soy cultivars evaluated in the
2013/2014 and 2014/2015 crop years. IFSULDEMINAS - Inconfidentes Campus. Inconfidentes (MG), Brazil. 2016.
Cultivar Height of the 1st legume (cm) *
BRS MG 780 RR 30.96 a Monsoy 7211 RR 24.58 b FAVORITA RR 24.55 b P 98Y11 RR 24.35 b TMG 1176 RR 22.81 b TMG 123 22.48 b Na 7620 RR 22.20 b BRS MG 760SRR 21.88 b TMG 1174 RR 21.00 b CD 237 19.97 c BMX Força 19.40 c Anta 82 RR 18.94 c BMX Potência 18.21 c CD 2630 17.97 c TMG 1181 RR 17.80 c NA 5909 RG 17.66 c V-MAX RR 17.40 c V-TOP 17.19 c NA 7200 RR 16.95 c CD 2737 16.40 c TMG 1179 RR 15.99 c NS 7100 RR 15.75 c CD 250 13.47 c
* Means followed by the same letter belong to the same group according to the Scott-Knott (1974) test at the
5 % probability level.
Source: Elaborated by the authors (2015).
According to Marcos Filho et al. (1989), the cultivar chosen for cultivation in a given location should have the first legume at a height from 10.0 to 12.0 cm; however, for most conditions found in soy crops, the most satisfactory height is around 15.0 cm. Therefore, all the cultivars evaluated here had an IL suitable for mechanized harvesting, which would prevent possible losses during the harvest.
Rocha et al. (2012) declared that cultivars with an IL higher than 15 to 20 cm facilitate the harvest and have fewer losses, but they may also have a lower yield. This was not true for the present study, at which cultivar CD 250 showed the lowest IL (13.47 cm) and obtained the lowest yield of all cultivars assessed (1.54 t ha-1). Environmental factors or cultivation treatments affecting plant height
can also influence the height of insertion of the first pod (SEDIYAMA et al., 1972).
In the opinion of Bruscke et al. (2007), late planting or early cultivars usually originate shorter plants than they would at the time deemed ideal for planting. As a consequence, the height of inser-tion of the first legumes also tends to decrease.
In this way, it is important to observe that a good portion of the cultivars evaluated here are classified as early or semi-early, which may explain the fact that the 2013/2014 harvest had plants with a greater IL, since this crop was planted on 11/22/2013, while in the following harvest the soy was planted on 11/28/2014 (Table 5).
Table 5. Average height of insertion of the first legume (cm) in the 2013/2014 and 2014/2015 crop years.
IFSULDEMINAS - Inconfidentes Campus. Inconfidentes/MG, Brazil. 2016.
Harvest Mean (cm) *
2013/2014 22.0 a
2014/2015 17.8 b
* Means followed by different letters differ by the F test (P ≤ 0.05).
Source: Elaborated by the authors (2015).
The harvest × cultivar interaction effect was significant only for the plant height variable (Table 6).
Table 6. Mean values for plant height (cm) of 23 soy cultivars evaluated in the 2013/2014 and 2014/2015
crop years. IFSULDEMINAS - Inconfidentes Campus. Inconfidentes (MG), Brazil. 2016.
Treatment Harvest Mean *
2013/2014 * 2014/2015 * Anta 82 RR 99.0 a B 90.2 a B 94.6 B BMX Força 102.2 a A 84.4 b B 93.3 B BMX Potência 88.4 a B 90.0 a B 89.2 B BRS MG 760SRR 116.3 a A 103.8 a A 110.1 A BRS MG780 RR 118.9 a A 111.1 a A 115.0 A CD 237 96.9 a B 84.8 a B 90.9 B CD 250 84.6 a B 78.3 a B 81.4 C CD 2630 109.8 a A 88.9 b B 99.3 B CD 2737 97.2 a B 106.2 a A 101.7 A FAVORITA RR 110.9 a A 79.6 b B 95.2 B Monsoy 7211 RR 111.7 a A 109.3 a A 110.5 A NA 5909 RG 79.1 a B 67.7 a B 73.3 C NA 7200 RR 97.0 a B 89.3 a B 93.1 B NA 7620 RR 102.7 a A 81.2 b B 92.0 B NS 7100 RR 103.8 a A 76.4 b B 90.1 B P 98Y11 RR 106.6 a A 89.5 b B 98.1 B TMG 1174 RR 91.3 a B 93.9 a B 92.6 B TMG 1176 RR 102.9 a A 90.2 a B 96.5 B TMG 1179 RR 103.6 a A 82.0 b B 92.8 B TMG 1181 RR 93.2 a B 97.3 a A 95.2 B TMG 123 106.3 a A 86.0 b B 96.1 B V-MAX RR 95.0 a B 72.9 b B 83.9 C V-TOP 97.2 a B 93.4 a B 95.3 B * Mean 100.6 a 89.0 b
*Means followed by lowercase letters in the row differ by the Scott-Knott (1974) test (P ≤ 0.05) within each
harvest, and means followed by different uppercase letters in the column differ by the Scott-Knott (1974) test (P ≤ 0.05) between harvests.
Plant height is an essential trait in the determination of a cultivar to be introduced in a region, since it is correlated with grain yield, weed control and losses during mechanized harvesting. Varia-tions in PH can be influenced by the time of seeding, spacing between and within rows, moisture supply, temperature, soil fertility, photoperiodic response of the cultivar and other environmental conditions (ROCHA et al., 2012).
Rezende et al. (2007) considered a PH between 60 and 120 cm suitable for mechanized har-vesting, resulting in no losses or damage. Based on this information, all the evaluated cultivars are observed to be within the range recommended by those authors, irrespective of the harvest, which demonstrates the adaptation of these materials to the south region of Minas Gerais.
Lodging has a fundamental importance in the selection of cultivars, considering that it can cau-se loscau-ses during mechanized harvesting. Scores from 1.00 to 2.33 were obcau-served for this variable. The cultivar that obtained the highest lodging index was TMG 123, with 2.33 (Table 7).
Table 7. Mean values for lodging (scores of 0 to 5) of 23 soy cultivars evaluated in the 2013/2014 and
2014/2015 crop years. IFSULDEMINAS - Inconfidentes Campus. Inconfidentes (MG), Brazil. 2016.
Cultivar Lodging (1-5) * BMX Força 1.00 a BRS MG 760SRR 1.00 a NS 7100 RR 1.00 a V-MAX RR 1.00 a NA 5909 RG 1.00 a CD 250 1.00 a CD 2737 1.00 a FAVORITA RR 1.16 a NA 7200 RR 1.16 a BMX Potência 1.16 a TMG 1179 RR 1.33 a V-TOP 1.33 a NA 7620 RR 1.50 b CD 237 1.50 b CD 2630 1.50 b Anta 82 RR 1.50 b P 98Y11 RR 1.50 b TMG 1174 RR 1.66 b Monsoy 7211 RR 1.66 b BRS MG 780 RR 1.66 b TMG 1181 RR 1.83 b TMG 1176 RR 1.83 b TMG 123 2.33 b
*Means followed by the same letter in the column belong to the same group according to the Scott-Knott (1974) test at the 5 % probability level.
Seven cultivars were assigned score 1.0, corresponding to all plants upright, thus considered adapted to the region. In both harvests, the cultivars behaved in the same way, without significant differences for this variable in relation to the crop year.
For Shigihara and Hamawaki (2005), lodging directly affects the performance of harvesters, since lodged plants mean losses in grain yield due to the inability to harvest them, in addition to possible losses stemming from the direct contact of the soil with the pods, with appearance of fungi and pests.
According to Rocha et al. (2012), lodging is a trait highly influenced by the type of soil and by the plant development conditions. In general, soy plants lodge more in fertile and heavy soils, with abundant moisture, than in light and sandy soils. Another point to be taken into account is plant height. Taller plants usually lead to a higher lodging index because of their finer stems, which renders them more prone to lodging due to the action of wind, as was observed for cultivars TMG 123, TMG 1181 RR, TMG 1176 RR, TMG 1174 RR, Monsoy 7211 RR, and BRS MG 780 RR, which displayed the highest scores for lodging, ranging from 1.66 to 2.33 (Table 7), and also PH greater than 80 cm (Table 6).
The analysis of the data obtained in this study reveals that the cultivars have potential for good adaptation to the region when associated with a low degree of lodging, given that the highest score for this variable was 2.33, which corresponds to only a few plants lodged or bent.
Conclusion
In the studied conditions, five cultivars were identified as having the best agronomic perfor-mance for the municipality of Inconfidentes (MG), with an average yield higher than 2.4 t ha-1 (40
bags of 60 kg ha-1): TMG 1179 RR, NA 7200 RR, CD 2737, CD 237 and BRS MG 760 SRR. These
five varieties have satisfactory features for mechanical harvesting.
Desempenho de cultivares de soja na região sul de Minas Gerais, Brasil
Resumo
A avaliação de cultivares é um dos pontos básicos para a recomendação para determinada região, pois as mais adaptadas apresentam maiores níveis de produtividade e o sucesso em rela-ção a esse parâmetro é condicionado pelo genótipo do material e pela sua interarela-ção com as va-riações ambientais. Objetivou-se com este trabalho avaliar o comportamento de 23 cultivares de soja nas condições edafoclimáticas da região sul de Minas Gerais no município de Inconfidentes (MG). Os caracteres avaliados foram produtividade de grãos, altura de plantas, altura de inserção do primeiro legume e acamamento. Os experimentos foram conduzidos nas safras 2013/2014 e 2014/2015, adotando-se o delineamento experimental de blocos casualizados com três repeti-ções e 23 tratamentos, constituídos pelas cultivares: FAVORITA RR, BRS MG 760SRR, NA 5909 RG, NA 7200 RR, CD 2630, CD 250, NA 7620 RR, CD 2737, TMG 123, V-MAX RR, P 98Y11 RR, NS 7100 RR, BMX Potencia, Anta 82 RR, CD 237, V-TOP, TMG 1176 RR, TMG 1174 RR, TMG 1179 RR, TMG 1181 RR, BMX Força, Monsoy 7211 RR e BRS MG 780 RR. Pode-se inferir que, das cultivares estudadas, as que mais se destacaram entre as características avaliadas nas condições da cidade de Inconfidentes (MG) foram: TMG 1179 RR (48,6 sacas de 60 kg ha-1),
sacas de 60 kg ha-1) e BRS MG 760 SRR (40,6 sacas de 60 kg ha-1), com todas apresentando
condições satisfatórias para a colheita mecânica, o que demonstra o bom desempenho da cultura na região sul de Minas Gerais.
Palavras-chave: Glycine max. Produtividade de grãos. Avaliação. Ensaio regional.
Referências
BERNARD, R. L
.; CHAMBERLAIN, D. W.; LAWRENCE, R. D. (Eds.). Result of the cooperativeuni-form soybeans tests. Washington: USDA, p. 134, 1965.
BRASIL. Ministério da Agricultura. Escritório de Meteorologia. Normais climatológicas
(1961-1990). Brasília, DF: Ministério da Agricultura e Reforma Agraria.1992, p. 84.
BRUSCKE, E. L.; POLIZEL, A.; SOLINO, J.; BARROS, L.; RUDNICK, V.; MAIA, D. Desempenho agronômico de linhagens de soja de ciclo semitardio/tardio. In: I SEPEX – Seminário de Pesquisa e
Extensão Rural. Rolim de Moura, 2007.
COMPANHIA NACIONAL DE ABASTECIMENTO (CONAB). Acompanhamento da safra brasileira de
grãos. v. 2 - Safra 2014/15, n. 12 – Décimo Segundo Levantamento, Brasília, set., p. 98-105, 2015.
Disponível em: < http://www.conab.gov.br/OlalaCMS/uploads/arquivos/15_09_11_08_57_48_bole-tim_graos_setembro_2015.pdf>. Acesso em: 04 set. 2017.
CONFALONE, A.; DUJMOVICH, M. N. Influência do “déficit” hídrico sobre a eficiência da radiação solar em soja. Revista Brasileira de Agrociência, v. 5, n. 3, p. 195-198, dez. 1999.
EMPRESA BRASILEIRA DE PESQUISA AGROPECUÁRIA (EMBRAPA). Tecnologias de produção de
soja – Região Central do Brasil 2014. Londrina: Embrapa Soja, 2012, p. 265. (Embrapa Soja.
Sis-temas de produção, 16).
EVANS, L. T. Crop evolution, adaptation and yield. Cambridge, Inglaterra: Cambridge University Press, 1993. p. 500.
FOOD AND AGRICULTURE ORGANIZATION OF THE UNITED NATIONS (FAO). Agroclimatological
data for Latin América and Caribean. Roma, 1985. (Coleção FAO: Produção e Proteção Vegetal, v. 24).
FEHR, W. R.; CAVINESS, C. E. Stages of soybean development. Ames: Iowa State University of Sci-ence and Technology, 1977. p. 11. Disponível em: <http://lib.dr.iastate.edu/cgi/viewcontent.cgi?arti-cle=1076&context=specialreports>. Acesso em: 31 ago. 2017.
FERREIRA, D. F. Sisvar: a computer statistical analysis system. Ciência e Agrotecnologia, Lavras, v. 35, n. 6, p. 1039-1042, 2011.
GESTEIRA, G. S.; ZAMBIAZZI, E. V.; BRUZI, A. T.; SOARES, I. O.; REZENDE, P. M.; SILVA, K. B. Se-leção fenotípica de cultivares de soja precoce para a região sul de Minas Gerais. Revista
Agrogeoam-biental, Pouso Alegre, v. 7, n. 3, p. 79-88, set. 2015. Disponível em: http://dx.doi.org/10.18406/
GUIMARÃES, F. S.; REZENDE, P. M.; CASTRO, E. M.; CARVALHO, E. A.; ANDRADE, M. J. B.; CAR-VALHO, E. R. Cultivares de soja [Glycine max(L.) Merrill] para cultivo de verão na região de Lavras--MG. Ciência e Agrotecnologia, Lavras, v. 32, n. 4, p. 1099-1106, ago. 2008.
LIN, C. S.; BINNS, M. R.; LEFKOVICTH, L. P. Stability analysis. Where do we stand? Crop Science, v. 26, n. 5, p. 894-899, 1986. Disponível em: <https://dl.sciencesocieties.org/publications/cs/abs-tracts/26/5/CS0260050894?access=0&view=pdf>. Acesso em: 30 ago. 2017.
MARCOS FILHO, J.; GODOY, O. P.; CÂMARA, G. M. S. Soja: produção, pré-processamento e trans-formação agroindustrial. São Paulo: Secretaria da Indústria, Comércio, Ciência e Tecnologia, p.1-40, 1989.
MEOTTI, G. V.; BENIN, G.; SILVA, R. R.; BECHE, E.; MUNARO, L. B. Épocas de semeadura e desempe-nho agronômico de cultivares de soja. Pesquisa Agropecuária Brasileira, v. 47, n. 1, p. 14-21, 2012. Disponível em: <http://www.scielo.br/pdf/pab/v47n1/47n01a03.pdf>. Acesso em: 30 ago. 2017. MORAIS, L. K.; PINHEIRO, J. B.; MOURA, M. F.; AGUIAR, A. V.; CARBONELL, S. A. M.; ZUCCHI, M. I.; FERNANDES, N. Estabilidade e adaptabilidade de cultivares de soja em diferentes épocas de semeadura utilizando a metodologia AMMI. Bioscience Journal, v. 19, n. 1, 2003.
NOVAIS, R. F. Soja. In: RIBEIRO, A. C.; GUIMARÃES, P. T. G.; ALVAREZ V, V. H. Recomendação para
o uso de corretivos e fertilizantes em Minas Gerais, 5ª Aproximação, Viçosa, 1999. p. 323-324.
OLIVEIRA, R. C. de; DI MAURO, A. O.; UNÊDA-TREVISOLI, S. H.; SANTOS, J. M. dos; OLIVEIRA, J. A. de; PERECIN, D.; ARANTES, N. E. Progênies superiores de soja resistentes ao tipo 3 do nema-tóide de cisto da soja. Pesquisa Agropecuária Brasileira, Brasília, v. 40, n. 8, p. 745-751, 2005. Disponível em: < https://www.embrapa.br/busca-de-publicacoes/-/publicacao/116453/progenies-su-periores-de-soja-resistentes-ao-tipo-3-do-nematoide-de-cisto-da-soja>. Acesso em: 30 ago. 2017. PIMENTEL GOMES, F. Curso de Estatística Experimental. 11. ed. São Paulo, Nobel, 1985. p. 430. RAMALHO, M. A. P.; FERREIRA, D. F.; OLIVEIRA, A. C. A experimentação em genética e
melhora-mento de plantas. Lavras: UFLA, 2000, p. 114-134.
REZENDE, P. M. de; CARVALHO, E. A. Avaliação de cultivares de soja [Glycine max (L.) Merrill] para o sul de Minas Gerais. Ciência e Agrotecnologia, v. 31, n. 06, p. 1616-1623, 2007. Disponível em: <http://www.scielo.br/scielo.php?script=sci_arttext&pid=S1413-70542007000600003>. Acesso em: 30 ago. 2017.
ROCHA, R. S.; SILVA, J. A. L. da; NEVES, J. A.; SEDIYAMA, T.; TEIXEIRA, R. de C. Desempenho agronômico de variedades e linhagens de soja em condições de baixa latitude em Teresina-PI. Revista
Ciência Agronômica, v. 43, n. 1, p. 154-162, 2012. Disponível em:< http://ccarevista.ufc.br/seer/
index.php/ccarevista/article/view/1203>. Acesso em: 30 ago. 2017.
SCOTT, A.; KNOTT, M. Cluster-analysis method for grouping means in analysis of variance. Biometrics, Washington DC., v. 30, n. 3, p. 507-512, 1974.
SEDIYAMA, T.; CARDOSO, A. A.; VIEIRA, C.; ATHOW, K. L. Efeito de espaçamento entre e dentro das fileiras de plantio sobre duas variedades de soja, em Viçosa e Capinópolis. Revista Ceres, Viçosa, v. 19, n. 104, p. 89-107, 1972.
SHIGIHARA, D.; HAMAWAKI, O. T. Seleção de Genótipos para Juvenilidade em Progênies de soja (Glycine max (L.) Merrill). Revista Eletrônica. Universidade Federal de Uberlândia (UFU), Uberlân-dia-MG, p. 01-26, 2005.
SOUZA, C. K. Caracterização físico-ambiental da fazenda-escola do IFSULDEMINAS - Câmpus Incon-fidentes, MG. 2015 (no prelo).
WESZ JÚNIOR, V. J. O mercado da soja no Brasil e na Argentina: semelhanças, diferenças e interco-nexões. Século XXI, Revista de Ciências Sociais, v. 4, n. 1, p. 114-161, 2014.
YUYAMA, K. Ensaio de épocas de plantio sobre várias características agronômicas na cultura de soja (Glycine max (L.) Merrill), variedades “Júpiter”, “Prata”, “Oriente” e “Pelicano”, em Aripuanã-MT.
Acta amazonica, Manaus, v. 9, n. 3, p. 419-436, 1979.
YUYAMA, K. Avaliação de algumas características agronômicas e morfofisiológicas de cinco
culti-vares de soja (Glycine max (L.) Merrill), cultivados em solo de várzea e de terra firme da Amazônia Central.130 f. 1991. Tese (Doutorado em Agronomia - Produção Vegetal) - Universidade Estadual
Paulista, Jaboticabal. Histórico editorial: Submetido em: 08/04/2016 Aceito em: 04/07/2016 Como citar: ABNT
BATISTA, E. C.; PEREIRA, J. L. A. R.; BRUZI, A. T.; ZAMBIAZZI, E. V.; SILVA, K. B. Performance of soy cultivars in the south of Minas Gerais State, Brazil. Revista Agrogeoambiental, Pouso Alegre, v. 9, n. 3, p. 23-36, jul./set. Doi: http://dx.doi.org/10.18406/2316-1817v9n32017976
APA
BATISTA, E. C., PEREIRA, J. L. A. R., BRUZI, A. T., ZAMBIAZZI, E. V. & SILVA, K. B. (2017). Performance of soy cultivars in the south of Minas Gerais State, Brazil. Revista Agrogeoambiental, Pouso Alegre, 9 (3), 23-36. Doi: http://dx.doi.org/10.18406/2316-1817v9n32017976
ISO
BATISTA, E. C.; PEREIRA, J. L. A. R.; BRUZI, A. T.; ZAMBIAZZI, E. V. e SILVA, K. B. Performance of soy cultivars in the south of Minas Gerais State, Brazil. Revista Agrogeoambiental, 2017, vol. 9, n. 3, pp. 23-36. Eissn 2316-1817. Doi: http://dx.doi.org/10.18406/2316-1817v9n32017976
VANCOUVER
Batista EC, Pereira JLAR, Bruzi AT, Zambiazzi EV, Silva KB. Performance of soy cultivars in the south of Minas Gerais State, Brazil. Rev agrogeoambiental. 2017 jul/set; 9(3): 23-36.