Quantification by FT-IR (UATR/NIRA) of NBR/SBR blends
Joyce Baracho Azevedo
1,2, Lidia Mattos Silva Murakami
1,2, Ana Carolina Ferreira
3, Milton Faria Diniz
4,
Leandro Mattos Silva
5and Rita de Cássia Lazzarini Dutra
1*1
Instituto Tecnológico de Aeronáutica – ITA, São José dos Campos, SP, Brasil
2
Tenneco Automotive Brasil, Cotia, SP, Brasil
3
General Motors do Brasil – GM, São Caetano do Sul, SP, Brasil
4
Divisão de Química – AQI, Instituto de Aeronáutica e Espaço – IAE, São José dos Campos, SP, Brasil
5
Petroquímica Braskem S.A., Santo André, SP, Brasil
Abstract
Rubber blends are important materials in automotive industry, as well as in other sectors. However, there are implications when suitable use of a polymer in an artifact is not made. In the automotive area, for example, the use of an elastomer
without the fuel resistance requirement would result in component degradation, potential fuel leakage, and danger of fire.
The use of polymer blends may be the solution to this problem. Fourier transform infrared spectroscopy (FT-IR) can be used for the knowledge of the polymer content of these blends. Then, FT-IR quantitative methodologies for determining acrylonitrile-butadiene copolymer (NBR) copolymer and butadiene-styrene copolymer (SBR) contents were developed
by the transflectance accessory, NIRA, and the transmission mode, being the sample analyzed by transmission and universal attenuated total reflection (UATR) in the medium infrared (MIR). UATR and NIRA methodologies showed better accuracy. However, the MIR analysis showed a detection limit between 10-20% of NBR.
Keywords: content, NBR, NIRA, SBR, UATR.
1. Introduction
In contrast to the deceleration in the new polymers production, there is a growing interest in the processes research and development for the modification of existing polymers[1]. In this context, polymer blends are available for specific applications. According to the literature, the
necessary condition is that the lower content of one of
components must exceed at least 5%[2,3].
Blends are often used to improve properties of each polymer involved in the product, process and/or reduce cost. There are many applications in several industries, such as aeronautics, naval, automotive, graphics, real estate, among others. Therefore, studies involving polymers and their blends are attractive, since the methodologies developed can be used in different sectors[1,4].
Butadiene-based copolymers are widely used in automotive
industry. Among these, the SBR and NBR copolymers are
outstanding. SBR plays a major role in the market due to its application in tires production. When SBR is used in conjunction with the BR-high cis butadiene homopolymer, excellent properties are obtained for application to tire tread. Since year 2000, automobile and tire manufacturers have been concerned about the environment and which led them to invest in new cleaner synthetic processes for production of these elastomers. Butadiene is a monomer used in the manufacture of elastomers of great economic interest
worldwide. According to their properties, the polymers are
assigned to a specific type of use[5].
There are several blends available in the world market, but for the purpose of this paper, the blend composed of NBR and SBR copolymers was selected based on its properties which are suitable on lowering costs by improving certain properties of NBR rubber, which has good chemical and oil resistance. However, these properties vary according to a considerable number of rubber products. Higher
the acrylonitrile (AN) content, greater the oil resistance,
however lower the flexibility. It is possible to use a NBR
blend of high content AN with SBR rubber to obtain an oil resistance degree as such a NBR with low content of AN,
with an overall economy in cost. NBR products with high
AN content tends to shrink in contact with lubricating oils,
in high temperature. The manufacture of NBR/SBR blends constitutes a solution for the final artifact achieve desired properties. SBR can also improve NBR processing[6].
In the automotive industry, NBR is usually applied in hoses that have direct contact with fuels or gases [5]. NBR is
also used in the aerospace industry, as rocket motor thermal insulation[7]. It comes to our attention that the quality of
the product delivered by the supplier might not meet the specification needed, consisting only by NBR. This may lead to detachments compromising the integrity of the rubber / propellant interface.
of -40 to 108°C makes it the ideal material for aeronautical applications. Still, NBR can be applied to create molded products, adhesives, sealants, sponges, expanded foams and carpets[8].
A variation in polymerization, AN ratio to butadiene, processing properties and vulcanization are characteristics
added in NBR / SBR blend by NBR rubber worth to mention.
The AN content is one of the main criteria to define the basic
properties of an elastomer. Nitrile group polarity grants to elastomers resistance to oils and hydrocarbon-based solvents, flexibility and abrasion resistance[5]. In this paper, a NBR rubber with AN content of 37-41% was used according to NBR supplier. Additionally, a FT-IR methodology developed
by the group[9] was applied to precisely acquire the AN value. The AN content determination in NBR have been
performed by FT-IR transmission with values reference obtained by Kjeldhal method[10], measuring contents up to around 40%. FT-IR transmission and reflection (UATR)
techniques[9] were used for determining contents up to around 50%, with good results, indicating that UATR methodology
presents better linear correlation and less analysis time. One of the most common blend elastomer is the SBR
responsible for nearly 40% of all synthetic rubber used in the world. According to data from 2007, approximately
2.4 million tons of SBR per year were already produced in the world[5]. SBR rubber characteristics depend on styrene content, which can vary between 10 and 85%. Formulations
with low styrene content exhibit an elastomeric behavior, whereas those with high styrene content have a thermoplastic
nature[11]. SBR-1502 was object of this study, with 23.5% styrene, obtained by cold polymerization (10°C maximum)
in emulsion of fatty and resinous soaps, coagulated in a
salt / acid or acid system and stabilized with a non-smelly
antioxidant.
SBR rubber has good mechanical properties, high resistance. Likewise, it has good resistance to abrasion,
ozone and weathering, but regarding to oil resistance it
presents a gap, making this mixture with NBR beneficial for both copolymers, dependent on the suitable application of the final artifact[12].
The property variations are dependent on the functional groups content of the polymers and also compounds present in the product composition. Therefore, the possibility of using blends to reach a specific application indicates the
need for suitable characterization and/or quantification of
these materials. Instrumental techniques, mainly Fourier transform infrared spectroscopy (FT-IR), associated or not with other techniques, is mentioned in the literature for this goal, including also studies of polymers used in the automotive and aerospace industry, such as NBR, SBR and their polymer blends[13-18].
Table 1 shows some studies. Although good results were achieved in these studies, some observations were made in this study, which served as a basis for the elaboration of the methodology currently developed.
It is observed that the MIR region is the most used, just as
the technique obtaining FT-IR spectra is the conventional one, which means transmission and the use of other instrumental
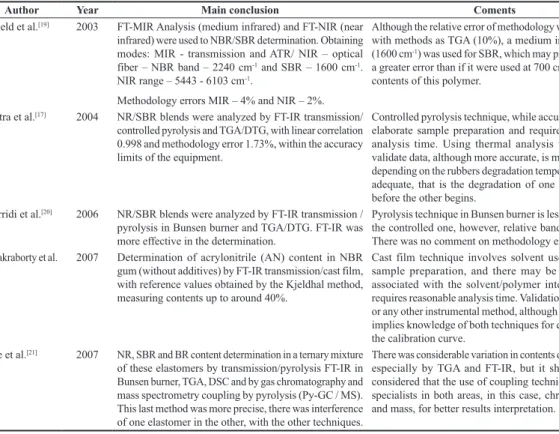
Table 1. Main aspects cited by studies on polymers and their blends characterization.
Author Year Main conclusion Coments
Shield et al.[19] 2003 FT-MIR Analysis (medium infrared) and FT-NIR (near
infrared) were used to NBR/SBR determination. Obtaining modes: MIR - transmission and ATR/ NIR – optical fiber – NBR band – 2240 cm-1 and SBR – 1600 cm-1.
NIR range – 5443 - 6103 cm-1.
Methodology errors MIR – 4% and NIR – 2%.
Although the relative error of methodology was compared with methods as TGA (10%), a medium intensity band (1600 cm-1) was used for SBR, which may probably cause
a greater error than if it were used at 700 cm-1, for lower
contents of this polymer.
Dutra et al.[17] 2004 NR/SBR blends were analyzed by FT-IR transmission/
controlled pyrolysis and TGA/DTG, with linear correlation 0.998 and methodology error 1.73%, within the accuracy limits of the equipment.
Controlled pyrolysis technique, while accurate, involves elaborate sample preparation and requires reasonable analysis time. Using thermal analysis technique to validate data, although more accurate, is more complex, depending on the rubbers degradation temperatures being adequate, that is the degradation of one rubber finish before the other begins.
Berridi et al.[20] 2006 NR/SBR blends were analyzed by FT-IR transmission /
pyrolysis in Bunsen burner and TGA/DTG. FT-IR was more effective in the determination.
Pyrolysis technique in Bunsen burner is less precise than the controlled one, however, relative bands were used. There was no comment on methodology errors. Chakraborty et al.
[11]
2007 Determination of acrylonitrile (AN) content in NBR gum (without additives) by FT-IR transmission/cast film, with reference values obtained by the Kjeldhal method, measuring contents up to around 40%.
Cast film technique involves solvent use, elaborated sample preparation, and there may be interference associated with the solvent/polymer interaction, and requires reasonable analysis time. Validation by Kjeldhal or any other instrumental method, although more precise, implies knowledge of both techniques for elaboration of the calibration curve.
Lee et al.[21] 2007 NR, SBR and BR content determination in a ternary mixture
of these elastomers by transmission/pyrolysis FT-IR in Bunsen burner, TGA, DSC and by gas chromatography and mass spectrometry coupling by pyrolysis (Py-GC / MS). This last method was more precise, there was interference of one elastomer in the other, with the other techniques.
techniques. However, it validates the FT-IR data and makes the methodology more complex and time-consuming.
Methodological errors are not generally compared. In this paper, it was proposed a FT-IR methodology in the MIR
region, with data validation in the NIR region, by means of
less conventional spectral modes, such as UATR and NIRA,
compared to data obtained by transmission. The samples were prepared by pyrolysis in a Bunsen burner, with evaluation of FT-IR methodology error.
2. Materials and Methods
2.1 Samples
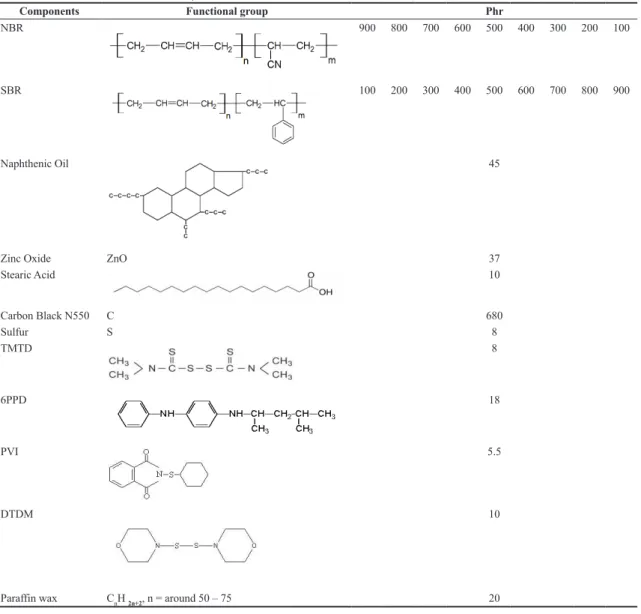
Nine samples of NBR/SBR blends were prepared at
Tenneco Automotive Brazil, with materials kindly provided
by the company, in the proportions 10/90, 20/80, 30/70, 40/60, 50/50, 60/40, 70/30, 80/20, 90/10, according to the formulation found in Table 2.
2.1.1 Preparation of rubber samples
The raw material was weighed on a precision scale and all components, except sulfur and accelerators,
tetramethylthiuram disulfide (TMTD),
(1,3-Dimethylbutyl)-N’-phenyl-phenylenediamine (6PPD), N-(cyclohexylthio)
phthalimide (PVI) and 4,4 Dithiomorpholine (DTDM),
which were mixed in banbury of 2 liters per 240 seconds, with a pound pressure of 4 kgf/cm2, rotation of 70 rpm
and initial temperature of 40°C, for production of master batch. It was processed into a roller form six times in a lab open mill with a rotation of 40 rpm. Later, the master batch was accelerated at banbury, with the rest of the weighted
components (TMTD, 6PPD, PVI, DTDM and sulfur)
for 120 seconds, with 4kgf/cm2 pound pressure, 70 rpm
rotation and initial temperature of 40° C. Then the rubber
was homogenized in roller form six times in an open mil
lab with a rotation of 40 rpm and withdrawn into blanked.
For the preparation of vulcanized rubber sheet, a hydraulic press with vulcanization time of 6 min, plateaus temperature
of 160°C and 150 kgf/cm2 of closing pressure was used.
2.2 Equipment of characterization/conditions
2.2.1 FT-IR analysis
The samples were analyzed in Spectrum One PERKINELMER FT-IR spectrometer (MIR regions
of 4000 to 400 cm-1 and NIR of 12000 to 4000 cm-1,
4 cm-1 resolutions, gain 1, 20 scans), being spectra obtained by transmission techniques (MIR and NIR) and reflection (MIR), using the UATR accessory, and in NIR region, also using the Frontier PERKINELMER FT-IR spectrometer, NIRA accessory, being all samples of different methodologies,
prepared by pyrolysis in Bunsen burner.
In Bunsen’s pyrolysis, samples of each rubber blend were cut, extracted for 8 hours in a Soxhlet extractor, using methanol as solvent[25]. After solvent evaporation in the
oven, it was put a quantity of about 0.5 g of sample in each pyrolysis tube. The tubes were flamed in Bunsen burner, at the same flame height (marked with the aid of an universal device and a claw to determine the same pyrolysis position). For the transmission analysis, by pyrolysis, was used the 0.025mm spacer.
By reflection, using the UATR accessory, in the same
way that was done in a recent study by Rigoli et al.[26], the pyrolysis samples were analyzed by placing them in contact with the diamond-coated zinc selenide crystal surface with
120N (Newton) torque application.
For MIR analysis, the nine NBR/SBR samples (composition
already shown in Table 2), prepared by pyrolysis in
Bunsen burner and analyzed by transmission and reflection
(UATR), were used to prepare ANBR/ASBR x [NBR]/[SBR]
analytical curve, aiming the NBR and SBR contents
determination, through the relative band A2237/A700.
This band is composed by analytical absorptions of
stretching (υ) C ≡N of NBR (2237 cm-1) and bending
(δ) C-H of SBR (700 cm-1). The baselines used were:
2275-2150 cm-1 (band 2237 cm-1) and 2150-590 cm-1
(band 700 cm-1), for transmission / pyrolysis methodology,
and 2275-2180 cm-1 (band 2237 cm -1), 858-642 cm-1
(band 700 cm-1) for UATR methodology.
Author Year Main conclusion Coments
Sanches et al.[9] 2008 Determination of acrylonitrile (AN) content in NBR
non-vulcanized/vulcanized by FT-IR transmission / pyrolysis in Bunsen burner and controlled, with solvent extraction and by UATR, as received, measuring contents up to around 50%. Techniques presented similar precision, but UATR was more adequate to the determination, due to the shorter analysis time and the smaller amount of sample used.
UATR method was used to determine the AN content in the rubber used in this study.
Harada[22] 2016 It focuses on rubber analysis techniques, such as infrared,
TGA, Py-GC/MS, but in the FT-IR analysis the focus is on qualitative reflection analysis for component verification.
The quantitative part is also centered on the Py-GC/MS analysis. FT-IR is cited qualitatively.
Ujianto et al.[23] 2017 It focuses on FT-IR of NR Qualitative analysis, aiming at the evaluation of spectrometric
changes, resulting from devulcanization. Datta et al.[24] 2017 Determination of NR, SBR and BR contents in ternary
mixture by FT-IR and TGA. Bands 1375 (NR), 699 (SBR) and 738 (BR) cm-1 and relative bands were used in the
FT-IR methodology.
The vinylidene band at 885 cm-1, which would be more
characteristic of NR, could have been tested.
For the NIR methodology, the same number of reference NBR / SBR samples, prepared by pyrolysis in Bunsen
burner and analyzed by transmission, were used to prepare the analytical curve A4336/A4060 x [NBR]/[SBR]. The bands
chosen are in the region of combination or overtones of fundamental bands. In the case of NBR/SBR blend, the band
A4336 is probably attributed to the first overtone of stretching
(υ) of C≡N group of NBR or of combination bands, and the A4060 to the second overtone of bending (δ) of SBR aromatic
CH groups[19,27]. The baseline used was 4540-4000 cm-1
(bands 4336 and 4060 cm-1). For NIRA methodology, the
same number of samples and the same analytical bands were used. The samples were also prepared by pyrolysis
in Bunsen burner, and were analyzed by transflectance
because they were in the liquid state[28]. The baseline used
was 4780 to 4000 cm-1.
The data of all FT-IR/MIR and NIR methodologies, for
each sample, represent the median of 5 values of analytical bands intensity chosen, being that the mean standard deviations (Equations 1 and 2) and the relative error (RD)
(Equation 3) were calculated by non-parametric treatment in agreement with Hórak[29] and with the methodology adopted
successfully in group quantitative studies for rubber and other materials[17,28,30].
ˆ
ˆ ˆ
n µ σ
σ = (1)
ˆ KR R
σ = × (2)
Where,
σ
ˆ
is the mean standard deviation, n, the measurements number, R is the difference between the highest and the lowest values of absorbance. KR is the coefficient to calculate the standard deviation (σ
ˆ
) of a range of values, with KR = 0.430 for 5 experiments[29]. The RD of the measurements for each analyzed sample, given in %, was determined by Equation 3, where μ is the median value of A. The median of the relativeerrors represents the error of the methodology[17,28,30].
( )% ˆ 1 0 ˆ
0
RD =σµ×
µ (3)
Table 2. NBR/SBR Blend Formulation System.
Components Functional group Phr
NBR 900 800 700 600 500 400 300 200 100
SBR 100 200 300 400 500 600 700 800 900
Naphthenic Oil 45
Zinc Oxide ZnO 37
Stearic Acid 10
Carbon Black N550 C 680
Sulfur S 8
TMTD 8
6PPD 18
PVI 5.5
DTDM 10
3. Results and Discussion
3.1 FT-IR analysis
In this topic the following were addressed: a) the
determination by UATR of AN content of NBR used in the
blends, according to methodology previously developed by the group[9], since only one range was furnished by the
supplier. For SBR rubber, the determined value as reported by the supplier was used. These values were not used in the blends contents calculation, only used for the proper
characterization of the raw materials used for the prediction
of properties of blends, for future and specific applications. b) the determination of the NBR/SBR blends in two spectral regions, by different ways of obtaining spectra, aiming to evaluate the most suitable conditions for this type of analysis. 3.2 Determination by UATR of AN content of NBR used in the blend
In Table 3, the data for AN content in NBR calculation are inserted.
3.3 MIR/transmission analysis of NBR/SBR
In Figure 1, are the MIR/transmission spectra of some NBR/SBR blends studied. It can be observed that the bands
intensities A2237 and A700 increase and decrease according to
the content of NBR and SBR, respectively, as expected by
Lambert-Beer Law, for quantitative analyzes[32]. The data
for elaboration of calibration curve are shown in Table 4 and Figure 2. To overcome liquid film thickness issues and to improve the data accuracy[32], mean values of relative band A2237/A700 were considered as a function of the relative
NBR/SBR concentration.
From the calibration curve (Table 4), the following
correlation (Equation 4 - R = 0.98, with 96% of the values
explained by the methodology, R2 = 0.96) is proposed:
[
] [
]
2237/ 700 0.17 / 0.14
A A = NBR SBR + (4)
To find the two elastomers contents of the unknown mixture, Equation 5 should also be used. This is valid for all the methodologies developed in this study.
Table 3. UATR data for determination of AN in NBR.
Sample A2237 A2237 (MEDIAN)
Mean standard
deviation RD(%)
Calculated acrylonitrile
content[9]
(%) (*)
Acrylonitrile content (%) range, reported
by NBR gum supplier (**)
NBR 0.040 0.040 0.001 2.5 30 ±1 37-41
0.039 0.040
0.040 0.040
(*) y = 0.0014 x – 0.002 – calibration curve, where y= median value of A2237 [9];
(**) Only the range of AN content was reported by NBR (gum) supplier, without the determined value, nor what method was used. Therefore, the value considered for the material characterization was obtained, that is, 30 ± 1%, of medium AN content[31] by the FT-IR methodology, previously
developed [9], which is accurate, that is, with the relative error around 2%, under the conditions used (UATR, sample analyzed as received). It is
interesting to note that the content found is also used for applications aerospace[9], around 33%.
Figure 1. MIR/transmission spectra (Bunsen burner pyrolysis) of NBR/SBR blends, with AN and styrene bands, marked with n and s,
[
NBR]
+[
SBR]
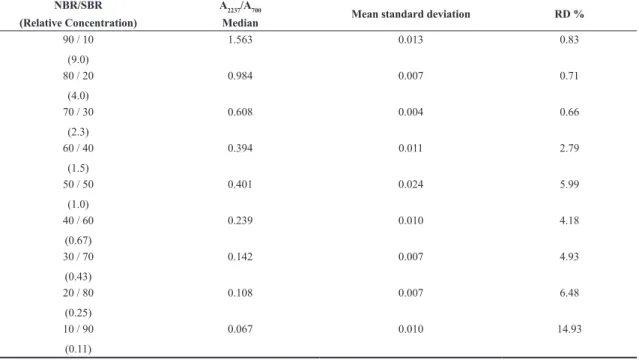
100%= (5)The methodology error, which is relative errors median[28] calculated in Table 4, already mentioned, 4.18%, can be considered good, compared to the reference
value[29], ≤ 2%, which is usually only found under fixed
conditions, ideal for sample preparation, that is, in solution
form and analyzed in closed cell, with thickness control. The error falls to 2.79%, closer to the accuracy limit of the equipment, ≤ 2%, for optimal condition, if the contents of 10-20% of NBR are not considered, may suggest a limit
of detection in this range, by this methodology, probably
due to the low intensity of the AN band, for these levels.
3.4 MIR/UATR analysis of NBR/SBR
In Figure 3, the MIR/UATR spectra of some studied
NBR/SBR polymer blends are included. As for transmission MIR spectra, it can be observed that the intensities of
bands A2237 and A700 increase and decrease according to
the NBR and SBR content, respectively, as expected by the Lambert-Beer Law. The data for calibration curve elaboration are shown in Table 5 and Figure 4. In this methodology,
A2237/A700 relative band was also used to improve the
accuracy of the data.
From the calibration curve (Table 5), the following
correlation (Equation 6 - R = 0.98, with 96% of the values
explained by the methodology, R2 = 0.96) is proposed:
[
] [
]
2237/ 700 0.05 / 0.03
A A = NBR SBR + (6)
The methodology error, which is the median of the relative errors (Table 5), 3.41%, can be considered good
compared to the reference value, ≤ 2%. The error falls to 2.09%, closer to the accuracy limit of the equipment, ≤ 2%, for optimal condition, if the contents of 10-20% of NBR are
not considered, and may also suggest a limit of detection in this band, by this methodology, probably due to the low
intensity of the AN band, for these levels.
3.5 NIR/transmission analysis of NBR/SBR
In Figure 5, the NIR/transmission (pyrolysis in Bunsen burner) spectra of some NBR / SBR polymer blends studied
are shown. As for MIR and UATR spectra, it can be observed that the intensities of the bands A4336 and A4060 increase and
decrease according to the NBR and SBR content, respectively, as expected by the Lambert-Beer Law.
In this methodology, the relative band A4336/A4060 was
chosen to overcome liquid film thickness issues and to improve the data accuracy. Table 6 shows the values used, as well as their mean and relative deviations.
Table 4. MIR/transmission data (Bunsen burner pyrolysis) for calibration curve elaboration and associated methodology errors.
NBR/SBR
(Relative Concentration)
A2237/A700
Median Mean standard deviation RD %
90 / 10
(9.0)
1.563 0.013 0.83
80 / 20
(4.0)
0.984 0.007 0.71
70 / 30
(2.3)
0.608 0.004 0.66
60 / 40
(1.5)
0.394 0.011 2.79
50 / 50
(1.0)
0.401 0.024 5.99
40 / 60
(0.67)
0.239 0.010 4.18
30 / 70
(0.43)
0.142 0.007 4.93
20 / 80
(0.25)
0.108 0.007 6.48
10 / 90
(0.11)
0.067 0.010 14.93
Figure 2. MIR/transmission calibration curve A2237/A700 versus
Figure 6 shows the calibration curve of NIR / transmission
(Bunsen burner pyrolysis) A4336/A4060versus [NBR]/[SBR] (% w/w). From the calibration curve (Table 6), the following
correlation (Equation 7 - R = 0.92, with 85% of the values found,
being explained by the developed methodology) is proposed:
[
] [
]
4336/ 4060 0.26 / 2.58
A A = NBR SBR + (7)
The methodology error was 1.33% (Table 6). Although the error is within the limits of the equipment accuracy,
≤ 2%, there being no evidence of NBR low levels detection
limit, the linearity is not as good as that found for the MIR, transmission and UATR methodologies.
3.6 NIRA analysis of NBR/SBR
To improve the results of NIR methodology, using the
reflection method, the samples were analyzed by transflectance in this region (NIRA). The analytical bands chosen were the
same. Figures 7-8, Table 7 and Equation 8 shows the results
obtained. The methodology error was 0.74% (Table 7), with
good linearity R = 0.96, and 92% of the data found were
explained by this methodology. The error is within the limits
of equipment accuracy, ≤ 2%, and there is no evidence of
limit of detection of low levels of NBR.
[
] [
]
4336/ 4060 0.30 / 2.46
A A = NBR SBR + (8)
To know the contents of unknown samples it is enough
to analyze 5 aliquots of the rubber and to use the suitable
calibration curves established in the developed methodologies, depending on the region of the infrared available in the laboratory. For example, Table 8 shows the evaluation of
the MIR methodologies developed by means of analysis of
unknown concentration NBR / SBR sample.
Although the test sample has been analyzed by the
analyst, without the knowledge of its concentration, the
Figure 3. MIR/UATR spectra of NBR/SBR blends, with the AN and styrene bands, labeled with n and s, respectively. Table 5. MIR/UATR data (Bunsen burner pyrolysis) for calibration curve elaboration and associated methodology errors.
NBR/SBR - (Relative
Concentration) A2237/A700 (Median) Mean standard deviation RD (%)
90/10 (9.0) 0.431 0.009 2.09
80/20 (4.0) 0.263 0.005 1.90
70/30 (2.3) 0.187 0.003 1.60
60/40 (1.5) 0.111 0.002 1.80
50/50 (1.0) 0.088 0.003 3.41
40/60 (0.67) 0.047 0.003 6.38
30/70 (0.43) 0.030 0.002 6.67
20/80 (0.25) 0.014 0.001 7.14
10/90 (0.11) 0.010 0.003 30.00
Figure 4. MIR/UATR calibration curve A2237/A700 versus relative
Figure 5. NIR transmission spectra (Bunsen burner pyrolysis) of NBR/SBR blends, with AN and styrene bands, labeled with n and s,
respectively.
Table 6. NIR transmission data (Bunsen burner pyrolysis) for calibration curve elaboration and associated methodology errors. NBR/SBR
(Relative Concentration)
A4336/A4060
(Median) Mean standard deviation RD (%)
90/10 (9.0) 4.625 0.058 1.25
80/20 (4.0) 4.000 0.160 4.00
70/30 (2.3) 3.733 0.043 1,15
60/40 (1.5) 3.231 0.045 1.39
50/50 (1.0) 2.893 0.025 0.86
40/60 (0.67) 2.714 0.036 1.33
30/70 (0.43) 2.484 0.059 2.38
20/80 (0.25) 2.400 0.025 1.04
10/90 (0.11) 2.200 0.030 1.36
Table 7. NIRA data (pyrolysis in Bunsen burner) for calibration curve elaboration and associated methodology errors.
NBR/SBR
(Relative Concentration) A4336/A4060 (Median) Mean standard deviation RD (%)
90/10 (9.0) 4.865 0.067 1.38
80/20 (4.0) 3.973 0.039 0.98
70/30 (2.3) 3.42 0.126 3.68
60/40 (1.5) 3.171 0.127 4.01
50/50 (1.0) 2.877 0.021 0.73
40/60 (0.67) 2.632 0.007 0.27
30/70 (0.43) 2.459 0.016 0.65
20/80 (0.25) 2.305 0.012 0.52
10/90 (0.11) 2.161 0.016 0.74
Table 8. Data of unknown NBR/SBR sample (X/Y) for validation of MIR methodologies developed.
NBR/SBR(nominal relative concentration)/
methodology A2237/A700
A2237/A700
(median)
Calculated
concentration RD (%)
Unknown sample (X/Y)/MIR/transmission 0.569
0.592
0.632
0.644
0.653
0.632 NBR = 74.29
SBR = 25.71
2.53
Unknown sample (X/Y)/ MIR/UATR 0.155
0.155
0.146
0.192
0.165
0.155 NBR = 71.43
SBR = 28.57
nominal value that should have been found would be around NBR70 / SBR30. Thus, both methodologies presented
satisfactory values, with the best result for which UATR
was used.
4. Conclusion
Summarily, all MIR and NIR methodologies were useful for NBR and SBR contents determination in the analyzed blends. The best correlation in the MIR region was found for the UATR methodology (pyrolysis in Bunsen burner), although there may be a detection limit between 10-20% NBR and an error around 3%. In the NIR region, the NIRA
methodology showed better correlation, with no limit of
detection and with error around 1%, within the limits of the FT-IR spectrometer. Both methodologies MIR/NIR are
fast, therefore useful as quality control in different industrial and research scenarios.
5. Acknowledgements
This study was supported in part by the National Senior Visiting Professor Program (PVNS) from the Coordenação
de Aperfeiçoamento Pessoal de Nível Superior (CAPES).
6. References
1. Hemais, C. A., Rosa, E. O. R., & Barros, H. M. (2000). Observações sobre desenvolvimentos Tecnológicos e os ciclos da Industria de Polímeros do Brasil.Polímeros: Ciência e Tecnologia, 10(3), 149-154. http://dx.doi.org/10.1590/S0104-14282000000300011.
2. Simielli, E. R. (1993). Principais características das blendas poliméricas fabricadas no Brasil. Polímeros: Ciência e Tecnologia, 3(1), 45-49. Retrieved in 2018, January 12, from http://www.revistapolimeros.org.br/pdf/v3n1/v3n1a06.pdf 3. Ramesan, M. T., Kuriakose, B., Pradeep, P., Alex, R.,
& Varghese, S. (2001). Compatibilization of SBR/NBR blends using chemically modified styrene butadiene rubber.
International Polymer Processing, 16(2), 183-191. http://
dx.doi.org/10.3139/217.1640.
4. Alcantara, A. F., Nunes, R. C. R., & Visconte, L. L. Y. (2004). Mistura BR/SBR: propriedades mecânicas em função de modo de preparo. Polímeros: Ciência e Tecnologia, 14(4), 279-282. http://dx.doi.org/10.1590/S0104-14282004000400015. 5. Rocha, T. C. J., Soares, B. G., & Coutinho, F. M. B. (2007).
Principais copolímeros elastoméricos à base de butadieno utilizados na indústria automobilística.Polímeros: Ciência e Tecnologia, 17(4), 299-307. http://dx.doi.org/10.1590/S0104-14282007000400009.
6. Ramesan, M. T., & Alex, R. (2001). Compatibilization of SBR/ NBR blends using chemically modified styrene-co-butadiene rubber - Part 2. Effect of compatibilizer loading.Polymer International, 50(12), 1298-1308. http://dx.doi.org/10.1002/ pi.775.
7. Pedreira, S. M., Pinto, J. R. A., Campos, E. A., Mattos, E. D. C., Oliveira, M. S., Jr., Oliveira, J. I. S., & Dutra, R. D. C. L. (2016). Methodologies for characterization of aerospace polymers/energetic materials – a short review.Journal of
Aerospace Technology and Management, 8(1), 18-25. http://
dx.doi.org/10.5028/jatm.v8i1.576.
8. Wikipedia. (2018). Nitrile rubber. Retrieved in 2018, January 12, from https://en.wikipedia.org/wiki/Nitrile_rubber 9. Sanches, N. B., Diniz, M. F., Alves, L. C., Dutra, J. C. N.,
Cassu, S. N., Azevedo, M. F. P., Mattos, E. C., & Dutra, R. C. L. (2008). Avaliação da aplicabilidade de técnicas FT-IR de reflexão (UATR) e de transmissão para a determinação do teor de acrilonitrila (AN) em NBR.Polímeros: Ciência e Tecnologia, 18(3), 249-255. http://dx.doi.org/10.1590/S0104-14282008000300011.
10. Chakraborty, S., Bandyopadhyay, S., Ameta, R., Mukhopadhyay, R., & Deuri, A. S. (2007). Application of FTIR in characterization of acrylonitrile-butadiene rubber (nitrile rubber). Polymer Testing, 26(1), 38-41. http://dx.doi. org/10.1016/j.polymertesting.2006.08.004.
11. Ghebremeskel, G. N., Sekinger, J. K., Hoffpauir, J. L., & Hendrix, C. (1996). A study on the thermal degradation products of styrene-butadiene type rubber by pyrolysis/GC/
Figure 6. NIR calibration curve A4436/A4060versus relative
concentration [NBR/SBR].
Figure 7. NIRA Spectra (pyrolysis in Bunsen burner) of NBR/
SBR blends.
Figure 8. NIRA calibration curve A4436/A4060 versus relative
MS.Rubber Chemistry and Technology, 69(5), 874-884. http:// dx.doi.org/10.5254/1.3538409.
12. Yehia, A. A., Mansour, A. A., & Stoll, B. (1997). Detection of compatibility of some rubber blends by DSC. Journal of Thermal Analysis, 48(6), 1299-1310. http://dx.doi.org/10.1007/ BF01983440.
13. Ferreira, A. C., Diniz, M. F., & Mattos, E. C. (2018). FT-IR methodology transmission and UATR for quantifying automotive systems. Polímeros: Ciência e Tecnologia, 28(1), 6-14. http:// dx.doi.org/10.1590/0104-1428.2412.
14. Choi, S.-S., Kim, Y., & Kwon, H.-M. (2014). Microstructural analysis and cis–transisomerization of BR and SBR vulcanizates reinforced with silica and carbon black using NMR and IR.
RSC Advances, 4(59), 31113-31119. http://dx.doi.org/10.1039/ C4RA03682D.
15. Perez, L. D., & Lopez, B. L. (2012). Thermal characterization of SBR/NBR blends reinforced with a mesoporous silica.
Journal of Applied Polymer Science, 125(S1), E327-E333.
http://dx.doi.org/10.1002/app.35689.
16. Noriman, N. Z., Ismail, H., & Rashid, A. A. (2010). Characterization of styrene butadiene rubber/recycled acrylonitrile-butadiene rubber (SBR/NBRr) blends: The effects of epoxidized natural rubber (ENR-50) as a compatibilizer.Polymer Testing, 29(2), 200-208. http://dx.doi.org/10.1016/j.polymertesting.2009.11.002. 17. Dutra, R. C. L., Diniz, M. F., Ribeiro, A. P., Lourenço, V. L., Cassu, S. N., & Azevedo, M. P. (2004). Determinação do teor de NR/SBR em misturas: associação de dados DTG e FT-IR e/ ou ensaios auxiliares. Polímeros: Ciência e Tecnologia, 14(5), 334-338. http://dx.doi.org/10.1590/S0104-14282004000500011. 18. Shield, S. R., Ghebremeskel, G. N., & Hendrix, C. (2001). Pyrolysis-GC/MS and TGA as tools for characterizing blends of SBR and NBR. Rubber Chemistry and Technology, 74(5), 803-813. http://dx.doi.org/10.5254/1.3547654.
19. Shield, S. R., & Ghebremeskel, G. M. (2003). Use of mid and near infrared techniques as tools for characterizing blends of copolymers of styrene–butadiene and acrylonitrile-butadiene.
Journal of Applied Polymer Science, 88(7), 1653-1658. http:// dx.doi.org/10.1002/app.11849.
20. Fernández-Berridi, M. J., González, N., Mugica, A., & Bernicot, C. (2006). Pyrolysis-FTIR and TGA techniques as tools in the characterization of blends of natural rubber and SBR. Thermochimica Acta, 444(1), 65-70. http://dx.doi. org/10.1016/j.tca.2006.02.027.
21. Lee, S. Y., Lee, W., Cho, S., Kim, I., & Ha, C. (2007). Quantitative analysis of unknown compositions in ternary polymer blends: a model study on NR/SBR/BR system. Journal of Analytical
and Applied Pyrolysis, 78(1), 85-94. http://dx.doi.org/10.1016/j. jaap.2006.05.001.
22. Harada, M. (2015). Analytical methods for vulcanized rubbers.
Nippon Gomu Kyokaishi, 88(6), 192-197. http://dx.doi.
org/10.2324/gomu.88.192.
23. Ujianto, O., Putri, D. B., Jayatin, & AWinarto, D. (2017). A comparative study of ground tire rubber devulcanization using twin screw extruder and internal mixer. IOP Conference Series. Materials Science and Engineering, 223, 012005. http://dx.doi. org/10.1088/1757-899X/223/1/012005.
24. Datta, S., Antos, J., & Stocek, R. (2017). Characterisation of ground tyre rubber by using combination of FT-IR numerical parameter and DTG analysis to determine the composition of ternary rubber blend. Polymer Testing, 59, 308-315. http:// dx.doi.org/10.1016/j.polymertesting.2017.02.019.
25. Wake, W. C., Tidd, B. K., & Loadman, M. J. R. (1983). Analysis
of rubber and rubber-like polymer. 3rd ed. New York: Applied
Science.
26. Rigoli, P. S., Murakami, L. M. S., Diniz, M. F., Azevedo, M. F. P., Cassu, S. N., Mattos, E. C., & Dutra, R. C. L. (In press). Quantification of aerospace polymer blends by thermogravimetric analysis and infrared spectrometry. Journal of Aerospace
Technology and Management.
27. Goddu, R. F. (1960). Near-infrared spectrophotometry. In C. N. Reilly (Ed.), Advances in analytical chemistry and
instrumentation (pp. 347-425). New York: Interscience.
28. Mello, T. S. D., Diniz, M. F., & Dutra, R. C. L. (2018). UATR and NIRA evaluation in the quantification of ATBC in NC blends. Polímeros: Ciência e Tecnologia, 28(3), 239-245. http://dx.doi.org/10.1590/0104-1428.16816.
29. Horák, V. M., & Vítek, A. (1978). Interpretation and processing of vibrational spectra. New York: John Wiley & Sons. 30. Damazio, D., Santos, R. P., Diniz, M. F., & Dutra, R. C. L.
(2015). Determinação do teor de ENB em EPDM (elastômero puro) por FT-IR de transmissão, por meio de banda relativa.
Polímeros: Ciência e Tecnologia, 25(2), 181-185. http://dx.doi. org/10.1590/0104-1428.1777.
31. Grison, E. C., Becker, E., & Sartori, E. (2010). Borrachas
e seus aditivos, componentes, influências e segredos. Porto
Alegre: Letra e Vida.
32. Smith, A. L. (1979). Applied infrared spectroscopy. New York: John Wiley & Sons.

![Figure 6 shows the calibration curve of NIR / transmission (Bunsen burner pyrolysis) A 4336 /A 4060 versus [NBR]/[SBR]](https://thumb-eu.123doks.com/thumbv2/123dok_br/16487408.732887/7.765.72.715.105.279/figure-shows-calibration-transmission-bunsen-burner-pyrolysis-versus.webp)

![Figure 6. NIR calibration curve A 4436 /A 4060 versus relative concentration [NBR/SBR].](https://thumb-eu.123doks.com/thumbv2/123dok_br/16487408.732887/9.765.78.376.86.280/figure-nir-calibration-curve-versus-relative-concentration-nbr.webp)
