UNIVERSIDADE DO ALGARVE
Development of Biosensors
for Molecular Analysis
João Miguel Encarnação
Doutoramento em Ciências Biotecnológicas
( Especialidade de Biotecnologia Molecular)
Centro de Biomedicina Molecular e Estrutural
Instituto de Biotecnologia e Bioengenharia
U
NIVERSIDADE DO
A
LGARVE
Development of Biosensors
for Molecular Analysis
João Miguel Encarnação
Doutoramento em Ciências Biotecnológicas
( Especialidade de Biotecnologia Molecular)
Tese orientada por:
Orientador- Doutor Guilherme Ferreira
Co-Orientador- Doutor Peter Stallinga
Abstract
This thesis deals with the application of piezoelectric sensors, namely quartz crystal microbalances (QCM), for the study of molecular interactions and for biomedical purposes.
Piezoelectric transduction allows the detection of biorecognition events and its operation depends on the mechanical vibration of the crystal whose resonance frequency is sensible to surface mass changes. But in liquid medium these sensors also respond to the properties of solutions and adsorbed films. Thus, a major aspect explored in this thesis is the expansion of the physical understanding of the behavior of these sensors in liquid medium and also how organic or biological layers can affect the results and their interpretation. This was achieved using impedance analysis where the behavior of the piezoelectric sensor is interpreted with the help of equivalent electric RLC circuits. The potential electroacoustic interference of charged species in solution was particularly studied and a new equivalent circuit is proposed in order to detect and quantify these effects with the assistance of impedance analysis.
The efficiency of the key steps taken for the development of our QCM system, was experimentally demonstrated with the qualitative and quantitative analysis of the process of
11-hydroxy-1-undecanothiol SAMs (self-assembled monolayers) formation and the recognition of streptavidin in aqueous medium using biotin modified sensors.
Finally the work was focused on the development of a new detection tool for the HIV1 virus using piezoelectric immunosensors based on recombinant antibodies to detect the Vif molecule (virion infectivity factor). The developed immunosensors selectively detected Vif in aqueous solutions and presented specificity and good sensibility when detecting the target protein in complex samples like mixtures of proteins and cell extracts.
Key words: Biosensor, piezoelectric, QCM, impedance analysis, equivalent circuit, kinetics, SAM, Streptavidin, HIV1-Vif, recombinant antibodies, nanoparticles, DNA.
Resumo
A integração da electrónica e da biologia para a produção de bio-sensores tem-se tornado uma área de enorme potencial. Os sensores biomoleculares têm-se revelado uma ferramenta fundamental para a compreensão dos princípios biofísicos de reconhecimento molecular assim como na detecção da presença de analitos específicos. Os bio-sensores são instrumentos analíticos nos quais biomoléculas (ex. anticorpos, DNA, receptores, enzimas) são associadas a transdutores de sinal físicos ou químicos com o objectivo de reconhecer específica e selectivamente moléculas alvo.
Nesta tese é abordada a aplicação de sensores piezoeléctricos, nomeadamente microbalanças de cristal de quartzo (QCM) com eléctrodos de ouro, para o estudo de interacções moleculares e para o desenvolvimento de sistemas bio-sensores para aplicação biomédica.
A operação de um QCM assenta no efeito piezoeléctrico, no qual um sensor de cristal de quartzo é induzido a vibrar mecânicamente com uma frequência de ressonância específica através da aplicação de um campo eléctrico alternado aos eléctrodos metálicos. A frequência de ressonância do cristal é proporcional à massa deslocada na vibração, e consequentemente à variação de massa na superfície do sensor. Esta pode ser estimada através da equação de
Sauerbrey, ∆fm=[-2nf02/(ρqμq)½]×[∆m/A], que relaciona a variação de frequência (∆fm), a
frequência de ressonância no modo fundamental (f0), a harmónica (n), a densidade e o módulo
de rigidez ou torção do quartzo (ρq e μq), a variação de massa (∆m) e a área activa do sensor
(A). Desta forma, um QCM gera um sinal que permite caracterizar um evento de reconhecimento molecular na sua superfície. Este modelo assume que a massa depositada na superfície do cristal acompanha a sua vibração e por conseguinte o sensor comporta-se como se fosse simplesmente mais espesso. Assim, a equação de Sauerbrey é apenas válida para filmes finos, rígidos e uniformes. No entanto a resposta do quartzo em meio líquido depende, não só da variação da massa depositada, como também das propriedades reológicas dos tampões, das propriedades viscoelásticas dos biofilmes depositados, da presença de electrólitos e da variação de cargas na superfície do sensor. Estes factores resultam em variações de frequência interferentes que são aditivas e impossíveis de eliminar recorrendo unicamente a sistemas de medição de frequência de ressonância. A quantificação e eliminação das variações destas frequências de ressonância interferentes pode ser conseguida recorrendo a metodologias de análise mais complexas, através da espectroscopia de impedância.
Em espectroscopia de impedância é possível analisar processos interfaciais que ocorrem no sensor de quatzo, interpretando-os sob a forma de um circuito eléctrico equivalente RLC, denominado modelo de Butterworth–Van Dyke. Esta análise permite distinguir e individualizar o contributo de propriedades reológicas de soluções e propriedades de filmes depositados. Na essência e no que diz respeito a filmes, há dois componentes que são estimados em análise de impedância: massa depositada, representada em circuito equivalente, como um indutor (L) e viscoelasticidade da mesma, representada como uma resistência (R).
Assim, um aspecto importante explorado nesta tese é a expansão da compreensão do comportamento físico destes sensores em meio líquido e também como as propriedades de camadas orgânicas ou biológicas podem afectar resultados e sua interpretação.
Neste trabalho são demonstrados os passos críticos necessários ao desenvolvimento instrumental e uso de sensores QCM para análise molecular em meio líquido e a optimização do seu desempenho na monitorização de eventos de reconhecimento molecular em tempo real. Utilizando um circuito oscilador com contador de frequências e um analisador de impedâncias, foram medidas a propriedades dos sensores de cristal de quartzo e sua resposta sistemática ao ar e em líquidos, tanto para a sua frequência de ressonância fundamental como para as suas harmónicas.
A validade e funcionalidade do sistema QCM desenvolvido nesta tese, foram verificados através do modelo de Kanazawa que determina a relação entre frequência de ressonância e a densidade e viscosidade de soluções. Para a validade de medições de impedância em meio líquido, utilizou-se o modelo de Martin que relaciona a variação de frequência de ressonância com variação de resistência em análise de circuito equivalente RLC. Para ambos os modelos o sistema respondeu de acordo com o teóricamente previsto.
No desenvolvimento instrumental do sistema de 5 MHz são focadas questões como a regeneração dos cristais para sua reutilização, o controlo de temperatura, efeitos de pressão, evaporação de líquido e presença de gases dissolvidos.
A reutilização de cristais é determinante, pois tendo em conta que no decorrer de um ensaio ocorre a deposição de massa na superfície, esta terá de ser eficientemente removida de modo a se proceder a novo ensaio utilizando o mesmo sensor QCM. São apresentados dois métodos, em que um consiste na limpeza com um agente químico (solução piranha) e outro de natureza
revelaram-se eficientes, no entanto a limpeza electroquímica apresentou ser segura para a integridade física dos sensores, ao contrário da aplicação de solução piranha que é significativamente agressiva para os eléctrodos de ouro.
Foram avaliados os impactos de efeitos interferentes, especialmente no que diz respeito a introdução de ruído ou desvios no sinal de frequência de ressonância. O controlo de temperatura é absolutamente crucial considerando que os sensores utilizados em meio líquido apresentam um coeficiente de variação de aproximadamente 8 Hz/ºC. Efeitos de pressão, evaporação de líquido e presença de gases dissolvidos demonstraram introduzir desvios e ruído que podem mimetizar ou dissimular os sinais esperados em ensaios de adsorção de massa.
Para a devida aplicação de sensores QCM em meio líquido foi desenvolvido um aparelho construído de forma a prevenir ou minimizar os efeitos interferentes estudados, que consiste basicamente num circuito de fluxo com uma célula de fluxo integrada, onde os cristais são montados. Este sistema é assistido por uma bomba peristáltica e é termostatizado (± 0.1ºC) por um termocriostato com controlador PID. Os ensaios são efectuados em fluxo contínuo, utilizando soluções tampão como veículo para o transporte das amostras, injectadas em fluxo, até à célula onde se encontra o sensor de quartzo. Ao sensor estão conectados simultaneamente três sistemas transdutores para análise de frequência de ressonância, análise de impedância e análise electroquímica.
Neste trabalho é demonstrado que a resposta de sensores QCM é afectada pela presença de espécies carregadas em solução, que podem ter um impacto considerável em aplicações de bio-sensores, conduzindo a conclusões erróneas.
A influência da dupla camada para regimes de baixa variação de força iónica (I ≤1 mM) manifesta-se como uma camada que localmente aumenta a densidade e viscosidade da solução induzindo uma diminuição da frequência de ressonância. Para elevada variação de força iónica (1 mM ≤ I ≤ 50 mM) predominam efeitos de carga de natureza capacitiva que induzem aumentos da frequência de ressonância.
Face a estes fenómenos, é proposto um circuito equivalente modificado onde se introduz um elemento capacitivo (C), baseado no modelo RLC de Butterworth–Van Dyke. Com base neste circuito modificado é efectuada espectroscopia de impedância e respectiva interpretação dos espectros obtidos de forma a detectar, quantificar e eliminar a influência deste efeitos interferentes utilizando a relação linear 8 Hz/pF.
A aplicação desta relação foi demonstrada na detecção de nanopartículas de ouro revestidas com um oligonucleotiodo complementar de uma cadeia simples de DNA previamente imobilizada na superfície dos sensores de quartzo. A adsorção das nanopartículas funcionalizadas na superfície dos sensores QCM processa-se através da hibridação das cadeias complementares de oligonucleótido. Este processo foi acompanhado em tempo real por análise de frequência e impedância. Verificou-se que a mera análise de variação total de frequência de ressonância produziu um sinal que subestima a massa adsorvida, face aos resultados obtidos em análise de impedância para o desvio do espectro em frequência. A adsorção das nanopartículas provocou uma variação do elemento capacitivo em análise de circuito que representava um efeito interferente traduzido pela subestimação em 40% da massa real adsorvida.
A estimativa da influência de electrólitos ou outras espécies carregadas sobre a resposta dos sensores QCM permite a aquisição de dados mais exactos no que diz respeito à exclusiva
influência de massa, o que é fulcral para a utilização do sistema piezoeléctrico para análise molecular quantitativa suportada pelo modelo de Sauebrey.
A aplicação prática do cicuito equivalente modificado, é demonstrada na medição simultânea de variação da frequência de ressonância e a impedância electroacústica dos sensores, permitindo a análise quantitativa em processos de adsorção de massa orgânica. Deste modo, a partir dos dados adquiridos é possível avaliar modelos cinéticos e estimar constantes cinéticas sem o risco de uma sobre ou subestimação dos valores devido a efeitos não-mássicos.
Esta abordagem foi aplicada ao estudo de camadas orgânicas auto-montadas em ouro (SAM- self assembled monolayer) utilizando a molécula 11-hidroxi-1-undecanotiol e também para estudar a interacção de estreptavidina com biotina imobilizada no sensor.
Para ambos os processos moleculares foi possível acompanhar as curvas cinética de adsorção em tempo real através da variação da frequência de ressonância dos sensores de quartzo. Cada curva obtida foi devidamente analisada por espectroscopia de impedância de forma a detectar possíveis efeitos interferentes. A partir dos transientes de frequência para a adsorção de 11-hidroxi-1-undecanotiol em ouro e também para ligação estreptavidina-biotina, foram estimados parâmetros cinéticos e de equílibrio, isotérmicas de adsorção, análise de Scatchard e análise de Hill. A validade destas estimativas e análises depende fortemente do estabelecimento directo de variação de frequência de ressonância exclusivamente com massa, o que foi conseguido através da análise de impedância.
A resultante análise de dados demonstrou que a formação do SAM de 11-hidroxi-1-undecanotiol é caracterizado por uma cooperatividade positiva, enquanto o processo de ligação de estreptavidina a biotina imobilizada na superfície do sensor, rege-se por uma cooperatividade negativa. Foi também possível estimar com sucesso as constantes cinéticas e
Em suma, foi demonstrado que a análise de impedância melhora significativamente a análise quantitativa com sensores piezoeléctricos em meio líquido. A abordagem com o circuito equivalente modificado permite o estudo de interacções moleculares observando as propriedades particulares das moléculas envolvidas assim como os fenómenos superficiais que ditam a resposta dos sensores.
Esta metodologia demonstrou a aplicabilidade de QCM em procedimento analíticos quantitativos, o que conduziu ao estudo e desenvolvimento de uma nova ferramenta biomédica para diagnóstico de HIV1. Para atingir este objectivo construíram-se imuno-sensores piezoeléctricos baseados em anticorpos recombinantes para reconhecer a molécula Vif (virion infectivity factor) do HIV1.
A molécula alvo, Vif, é uma proteína fosforilada de aproximadamente 23 kDa localizada no citoplasma de células infectadas por HIV1 e essencial para a replicação e disseminação do vírus em linfócitos, macrófagos e em linhas de células T.
Anticorpos recombinantes 4BL, VH e VHD gerados contra a proteína Vif-HIV1 foram individualmente imobilizados sobre a superfície de sensores de quartzo, gerando assim três tipos diferentes de imuno-sensor.
Análises de frequência assim como de impedância foram aplicadas no estudo de imobilização de cada anticorpo, permitindo a eliminação de efeitos interferentes e consequentemente a correcta quantificação de anticorpos imobilizados.
O reconhecimento molecular da Vif por cada imuno-sensor, foi analisado quantitativamente com o apoio de análise de impedância para estimar as constantes cinéticas e de equílibrio que regem o reconhecimento antigénio-anticorpo. Na análise molecular quantitativa foram detectados e quantificados sinais interferentes gerados por viscoelasticidade das moléculas e
efeitos de carga, permitindo assim a correcção dos transientes de frequência de ressonância de forma a aplicar o modelo de Sauerbrey. Nesta fase, a molécula VHD destacou-se relativamente a 4BL e VH, apresentando um maior valor para a constante de associação à Vif.
A análise de impedância permitiu também compreender alguns aspectos relativamente à orientação superficial de cada molécula e alterações conformacionais tanto no processo de imobilização, como no processo de reconhecimento anticorpo-antigénio.
Qualitativamente, mostrou-se que os três imuno-sensores reconhecem específicamente a molécula Vif em amostras líquidas complexas, tendo os resultados mostrado uma melhor sensibilidade por parte da molécula VHD. Mostrou-se que o sensor baseado nesta molécula apresenta maior eficiência na detecção selectiva de Vif em misturas proteícas e em extractos celulares de células humanas embrionárias de fígado, manipuladas para expressar a Vif.
Os estudos apresentados constituem um valioso contributo para os mecanismos de reconhecimento molecular de Vif, por parte dos anticorpos 4BL, VH e VHD, com impacto na pesquisa que decorre actualmente focada na aplicação destas moléculas para a neutralização funcional da proteína alvo, constítuindo assim uma estratégia terapêutica para a neutralização do poder infeccioso do vírus HIV1.
É demonstrado nesta tese que os sensores piezoeléctricos apresentam um elevado potencial como núcleos de desenvolvimento de biosensores com múltiplas aplicações. Apesar da sua aparente simplicidade, a correcta utilização destes sensores em meio líquido requere o conhecimento e entendimento do seu funcionamento sob ponto de vista físico, particularmente no que diz respeito ao seu comportamento face ao meio que o rodeia, assim como a interacção com massa adsorvida na sua superfície.
A validade dos dados adquiridos com QCM depende da aquisição de um sinal que esteja exclusivamente relacionado com massa adsorvida na sua superfície. Neste trabalho, são apresentadas soluções que permitem isolar os sinais relacionados com a massa, através da eliminação/prevenção da influência de fontes de interferência e também através da detecção e quantificação da influência de interferentes na transdução piezoeléctrica.
Deste modo, sensores QCM podem potencialmente tornar-se plataformas qualitativas e quantitativas, o que acrescido da sua versatilidade, permite o desenvolvimento de biosensores com elevada aplicabilidade e validade analíticas.
Palavras chave: Bio-sensor, piezoeléctrico, QCM, análise de impedância, circuito equivalente, cinéticas, SAM, estreptavidina, HIV1-Vif, anticorpos recombinantes, nanopartículas, DNA.
Acknowledgments
This dissertation represents the end of a long and hard process, but also the very fruitful and fascinating period of my PhD research.
I am grateful to Prof. Guilherme Ferreira, my supervisor, for believing in me and convincing me to quit my job and embracing a fascinant world of knowledge, science and invaluable experience. Our scientific discussions helped planting the seeds of my research, crystallizing ideas and experimental results to a whole and harmonized picture.
I would also like to express my deep gratitude to Prof. Peter Stallinga, my co-supervisor, to whom I owe much of my knowledge in how to be a passionate and credible scientist. Prof. Stallinga has literally raised me into the scientific world, guiding me slowly towards becoming an independent researcher.
Special thanks to Prof. Henrique Gomes and Prof. Paulo Pinheiro with whom I learned a lot in their laboratories and collaborated in part of my work. Their theoretical insight helped clarify some of the underlying physical mechanisms and establish wider perspectives for interpreting my experimental results.
I am grateful to all those who helped me to accomplish this work, like my colleagues Luís Rosa, Raul Baltazar, Luisa Pedro and Rogério Rodrigues, and also Mário Freitas for technical advises and help in constructing part of the experimental setups used in this work.
I would like to acknowledge the Portuguese Science Foundation, an organism of the Portuguese Ministry of Science and Higher Education, for my PhD grant number SFHR/BD/12772/2003 and the funding to the projects POCTI/CTM/37719/2000 and POCI/BIO/61912/2004.
Devoted to my family, specially my parents Jacinto and Suzel, my brother Carlos, my goddaughter Inês and my grandparents Antero and Marieta. They always knew I had the science bug in me.
“O homem não nasceu para trabalhar, mas para criar”
Contents
Abstract ... i
Resumo ...iii
Acknowledgments...xiii
Acronyms and Symbols ... 1
List of Figures ... 7
List of Tables... 15
Introduction ... 17
1.1. What is a Biosensor? ... 17
1.2. The piezoelectric effect ... 20
1.3. Quartz crystal microbalance- QCM ... 21
1.4. Physical model of a quartz crystal piezoelectric sensor... 25
1.5. QCM as a mass sensing tool ... 28
1.6. Impedance analysis of QCM ... 31
1.7. Deviations in the QCM response... 39
1.8. Thesis objectives and motivations ... 43
2.1. Reagents... 47
2.2. Biologicals ... 48
2.2.1. Oligonucleotides... 48
2.2.2. Recombinant proteins ... 48
2.2.3. Other biologicals... 49
2.3. Functionalization of gold nanoparticles with oligonucleotides ... 50
2.4. Quartz Crystal Sensors ... 50
2.5. QCM surface modification... 51
2.5.1. Sensor activation with alkanethiols... 51
2.5.2. Sensor functionalization with proteins and biotin ... 52
2.5.3. Sensor functionalization with oligonucleotides ... 53
2.6. Experimental set-up ... 54
2.7. Impedance Analysis... 56
2.8. Electrochemical measurements ... 57
Instrumental setup of gold QCM sensors for real time molecular analysis ... 59
3.1. System check- resonant frequency response ... 60
3.2. System check- impedance response ... 62
3.3. Crystal cleaning and regeneration... 68
3.4. Interferents ... 71 3.4.1. Temperature ... 72 3.4.2. Evaporation... 72 3.4.3. Non-degassed fluids ... 75 3.4.4. Mechanical noise... 76 3.5. Conclusions ... 79
Influence of electrolytes in the QCM response: Discrimination and quantification of the interference to correct microgravimetric data ... 81
4.1. Influence of charged species in the response of QCM sensors... 82
4.2. Effect of small increments of electrolytes ... 84
4.3. Piezoelectric resonators sense and respond to modifications of the diffusive electrical double layer... 90
4.4 Use of modified BVD data as corrective tool to evaluate and quantify DNA hybridization ... 92
4.5. Conclusions ... 96
Electroacoustic impedance complemented piezoelectric quantitative analysis of molecular systems: self assembled monolayers and streptavidin-biotin binding... 99
5.1. Formation of a Self Assembled Monolayer (SAM) ... 100
5.2. Piezoelectric detection and analysis of Streptavidin binding to Biotin... 105
Piezoimmunosensors based on recombinant single-chain and single domain antibodies
for detection of HIV1 virion infectivity factor... 115
6.1. HIV1-Vif and anti-Vif recombinant antibodies... 116
6.2. Immobilization of antibodies... 117
6.4. Selective detection of HIV1 Vif ... 121
6.5. Kinetic analysis of antigen recognition ... 124
6.6. Detection of HIV1 Vif in complex mixtures ... 128
6.7. Conclusions ... 130
Concluding remarks... 133
Future work… ... 137
References ... 139
Acronyms and Symbols
Z - Impedance magnitude
φ- Impedance phase angle τ- Relaxation time of binding
ΔfC-Frequency variation to charge interference
ΔfL- Frequency variation due viscoelasticity of the liquid
ΔfM- Frequency variation due to mass loading
ΔfT- Total frequency variation due to mass loading
ΔfV- Frequency variation due viscoelasticity of the adsorbed/deposited mass
Δfvisc- Frequency change due to viscoelastic effects |Y|- Admittance magnitude
∆fFWHM- Frequency Width at Half Maximum
∆m- surface mass change
∆R- Change of resistance
∆XL- Change of inductive reactance
µQ- shear modulus of quartz
4BL- anti-Vif single chain antibody
A- Amplitude of oscillation of shear wave
AC- Alternating current
B- Susceptance
BVD- Butterworth van Dyke model
C- Initial ligand concentration C0- Parallel capacitance
CF- Capacitance due to charge variation upon mass loading
CL- Capacitance due to charge variation upon liquid loading
Cm- Series capacitor
d- Damper
DDL- Double diffuse layer
DNA- Deoxyribonucleic Acid
DSU- Dithiobis Succinimidyl Undecanoate
F- Force
f- Resonance frequency
f0- Fundamental resonance frequency
fA- Antiresonant frequency for phase angle zero and maximum impedance magnitude
FET- Field Effect Transistor
fP- Frequency at phase angle zero
fR- Resonance frequency for phase angle zero and minimum impedance magnitude
fs- Frequency at phase angle zero
fZmax- Frequency at maximum impedance
fZmin- Frequency at minimal impedance
G- Conductance
g- Gravitational acceleration G- Shear complex modulus G"- shear loss modulus G’- Shear storage modulus h- Liquid height
hf- Thickness of a layer
HIV1- Human Immunodeficiency Virus Type 1
HUT- 11-hidroxy-1-undecanothiol
I- Ionic strength
IEQCM- Impedance assisted electrochemical quartz crystal microbalance
IUPAC- International Union of Pure and Applied Chemistry
k- Spring constant
k1- Association rate constants
k-1- Dissociation rate constant
KD- Dissociation constant
LF- Inductance due to surface mass variation upon mass loading
LL- Inductance due to viscoelastic variation upon liquid loading
Lm- Series inductor
lQ- thickness of the resonator
m- Mass
MB- Methylene blue
ODN- Oligonucleotide
PBS- Phosphate buffer solution
Q- Charge
Q- Quality factor
QCM- Quartz Crystal Microbalance
R- Resistance
RF- Resistance due to viscoelastic variation upon mass loading
RL- Resistance due to viscoelastic variation upon liquid loading
RLC- Circuit with resistors, capacitors and inductors
Rm- Series resistor
S/N- Signal to noise ratio
SAM- Self Assembled Monolayer
SNP- single nucleotide polymorphism
ssDNA- Single stranded deoxyribonucleic Acid
TSM- Thickness-Shear-Mode Resonator
VH- anti-Vif single domain antibody
VHD- anti-Vif camelized single domain antibody
Vif- Virion infectivity factor
x- Displacement X- Reactance
XL- Inductive reactance
Y- Admittance
Z- Impedance
δ- Decay length of shear wave
Δf- Change in resonance frequency
ηL- viscosity of liquid
θ - Relative amount of surface coverage λ- Wavelength
ρf- Density of a layer
ρL-density of the liquid
ρQ- density of quartz
List of Figures
Figure 1.1. Schematic representation of a biosensor.
Figure 1.2. AT-cut of a quartz crystal. A quartz plate is cut at an angle of 35º10’ with respect to the optical axis. A deviation of only 5’ leads to a temperature coefficient that is different from zero in the range of 0-50ºC.
Figure 1.3. QCM top and bottom views showing the metal electrodes and a cross section. Figure 1.4. Shearing mode of vibration of AT-cut quartz discs due to the application of a potential across the structure of the crystal.
Figure 1.5. Basic structure of an oscillator circuit.
Figure 1.6. Schematic representation of the physical model of the wave motion in the piezoelectric element and the liquid. Adapted from Lec, 2001.
Figure 1.7. Influence of operation frequency (fundamental and harmonics) on shear wave penetration. Adapted from Lec, 2001.
Figure 1.8. Basic mechanical model of a resonator.
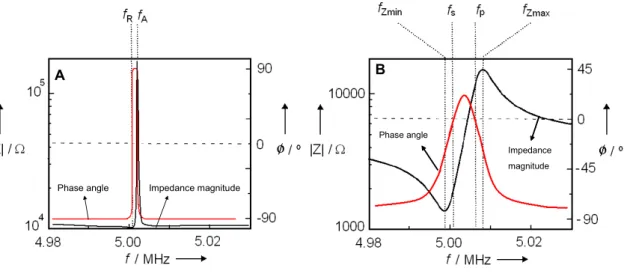
Figure 1.10. Representation of impedance and phase angle spectrums as obtained with a network analyzer, for air (A) and liquid exposure (B) of a QCM. Considering the BVD equivalent circuit, for the case of unloaded sensor (Rm→0) there are two marked resonance
frequencies: fR and fA. For the case of sensor damping (Rm > 0) there are four marked
resonance frequencies: fZmin, fs, fp, and fZmax.
Figure 1.11. Modified Butterworth van Dyke model representing a loaded resonator in liquid medium. The original four BVD electrical elements Lm, Rm ,Cm and C0 are the sum of
different contributions, namely the liquid loading and mass adsorption.
Figure 1.12. Factors influencing the response of a QCM coated with a viscoelastic film and/or working in a liquid environment (Lucklum and Hauptmann, 2003).
Figure 2.1. Silver-stained SDS-PAGE of purified 4BL (lane 1), VH (lane 3), VHD (lane 5) and Vif (lane 7) and respective western blot autoradiographs (lanes 2, 4, 6, and 8); M-Molecular weight markers. Adapted from Ferreira et al., 2007.
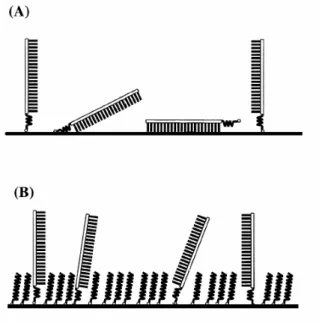
Figure 2.2. Representation of the formation of a self-assembled monolayer (SAM). Alkanethiol molecules present in solution start to spontaneously adsorb to gold surfaces and self assemble as oriented monolayers.
Figure 2.3. Scheme of the steps taken to detect streptavidin molecules in solution using quartz crystals covered with biotin. The same scheme is applicable for all sensors based on protein molecules.
Figure 2.4. Scheme of the functionalization of the gold electrodes with (A) the thiolated ssDNA probe and finally with (B) the alkanethiol, to form a mixed monolayer.
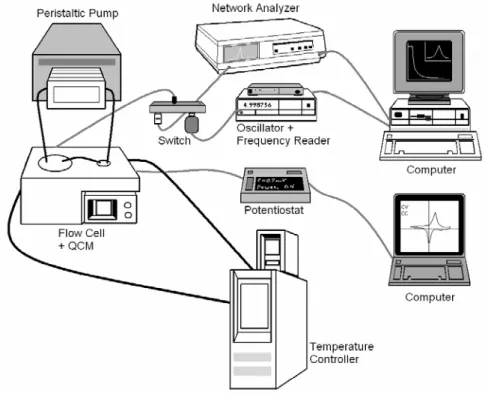
Figure 2.5. Experimental set-up of the 5 MHz quartz crystal microbalance system. Dark lines represent liquid flow tubes and gray lines are electrical connections.
Figure 3.1. Resonant frequency decrease upon immersion of a 5 MHz quartz crystal in Milli-Q water at 20ºC.
correspondent theoretical Kanazawa curve (□ experimental data; ▬ theoretical data). B) Frequency linear dependency on (ρL x ηL)1/2, for the glycerol solutions case where the black
solid line represents the Kanazawa model and the white triangles represent the experimental results. The slope of the solid line corresponds to the Kanazawa liquid sensitivity factor for a 5 MHz crystal.
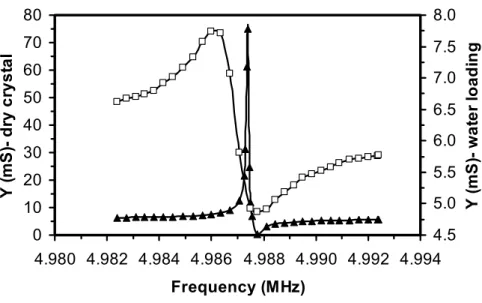
Figure 3.3. Home-made 5 MHz QCM system typical admittance spectrum in air (black triangle) and in Milli-Q water (white square), at 20ºC.
Figure 3.4. Admitance spectrum of the quartz crystal in contact with water (the same as in Fig 3.4). The admittance magnitude equation is fitted to the experimental curve to extract the equivalent circuit components.
Figure 3.5. A) Parametric plot of ∆XL vs. ∆R (□ experimental data; ▬ theoretical data), for
increasing percentages of glycerol (from left to right = 0 -80%) in aqueous solution in contact with a quartz crystal. The solid line has a slope of unity and represents the predicted behavior of a QCM system in contact with Newtonian fluids of increasing viscosity and density. Inset: calculated frequency linear dependency on (ρL x ηL)1/2, for the glycerol solutions case (○
experimental data; ▬ Kanazawa model). The deviation obtained with the experimental results for both plots is only 3%. B) For the system-check using glycerol solutions, the obtained frequency shift with the oscillator is linearly related to the resistance shift obtained with the network analyzer, validating the experimental results obtained simultaneously with both instruments according to Equation 17 (□ experimental data; ▬ theoretical data).
Figure 3.6. Resonant frequency readings noise amplitude obtained after each regeneration cycle procedure to remove a deposited film of 11-hidoxy-1-undecanothiol, using “piranha” solution and a -1.4 V tension (■ electrochemical cleaning; □ piranha solution cleaning).
Figure 3.7. Cyclic voltammograms of 4.0 mM potassium hexacianoferrate (III) (a) on a clean crystal (bare gold electrode) and (b) on a crystal covered with a 11-hidroy-1-undecanothiol SAM in PBS buffer (pH 7.0) at a scan rate of 0.1 V/s.
Figure 3.8. Potassium hexacianoferrate (III) reduction and oxidation peaks (■ reduction peak; □ oxidation peak; --- original peaks) obtained with cyclic voltammograms conducted after each electrochemical cleaning procedure of the crystal covered with the alkanethiol SAM.
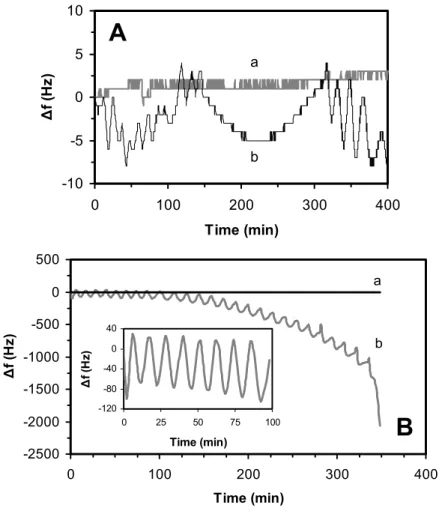
Figure 3.9. A) The quartz crystal response in an open support, to contact with air (a) and water (b), showing clearly a very stable frequency signal for the first case but a periodic shift in the second case. B) Quartz crystal response to contact with absolute ethanol (6 mm liquid height) in (a) a closed support and in (b) an open support. Inset: the first 100 minutes of curve b.
Figure 3.10. A) Batch QCM experiment where the crystals were assembled in a 300 µl closed cell. The quartz crystal frequency response was followed with the sensor in contact with degassed (a) and non degassed water (b). B) Batch QCM experiment where the crystals were assembled in a 300 µl closed cell, and only loaded with degassed fluids. The chamber was first loaded with 200 µl of water and then a 100 µl sample (indicated by arrow) of the same fluid was injected. In one crystal the sample was carefully injected with a syringe (a), but for the other a micropipette was used (b) and one single air bubble was introduced inside the chamber.
Figure 3.11. QCM response to hydrostatic pressure drops by diminishing the height of a water column to which the sensor, enclosed in a flow-cell, is connected through tubing. (dashed line is an aid to the eye).
Figure 3.12. QCM response to air pressure. A crystal was assembled in a closed metal chamber, from which air was first pumped out (causing a resonant frequency decrease) and then let in (causing a resonant frequency increase). The pressure differential studied was of approximately 100 kPa.
Figure 3.13. QCM in contact with water at 25ºC in batch (a), afterwards 50 μl of water were injected on top of the crystal (b) and then again in a vessel connected by tubing to the crystal flow cell (c). A peristaltic pump was turned on (d), and the water started flowing by overpressure to the crystal chamber, at 1 ml/min in a 1 mm silicone tube (e). The same flow was then achieved but with a 1 mm tygon tube in overpressure mode (f) and then on underpressure mode (g).
Figure 4.1. QCM resonance frequency response to increasing ionic strength. Experimental result with transient response for successive additions of concentrated NaCl solution (arrows) to the final ionic strengths I- 0.2 mM; II- 1.0 mM; III- 3.4 mM; IV- 9.9 mM; V- 26.5 mM; VI- 52.6 mM.
Figure 4.2. Resonant frequency response in function of the addition of injection of 1 ml of NaCl solutions at different concentrations in a PBS 100 mM (pH 7.0) flow (500 µl/min at 25ºC).
Figure 4.3. QCM resonance frequency response to increasing ionic strength. Average resonance frequency variation (Δf) with increasing ionic strength for (●) NaCl, (■) KCl, (♦) CaCl2 and (▲) MgCl2, resulting from n = 6 independent measurements for each salt.
Figure 4.4. Variation of the Butterworth van Dyke model parameters in liquid (subscript L), relatively to the crystal loaded with Milli-Q water, with the ionic strength for (●) NaCl, (■) KCl, (♦) CaCl2 and (▲) MgCl2. (A) inductance; (B) resistance; (C) calculated resonance
frequency variation, (D) parallel capacitance and (E) parametric polar impedance plot where the ionic strength increases counter-clockwise, as indicated by the arrow. The figures correspond to the average of impedance analysis data resulting from three independent experiments with each salt.
Figure 4.5. Butterworth van Dyke equivalent circuit model (A) and proposed Butterworth van Dyke equivalent circuit (adding B and C) of QCM sensors. I - unloaded resonator; II - elements added due to liquid medium exposure; and III - elements added due to the adsorption of mass on the surface of the sensor.
Figure 4.6. Scheme representing the strategy used to develop a piezoelectric DNA sensor. The crystals were first functionalized with a thiolated oligonucleotide, forming a ssDNA film, used to target the complementary sequence. The complementary oligonucleotide was detected non-labeled and labeled with 10 nm gold nanoparticles.
Figure 4.7. Crystal sensor response to DNA hybridization. All crystal sensors used were functionalized with HS-Pr1 probe and blocked with 11-hydroxy-1-undecanothiol: (A) resonance frequency recorded for crystal sensors incubated with (I) PBS buffer, (II) 1 μM of Ctr1, (III) 1 μM of Tgt1, (IV) 1.7 nM of Au-SAM nanoparticles, (V) 1.7 nM of Au–HS-Tgt1 nanoparticles; (B) impedance data acquired for crystal sensors incubated with gold nanoparticles modified with 11-hydroxy-1-undecanothiol (Au-SAM) and gold nanoparticles functionalized with complementary target HS-Tgt1 (Au–HS-Tgt1).
Figure 4.8. Relation between measured resonance frequency variation and calculated parallel capacitance in the range of 1 mM ≤ I ≤ 50mM. Triplicate independent experiments for (●)
NaCl (12 experimental points), (■) KCl (12 experimental points), (♦) CaCl2 (12 experimental
points), and (▲) MgCl2 (9 experimental points) were performed; Linear regression of
experimental data yielded the correlations ∆f = (7.8±0.4)×∆C + (-24±1); r = 0.9862; p < 0.0001, for NaCl; ∆f = (8.7±0.3)×∆C+ (-23.6±0.8); r = 0.9935; p < 0.0001, for KCl; ∆f = (7.8±0.5)×∆C+ (-31±2); r = 0.9790; p < 0.0001, for CaCl2; and ∆f = (7.7±0.9)×∆C+(-28±4); r
= 0.9372; p = 0.0002.
Figure 5.1. (A) Frequency shift response of quartz crystal gold sensors to the exposure to increasing bulk concentrations (a- 10 μM; b- 30 μM; c- 50 μM; d- 100 μM; e- 200 μM; f- 300 μM) of 11-hydroxy-1-undecanothiol. (B) Saturation curve showing the total frequency shift obtained for each concentration of alkanethiol used. The curve represents the non-linear interpolation of the data to the saturation component of the molecular model presented in Equation 22, with accepted goodness for Chi2 = 9.14< critical Chi2 = 11.07 (α = 0.05, n = 5). (C) The residuals data for the interpolation presented in B. (D) Scatchard plot and (E) Hill plot for the data presented in B. (F) Linear dependence of the 1:1 molecular model calculated constant τ (relaxation time of binding), to the lowest bulk alkanethiol concentrations used (10-100 μM). Linear regression of experimental data yielded the correlation: τ = (2.1±0.4)×10-4
µM-1 s-1 × C + (1.6±0.2)×10-2 s-1; r = 0.9659; ANOVA analysis accepts linear interpolation for
F statistic p = 0.034 < α = 0.05. Each presented data is the average result of three independent experiments.
Figure 5.2. (A) Blank assays compared to biotin-streptavidin molecular recognition: (1) crystal with biotin exposed to streptavidin at 3 µg/ml, (2) crystal with biotin exposed to BSA at 50 µg/ml (3) clean crystal exposed to streptavidin at 3 µg/ml, (4) crystal with biotin exposed to PBS and (5) crystal with SAM exposed to streptavidin at 3 µg/ml. (B) Biotin functionalized QCM resonance frequency response, to different streptavidin concentrations (µg/ml): (a) 0.025, (b) 0.05, (c) 0.1, (d) 0.2, (e) 0. 5, (f) 1.0, (g) 2.0 and (h) 3.0. Each presented curve represents the average of three transients obtained experimentally. (C) Saturation curve showing the total frequency shift obtained for each concentration of streptavidin used. The curve represents the non-linear interpolation of the data to the saturation component of the molecular model presented in Equation 22, with accepted goodness for Chi2 = 0.79 < critical Chi2 = 14.07 (α = 0.05, n = 7). (D) The residuals data for the interpolation presented in C. (E) Scatchard plot and (F) Hill plot for the data presented in C.
Figure 5.3. Impedance measurements for each streptavidin concentration. The (▲) inductance XLF , (●), resistance RF and (◊) parallel capacitance CF contribution of
streptavidin film to the BVD equivalent circuit, for each tested concentration.
Figure 5.4. Linear dependence of the 1:1 molecular model calculated constant τ (relaxation
time of binding), to the streptavidin concentrations used (0.5-57 nM). Linear regression of experimental data yielded the correlation: τ = (4.6±0.3)×105 M-1s-1 × C + (0.3±5)×10-5 s-1; r =
0.9882; ANOVA analysis accepts linear interpolation for F statistic p< 0.0001 < α = 0.05. Each presented data is the average result of three independent experiments.
Figure 5.5. Dependence of the calculated streptavidin-biotin association kinetic constant k1 to
increasing flow rates (Q) of carrier buffer used during piezoelectric biosensing experiments.
Figure 6.1. Representation of the antibodies 4BL, VH and VHD produced to develop the piezoimmunosensor. IgG- Immunoglobulin G; HCAb- Humanized Chimeric Antibody. Adapted from Gonçalves et al., 2002 and da-Silva et al., 2004.
Figure 6.2. Immobilization of the recombinant antibodies on the surface of activated sensors. Measured resonance frequency variation during antibody immobilization using solutions of increasing concentration of (A) anti-Vif ScFv 4BL, (B) anti-Vif VH single domain, and (C) anti-Vif VHD camelized single domain; (D) immobilization isotherms of 4BL, VH, and VHD.
Figure 6.3. Variation of BVD parameters during antibody immobilization at 50 µg/ml (◊),75 µg/ml (■),100 µg/ml (Δ), 150 µg/ml (♦), and 200 µg/ml (○).
Figure 6.4. Total variation of the resonator resistance obtained after at the equilibrium for immobilization of (♦) 4BL, (□) VH and (▲) VHD.
Figure 6.5. Binding of HIV1 Vif preparations of increasing concentrations (values next to each curve with units μg/ml) to sensors modified with (A) anti-Vif scFV 4BL, (B) anti-Vif single domain antibody VH, and (C) anti-Vif camelized single domain antibody 4BL; (D) specific equilibrium frequency signal for each antibody concentration (♦) 4BL, (□) VH, (▲) VHD. The data presented correspond to average transients from 6 independent measurements for each Vif concentration. Indicated concentrations refer to total protein quantification in purified HIV1 Vif preparations and not to HIV1 Vif monomeric isoforms. Cytochrom C (▬),
BSA (▬), and Ribonuclease A (▬), all at a concentration of 100 µg/ml, were used as controls.
Figure 6.6 Figures A (ΔXL), B (ΔR), and C (ΔC) present the variation of the Butterworth van Dyke model parameters, relatively to the response of the three immunosensors (◊) 4BL, (▲) VH and (●) VHD to different concentrations of Vif. Each presented data is the average result of six independent experiments.
Figure 6.7. Corrected frequency transients for the binding of HIV1 Vif to 4BL biofilms. Figure 6.8. Linear dependence of the 1:1 molecular model calculated constant τ-1, to the bulk Vif concentrations used for each immunosensor: (♦) 4BL, (□) VH and (▲) VHD. Linear regression of experimental data yielded the correlations: τ-1 = (1.3±0.2)×10-5×C + (1.1±0.1)×10-3; r = 0.9697; p = 0.0063, for 4BL; τ-1 = (2.5±0.2)×10-5×C + (0.4±0.09)×10-3; r = 0.9963; p = 0.0037, for VH; τ-1 = (3.6±0.3)×10-5×C + (1.2±0.2)×10-3; r = 0.9885; p = 0.0015, for VHD. Each presented data is the average result of six independent experiments.
Figure 6.9. Detection of HIV1 Vif in complex mixtures with VHD camelized single domain antibody piezoimmunosensors. Arrows indicate the moment of sample application to the sensor. (A) A mixture of 100 µg/ml BSA, Cytochrom C, and Ribonuclease A was added to the crystal and the frequency was monitored for a period of time before spiking with 50 µg/ml HIV1 Vif preparation; (B) sensor response obtained for cell extracts: HEK293 cell extracts from the control cell cultures (cells only expressing CFP) were applied to the sensor (curve I) and spiked with 50 µg/ml HIV1 Vif preparation (curve II); curve III shows the sensor response for cell extracts obtained from HEK293T cell cultures expressing HIV1 Vif.
List of Tables
Table 1. RLC values obtained after fitting the admittance model to from the first to the seventh harmonic experimental curves obtained with the network analyzer. *The Cm value
was assumed to be invariant for each harmonic and that the fundamental resonant frequency is 5 MHz.
Table 2. Impedance analysis parameters calculated for 11-hidroxy-1-undecanothiol SAMs obtained with increasing bulk concentrations of alkanethiol, and respective immobilized mass calculated from the frequency data in Fig. 5.1A using the Sauerbrey model.
Table 3. Rate and equilibrium kinetic constants determined for the pair streptavidin-biotin in different published studies and in this work. n.d.- constants not calculated; *- off-rate not calculated and KD obtained using k-1 published by Green in 1990.
Table 4. Rate and equilibrium constants for the binding of Vif to immobilized recombinant antibodies.
Chapter 1
Introduction
1.1. What is a Biosensor?
The integration of advanced microfabrication technologies, signal processing systems and biological sensing interfaces to produce biosensors, has emerged in very recent years as a rapidly growing area of enormous potential, aiming specially at the simplification of chemical/biochemical measurements and extending assay reliability outside the confines of a central laboratory (Pearson et al., 2000; Willner and Wilner, 2001). The field of biomolecular sensors is now beginning to materialize as an aid to understand the underlying biophysical principles of molecular recognition as well as to detect the presence of specific analytes.
Currently, biosensors are widely used in clinical diagnosis and biomedicine as diagnostic tools and for drug screening (Sakai et al., 1995; Chang et al., 2000; Aizawa et al., 2004). There are also developed applications for environmental monitoring and pollution control, for military and security tasks like the detection of chemical/ biological weapons and explosives
and for industrial processes (Gomes et al., 1998; Su et al., 2001; Mirmohseni and Alipour, 2002; Skládal, 2003).
The IUPAC (International Union of Pure and Applied Chemistry) definition for a biosensor is: "A biosensor is a self-contained integrated device, which is capable of providing specific quantitative or semi-quantitative analytical information using a biological recognition element (biochemical receptor) which is retained in direct spatial contact with a transduction element. Because of their ability to be repeatedly calibrated, we recommend that a biosensor should be clearly distinguished from a bioanalytical system, which requires additional processing steps, such as reagent addition.” (IUPAC, 1999).
A biosensor is basically a molecular sensing element (e.g. bioreceptors like antibodies, DNA, enzymes, cells) attached to a transducer (Fig. 1.1).
Signal
No Signal Transducer
Receptor
Target Molecule Signal
No Signal Transducer
Receptor
Target Molecule
Figure 1.1. Schematic representation of a biosensor.
The molecular sensing element recognizes the target analyte and the transducer converts the recognition event into an electrically measurable signal, related to the build-up of concentration or activity of the analyte in the vicinity of the device.
The most common transducers used for biosensing applications, are electrochemical, amperometric (detect changes in current at constant potential), potentiometric (detect changes in potential at constant current), conductive (detect changes in conductivity between two electrodes), chemically sensitive FETs (field effect transistors), capacitive (used when the biorecognition reaction causes a change in the dielectric constant of the medium), optical (correlate changes in concentration, mass, or number of molecules to direct changes in the characteristics of emitted or absorbed light), mechanical or acoustic (detect changes in mass, strain, surface stress, viscosity), thermal (measure changes in temperature) and magnetic (takes advantage on the magnetic properties of materials).
The main steps in biosensor development include the identification of the target analyte to be detected, the selection of a suitable molecular sensing element (bioreceptor molecule), the selection of a suitable immobilization method of the bioreceptors to the transducer and a suitable transducer. It also has to be considered the design of the sensor, including readout electronics, detection limits, possible interfering sources, linearity of the response, etc. and the design of the sensor packaging.
The main requirements for an ideal biosensor include the clear discrimination of the output signal relatively to the measurement environment, the compatibility between the functional surface and the transducer, high specificity (capability to interact with the analyte of interest) and selectivity (low interference from other molecules), sufficient sensitivity and resolution (low detection and quantification limits), sufficient accuracy and repeatability (no false-positive or false-negative results), sufficient speed of response (preferentially real-time response) and sufficient dynamic range. Another crucial issue is insensitivity to environmental interference or else the effects must be compensated (temperature, chemical
environment, pH, ionic strength, non-specific binding, electric and electromagnetic effects, etc.)
The current work focuses on the development of piezoelectric based biosensors, where the transducer is acoustic and mechanically responds to mass changes. The transducers chosen to develop the biosensors are commonly denominated microgravimetric devices, generally known as quartz-crystal microbalance (QCM), that have already been used for different applications (Pan et al., 1996; Etchenique and Brudny, 2000; Ewalt et al., 2001; Liss et al., 2002; Liu et al., 2004; Fabregette et al., 2005; Su and Li, 2005; Modin et al., 2006). and its advantages, limitations, physical principles and working conditions are next described.
1.2. The piezoelectric effect
In 1880, the Curie brothers demonstrated that the deformation of a Rochelle salt crystal (sodium potassium tartrate) through pressure application results in the generation of a voltage across the crystalline material (Curie and Curie, 1880). This phenomenon was called the piezoelectric effect, based on the Greek word “piezin”, that means “to press” (Hankel, 1881). Later the Curies demonstrated the opposite effect: the application of a potential across a piezoelectric material produces a mechanical stress and the distortion of the structure (Curie, 1908). This is still nowadays called the converse piezoelectric effect (Varela et al., 2000).
In the beginning of the 20th century it was discovered that quartz crystals exhibiting piezoelectric properties could be used as transducers and receivers of ultrasound in water and from then on the piezoelectric effect was used to develop acoustic based technology: speakers, microphones and sound pick-ups. In the 1920’s, it was demonstrated that through
the piezoelectric effect, the resonant vibration of quartz produced an AC electrical signal with a very stable and precise frequency (Cady, 1921; Pierce, 1923). This signal allowed a high precision time reference, and so quartz crystals are still used nowadays in the electronics field as clocking elements.
In 1959, Sauerbrey published an article in which he described that the resonant frequency change of a crystal is directly proportional to the deposited mass on its surface (Sauerbrey, 1959). With the work of Sauerbrey, the first step was taken towards the development of a new small-mass measuring tool: the quartz crystal microbalance (QCM).
In the 60s and 70s the QCM began to be used as a tool to monitor thickness of films in vacuum and air and is still used today to control the thickness during the process of deposition of layers (Janshoff et al., 2000).
But the technology developed until the late 70s for oscillator circuits, to drive the vibration of quartz crystals, was only suitable for measurements in air, not allowing proper operation of the resonators in fluids. In 1982, Nomura and Okuhara built an oscillator circuit that permitted the use of QCM in liquid environments (Nomura and Okuhara, 1982), giving the first instrumental step for the basic development of QCM biosensing tools.
1.3. Quartz crystal microbalance- QCM
Generally, a quartz crystal microbalance is a device that can be induced to vibrate or oscillate at a stable frequency that strongly depends on mass.
stability of Δf/f ≈ 10-8 and a temperature coefficient that is almost zero between 0-50ºC. Hence these crystals exhibit small changes in frequency due to temperature variation, making them the most suitable for QCM sensors (Göpel et al., 1991; Sullivan and Guilbault, 1999).
Figure 1.2. AT-cut of a quartz crystal. A quartz plate is cut at an angle of 35º10’ with respect to the optical axis.
A deviation of only 5’ leads to a temperature coefficient that is different from zero in the range of 0-50ºC.
The commercial version of the QCM basically consists of AT-cut thin quartz discs, with circular metal electrodes on both sides (Fig. 1.3) to drive the oscillations.
Due to its piezoelectric properties, when the electrodes are connected to an oscillator and an AC electrical field is applied, parallel to the piezoelectric axis (direction in which tension or compression develops polarization parallel to the strain), a shear wave is generated that propagates through the crystal inducing the oscillation of the crystal (Fig. 1.4) (Chagnard et
Figure 1.3. QCM top and bottom views showing the metal electrodes and a cross section.
Figure 1.4. Shearing mode of vibration of AT-cut quartz discs due to the application of a potential across the
structure of the crystal.
The crystal vibrates at the frequency of the applied AC field. If such frequency is coincident with to the frequency where the impedance of the crystal is minimal, the amplitude of the crystal vibration will be maximized. This is called the crystal's fundamental resonance frequency and an electronic circuit, using feedback (Fig. 1.5), can be used to stabilize the frequency at its resonance value (Chagnard et al., 1996; Sullivan and Guilbault, 1999; Kaspar
et al., 2000).
For shear mode oscillation there are several frequencies that correspond to resonant conditions, termed harmonic or overtone resonance frequencies (such as 3rd overtone, 5th
overtone, etc.). For all resonant modes, displacement maxima occurs at the crystal faces, however the largest amplitude occurs at the fundamental frequency and as the harmonic number increases the vibration amplitude decreases (Sullivan and Guilbault, 1999).
Figure 1.5. Basic structure of an oscillator circuit.
The quartz crystal microbalance is also denominated a Thickness-Shear-Mode Resonator (TSM), because the acoustic wave generated piezoelectrically propagates across the crystal, through the bulk of the material. The thickness of the crystals determines the fundamental resonance frequency, at which the crystal can vibrate mechanically. For instance, a 5 MHz quartz exhibits a thickness of 0.33 mm, while a 30 MHz crystal is only 55 μm thick (Göpel et
al., 1991; Sullivan and Guilbault, 1999).
A characteristic of QCM sensors is that when exposed to air exhibit a high quality factor (Q) value, which is the ratio of the energy stored to energy lost during a single oscillation. In terms of frequency signal, it is represented has the ratio between the resonance frequency and the frequency width at half maximum (Q = f0/∆fFWHM). Low energy losses in oscillating
gas phase this quantity can exceed 105, but in liquid applications however, Q will generally have values in the order of 103, indicative of energy damping by the fluid, but the quartz crystals still perform acceptably at these levels (Kanazawa and Gordon, 1985; Chagnard et
al., 1996; Sullivan and Guilbault, 1999).
1.4. Physical model of a quartz crystal piezoelectric
sensor
As mentioned earlier, piezoelectric materials have the distinctive capability to induce a mechanical strain when an electrical voltage is applied, and vice versa. By stimulating a sensor with an alternating voltage, standing acoustic waves are created within the sensor, and the sensor acts as an extremely responsive resonator (Fig. 1.6).
y x y x y x
Figure 1.6. Schematic representation of the physical model of the wave motion in the piezoelectric element and
If the sensor is weighed down with a medium, it transmits a shear wave through the medium (Fig. 1.6). The generated shear wave penetrates a very short distance into the liquid, and the influence of the boundary conditions on the behavior of the sensor is extremely dominant. Hence the response of a crystal sensor to changes on its surface is based on corresponding changes in its resonant behavior. The crystal acts as both a mechanical and an electrical resonator coupled through the piezoelectric effect (Ballantine et al., 1997). During an oscillation mechanical energy is transferred from kinetic energy of the moving mass of the crystal to potential energy stored in the elastic deformation of the crystal. As resonance losses are minimized and the vibration amplitude reaches a maximum (Lec and Lewin, 1998; Janshoff et al., 2000). This resonance frequency depends on the crystal properties, on the mass deposited on the crystal surface, and on the coupling between the surface and the surrounding liquid medium.
The linear theory of piezoelectricity regarding wave motion through the quartz crystal is complex, and requires satisfying a set of mechanical and electrical models, that relate the production of electric displacement by applying mechanical stress (piezoelectric effect) and the production of strain in the crystal by applying an electrical field (converse piezoelectric effect) (Martin et al., 1991; Martin et al., 1993; Janshoff et al., 2000; Lec, 2001).
When the acoustic wave is transmitted from the surface of the crystal and propagates through the liquid, an energy loss occurs. The shear wave transmitted into the fluid dissipates quickly as the energy is converted to heat by viscous friction (Martin et al., 1991; Martin et al., 1993; Janshoff et al., 2000; Lec, 2001).
In liquid phase, the description of the propagation of the acoustic waves in terms of one-dimensional mechanical motion relies on two simple boundary conditions. The first condition is the assumption of no slip, that is, the layer of fluid closest to the surface moves at the same
velocity as the surface. The second fluid boundary condition states that fluid motion decays with distance from the crystal surface, vanishing at infinite distance (Martin et al., 1991; Martin et al., 1993; Janshoff et al., 2000; Lec, 2001).
For an oscillatory shear driving force at the solid/liquid boundary, the amplitude of oscillation (A) decays in an exponential form, within a length (δ) in the direction normal to the surface of the crystal (y axis)(Glassford, 1978, Martin et al., 1991). The decay length (δ) that limits the propagation of the damped shear wave into the fluid is dependent on the viscosity (ηL) and
density (ρL) of the liquid:
δ y e A A= 0 − (1) 2 / 1 ) / 2 ( ηL ωρL δ = (2)
Where the term A0 is a constant and ω is the angular frequency (ω =2πf , f is resonance
frequency).
For water, the decay length of the acoustic shear wave, at a resonance frequency of 5 MHz, is approximately 250 nm (Ricco and Martin, 1987). This indicates that the quartz resonator responds to the fluid only in the region very near the oscillating surface.
As explained in section 1.3, a TSM sensor can operate at odd harmonics. The resonance frequency at each harmonic generates a different shear wave, and so according to Equation 2,
the crystal sensor can probe the interface at different depths, i.e. if the frequency increases, then the depth of penetration is reduced (Fig. 1.7).
Figure 1.7. Influence of operation frequency (fundamental and harmonics) on shear wave penetration. Adapted
from Lec, 2001.
1.5. QCM as a mass sensing tool
The vibrational motion of the quartz crystal results in an acoustic wave that propagates back and forth across the thickness of the crystal, between the crystal faces. At resonance a standing wave condition is established in the quartz resonator and the fundamental resonance frequency, f0, of the acoustic wave, which is also known as the thickness shear mode or the
fundamental mode (Bechmann, 1952), is given by the following equation:
Q Q Q l f ρ μ 2 0 = (3)
Where lQ is the thickness of the resonator, ρQ is the density of quartz (2.648 g.cm-3) and µQ is
the shear modulus of quartz (2.947×10¹¹ g.cm-1.s-2).
Considering that the mass of the quartz crystal per unit area (M = m/A) is given by the product of the crystal thickness and quartz density (lQ ρQ), Equation 3 can be written as:
M f Q Q 2 0 ρ μ = (4)
The addition of mass (per unit area) ∆M causes a change in resonance frequency ∆f:
) ( 2 0 M M f f Q Q Δ + = Δ + μ ρ (5)
Combining Equation 4 with Equation 5 and rearranging:
⎟ ⎠ ⎞ ⎜ ⎝ ⎛ Δ + Δ − = Δ M M M M f f 1 0 (6)
M M f
f =− Δ
Δ 0 (7)
Considering the concept of mass change per unit area, Equation 7 can be written as:
m C A m l f f m Q Q Δ − = Δ − = Δ ρ 0 (8)
This is the basic Sauerbrey equation (Sauerbrey, 1959), where Δf is the resonance frequency change (Hz), Δm is the surface mass change (μg.cm-2) and Cm is known as the sensitivity factor dependent on the fundamental resonance frequency. This equation defines the utilization of a QCM as a mass measuring tool due to the simple fact that the resonant frequency decreases with mass deposition on the active area of the exposed electrode.
This model makes the assumption that the attached mass follows the vibration of the crystal and therefore the crystal behaves as if it was simply thicker; the equation is only usable for thin, rigid and uniform films. So in this model a QCM sensor is understood as a multilayer structure of one piezoelectric layer and a certain limited number of piezoelectric and non-viscoelastic layers. If the mass is elastic, then it will not rigidly follow the vibration and its viscoelasticity will also contribute to the frequency shift (Tenan and Soares, 1998; Sabot and Krause, 2002).
In the 1980’s Kanazawa and Gordon developed a simple mathematical relation that describes the resonant frequency of a QCM dependence on the density and viscosity of liquids
(Kanazawa and Gordon, 1985). The Kanazawa equation predicts that the change in resonant frequency of a QCM is proportional to the square root of the liquid’s density-viscosity product (Equation 9). ) ( L L f ' ρ η C f =− Δ (9)
Where, C’f is the liquid sensitivity factor (7140.5 Hz1/2 g-1.cm2 ), ρL is the liquid density and
ηL is the liquid viscosity.
1.6. Impedance analysis of QCM
Impedance is an important parameter used to characterize electronic circuits, components, and the materials used to make components. Impedance (Z) is generally defined as the total opposition a device or circuit offers to the flow of an alternating current (AC) at a given frequency, and is represented as a complex quantity which can be graphically represented on a
vector plane as a magnitude and phase angle: Z ∠φ. An impedance vector consists of a real part (resistance, R) and an imaginary part (reactance, X) and can also be expressed using the rectangular-coordinate form R + jX.
Impedance analysis of quartz crystal microbalances is supported on a system modeling of the piezoelectric resonator, which consists on an electrical/mechanical analog. It is important to remember that the piezoelectric resonator is a mechanical structure that is forced to oscillate at a specific set of frequencies and can be modeled mechanically as a simple vibrating
structure. The basic model for a vibrating mechanical structure is that of a mass, spring and damper (Buttry and Ward, 1992) (Fig. 1.8).
Figure 1.8. Basic mechanical model of a resonator.
For the model presented in Fig. 1.8, there are three fundamental parameters that determine the overall response to the force F: the mass of the system (m), the spring constant (k) and the damping of the damper (d). Writing the equation of motion for this system:
) ( ) ( 2 2 t kx dt dx d t F dt x d m = − − (10)
Because of the piezoelectric effect, the mechanical system is linked to the electrical domain and Equation 10 can also be expressed in an electrical oscillation. Using Kirchoff’s voltage law and by making an analog between displacement (x) and charge (Q), it is possible to
develop an RLC equivalent electrical circuit for the resonant mechanical structure (Buttry and Ward, 1992; Bandey et al., 1996; Soares et al., 1998, Etchenique and Calvo, 1999):
0 ) ( 1 2 2 = + + Q t C dt dq R dt Q d L m m m (11)
The different components of this RLC circuit are an inductor (Lm), a resistor (Rm) and a
capacitor (Cm). The inductor (Lm) corresponds to the oscillation inertial component and is
related to the dislocated mass during vibration (Martin et al., 1991). The resistor (Rm)
corresponds to the oscillating energy dissipation to the structure where the crystal is mounted and to the medium which is in contact with (viscous solutions and viscoelastic films) (Martin
et al., 1991). The capacitor (Cm) corresponds to the stored energy in oscillation and is related
to the crystal’s elasticity (Martin et al., 1991). The representation of an equivalent electric circuit of a clean quartz crystal microbalance with metallic electrodes is defined by the Butterworth van Dyke model (BVD) (Fig. 1.9) (Martin et al., 1991).
The BVD circuit combines a parallel (static branch) and series resonance circuit (motional branch). The motional branch consists of Lm, Cm and Rm. The electrodes on both sides of the
crystal plate provide an additional parallel capacitance C0, which gives rise to the parallel circuit.
An advanced measurement system like a network analyzer is able to quantify the parameters
Rm, Lm, Cm and C0 and distinguish its different contributions. In order to do so, the network
analyzer is tuned to supply the impedance magnitude and phase angle around the crystal’s resonance frequency that can be defined by the components Lm and Cm (Martin et al., 1991):
m mC L f π 2 1 0 ≈ (12)
When using an oscillator circuit to drive a QCM to vibrate, its resonance frequency can be easily read with a simple frequency counter. However when using a network analyzer to follow the resonance frequency of the quartz sensor, the impedance spectroscopy data is much more complex to interpret.
Figure 1.10 shows a representation of typical impedance and phase angle spectrums that can be experimentally obtained for a QCM, using a network analyzer. The figure depicts two cases: QCM exposed to air (A) and to liquid (B). In air, both impedance and phase angle plots are represented has sharp spectrums localized in a frequency range that contains the resonance frequency of the QCM. When the quartz crystal is immersed in a liquid, both spectrums move toward lower frequencies and each peak also diminishes and broadens.