Acta Cir. Bras. 2018;33(6):542-550 DOI: http://dx.doi.org/10.1590/s0102-865020180060000009
Yan YangI, Beibei LiuII, Ling GaoIII, Qi LiIV, He WangIV, Liandi WangV
Impact of 1,25(OH)
2D
3on TG content in liver of rats with
type 2 diabetes
1Abstract
Purpose: To evaluate the effects of 1,25 dihydroxy vitamin D3 (1,25(OH)2D3) on the content of triglyceride (TG), as well as on the gene and protein expressions of adiponectin receptor 2 (AdipoR2), p38 mitogen-activated protein kinase (P38MAPK), and lipoprotein lipase (LPL) in the liver of rats with type 2 diabetes mellitus (T2DM) so as to provide theoretical basis for exploring the mechanism by which 1,25(OH)2D3 regulates TG.
Methods: Wistar rats were divided into four groups (n=25), with different treatments and detected the gene and protein expressions of AdipoR2, p38MAPK, and LPL in the liver tissue by reverse transcription polymerase chain reaction (RT-PCR) and Western blotting. Mean-while, the content of TG in the liver tissue was detected by the Enzyme-linked immunosor-bent assay.
Results: The expression of AdipoR2, p38MAPK, LPL gene and protein in the liver of VitD in-tervention group was significantly higher than that in T2DM group (P <0.05), while the TG content was significantly lower than that in T2DM group (P <0.05).
Conclusion: 1,25(OH)2D3 can decrease the content of TG in the liver, and its mechanism may be achieved by upregulating the expressions of AdipoR2, p38MAPK, and LPL in the liver. Key words: Receptors, Adiponectin. Protein Kinases. Lipoprotein Lipase. Triglycerides. Rats.
IPhD, Department of Endocrinology, Affiliated Hospital of Zunyi Medical College, China. Manuscript preparation and
writing.
IIFellow Master degree, Department of Endocrinology, Affiliated Hospital of Zunyi Medical College, China. Analysis and
interpretation of data, statistical analysis.
IIIMD, Department of Endocrinology, Affiliated Hospital of Zunyi Medical College, China. Critical revision, final approval. IVFellow Master degree, Department of Endocrinology, Affiliated Hospital of Zunyi Medical College, China. Technical
procedures, acquisition of data.
VFellow Master degree, Department of Endocrinology, Affiliated Hospital of Zunyi Medical College, China. Acquisition
■
Methods
This study was carried out in strict
accordance with the recommendations in
the Guide for the Care and Use of Laboratory
Animals of the National Institutes of Health.
The animal use protocol has been reviewed
and approved by the Institutional Animal Care and Use Committee (IACUC) of Zunyi Medical College.
A total of 100 clean-grade male Wistar
rats (mean age of 6 weeks, and average body weight of 200.25 ± 10.76g) were purchased from the Harbin Veterinary Research Institute, CAAS (Certificate No.20020001) and bred at 20-25°C, 40% - 60% humidity, 12/12 h day-night rhythm, and free access to food and drinking water.
Animal grouping and establishment of T2DM model
All rats were fed with normal
full-valence granular rat feedstuff for 2 weeks,
and then grouped using random number
table into Group CON, Group T2DM, Group VitD+DM, Group VitD+SB203580 (the inhibitor of p38MARK)+DM, with 25 rats in each group. Group T2DM was fed with fat high-cholesterol diet (78.5% basal diet, 10.3% egg yolk powder, 10.0% lard oil, 0.8% cholesterol, and 0.4% bile salt) for 4 weeks, and after fasted for 16 hours, each rat was intraperitoneally injected streptozotocin (STZ, 0.5%, dissolved in citric acid buffer, pH7.2) and then tested the blood glucose at 7 am for 3 consecutive days. The rats with blood glucose >16.7 mmol/L for 3 consecutive days can be considered as successfully prepared the T2DM model. After preparing the model, Group T2DM, VitD+DM, and VitD+SB203580+DM were intraperitoneally injected with peanut oil (7 times, with the same amount as that injected in Group 1,25(OH)2D3.
Group VitD+SB203580+DM was injected with P38MAPK inhibitor (SB203580, 10 mg/
■
Introduction
As a key link during the onset of type 2 diabetes mellitus (T2DM), insulin resistance (IR) plays vital roles in the occurrence and development of T2DM1. T2DM patients are often
accompanied with lipid metabolism disorder, in which the level of free fatty acids (FFA) in the blood increases, so that excessive FFA will deposit in the target tissues of insulin, such as the adipose tissue, muscle, or liver, in the form of triglyceride (TG) and then cause IR2. Compared
with patients only with hypercholesterolemia, patients with hypertrophic thyroidemia (HTG) have a higher incidence of IR, suggesting that HTG is the important pathophysiological basis and characteristics in the occurrence
and development of diabetes3,4. Vitamin
D (VD) is a fat-soluble steroid hormone precursor, produced by the skin under sunlight or obtained through food, and can be transformed into its bioactive form, 1,25 dihydroxyvitamin D3 (1,25(OH)2D3) in the liver
and kidneys through a two-step continuous hydroxylation process. Its classic roles are reflected in regulating the metabolism of Ca, P, and bones5. However, recent years’ studies have found that VitD deficiency can promote the occurrence and development of T2DM and IR, and supplementing VitD can reduce IR6-8. In the adiponectin receptor 2 (AdipoR2) / PPAR-α pathway, AdipoR2, p38 mitogen-activated protein kinase (P38MAPK), and lipoprotein lipase (LPL) are involved in the liver fat deposition and the formation of IR9, suggesting
that 1,25(OH)2D3 may reduce the accumulation
of TG and lipid metabolism disorder through the
above pathway, but the specific mechanism is still unclear. Therefore, this study investigated the impact of 1,25(OH)2D3 on the expressions
of AdipoR2, p38MAPK, and LPL in the liver of the rats with T2DM, aiming to provide new ideas for preliminarily investigating the impact of 1,25(OH)2D3 on the TG content in such rats’
(kg·d), 7 times) every other day into the site slightly leftward to the linea alba in the lower abdomen (the needle tip was sticked into the skin from the lower abdomen toward the head direction, and when the needle reached the subcutaneous tissue, it should be pushed forward for another 3~5 ml so that the needle
can puncture into the abdominal muscle with
forming 45° with the skin. When the needle passed through the abdominal muscle, the resistance will disappear). Kept the needle static at this position, and withdrew the syringe, and if no blood or urine appeared, the drug can be gently injected with a certain speed, and after the drug was completely injected, the injection
site should be pressured so as to prevent the
flow-out of the drug. 2 weeks later, all the rats were killed after the experiment finished.
Detection of TG and blood glucose content
The enzyme colorimetric assay was then used to detect the liver TG and blood
glucose content (the kit was purchased from Roche, USA).
Reverse transcription polymerase chain reaction (RT-PCR)
The total RNA was extracted from the liver tissue, and 1.5 μg of the total RNA was used as the template for the reverse transcription reaction. The total reaction volume was 20 μL. The primers (Table 1) of AdipoR2, p38MAPK, LPL, and β-actin (internal reference) were synthesized by TaKaRa as follows:
Procedures: reaction conditions: pre-denaturalization at 95°C for 57 min, denaturalization at 95°C for 38 s, annealing at 58°C ~ 75°C for 30s, extension at 72°C for 2 min, for 28~33 cycles, extension at 72°C for 5 min. In order to correct the errors, this study used the housekeeping gene β-actin as the internal reference, and the relative content
of the target gene was obtained by dividing the average copy number of the target gene of the sample by the average copy number
of the internal reference gene of this sample.
The copy number of the template in samples
can be calculated according to its related SDS-generated Ct value from the standard curve.
Table 1 - Specific primers used for real-time PCR.
Primer Sequence (5’-3’)
β-actin upstream: 5’-TAAAGACCTCTATGCCAACACAGT-3’ downstream: 5’-CACGATGGAGGGGCCGGACTCATC-3’ AdipoR2 upstream: 5’-TGCGCACACGTTTCAGTCTCCT-3’downstream: 5’-TTCTATGATCCCCAAAAGTGTGC-3’
P38MAPK upstream: 5’-CCGTTTCAGTCCATCATTCA-3’ downstream: 5’-TCATTTCGTCATCAGTGTGC-3’
LPL upstream: 5’-ATGGAGAGCAAAGCCCTGCT-3’
downstream: 5’-CACGCCAGCAGCATGGGCTC-3’
Western blotting
The liver tissue was collected and quantified by the bicinchoninic acid (BCA) method. 30 μg of the protein was firstly performed 12% polyacrylamide
gel electropheresis (PAGE); after the electrophoresis, the products were transferred
onto one polyvinylidene fluoride (PVDF) membrane, followed by overnight incubation
1:2000, CST). The dilation rate of the secondary antibodies was 1:1000. The products were
then performed enhanced chemiluminescence
with the ECL solution for 1 min, followed by exposure in one gel imaging instrument.
Statistical analysis
SPSS19.0 was used for the statistical analysis. The data were all expressed as (x ± s). The normally distributed data were then compared by using one-way ANOVA; the
intergroup comparison of the gene and protein
expressions of AdipoR2, p38MAPK, and LPL, as well as the TG content adopted the LSD-t test when the data exhibited homoscedasticity or the Dunnett’3 test when the data exhibited unequal homoscedasticity (P < 0.05 considered as statistical significance).
■
Results
Comparison of body weight, blood glucose, and TG
Compared with Group CON, the body
weight, blood glucose, and TG in Group T2DM, VitD+DM, and VitD+SB203580+DM were significantly increased (tT2DM = 10.74, 15.38, 19.92; tVitD = 10.92, 14.83, 10.54; tp38MAPK =
10.31, 13.92, 20.05; P < 0.05), but the levels of TC, LDL-C, and HDL-C showed no significant change (P > 0.05). 2) Compared with Group T2DM, the body weight and blood glucose in Group VitD+DM and VitD+SB203580+DM showed no significant difference (P > 0.05), Compared with T2DM group and (VitD+DM) group, TG is decreased (t=2.581; P < 0.05), and TG is no significant change between (VitD+SB203580+DM)group and T2DM group, but the levels of TC, LDL-C, and HDL-C showed no significant change (P > 0.05). There was no significant difference in TG, TC, LDL-C, HDL-C, body weight, and blood glucose between Group VitD+SB203580+DM and T2DM (P > 0.05). 3) Compared with Group VitD+SB203580+DM,
the body weight and blood glucose in Group
VitD+DM showed no significant difference (P >
0.05), the TG level was significantly reduced (t =2.543, P < 0.05), but the levels of TC, LDL-C, and HDL-C showed no significant change (P >
0.05) (Tables 2 and 3).
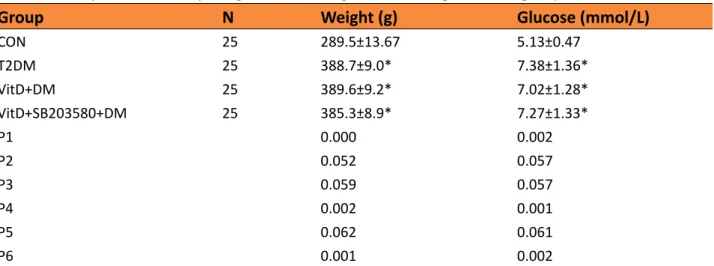
Table 2 - Comparison of body weight and blood glucose among different groups.
Group N Weight (g) Glucose (mmol/L)
CON 25 289.5±13.67 5.13±0.47
T2DM 25 388.7±9.0* 7.38±1.36*
VitD+DM 25 389.6±9.2* 7.02±1.28*
VitD+SB203580+DM 25 385.3±8.9* 7.27±1.33*
P1 0.000 0.002
P2 0.052 0.057
P3 0.059 0.057
P4 0.002 0.001
P5 0.062 0.061
P6 0.001 0.002
P1 T2DM group vs. CON group, P2 T2DM group vs. (VitD+DM) group, P3 T2DM group vs. (VitD+SB203580+DM) group, P4 (VitD+DM)
group vs. CON group, P5 (VitD+DM) group vs. (VitD+SB203580+DM) group, P6 (VitD+SB203580+DM) group vs. CON group; Compare
Table 3 - Comparison of TG, TC, HDL-C, and LDL-C among different groups (mmol/L).
Group N TG TC HDL-C LDL-C
CON 25 0.47±0.06 5.17±0.16 0.35±0.04 1.19±0.09
T2DM 25 3.49±0.27* 5.26±0.65 0.36±0.05 1.27±0.50
VitD+DM 25 1.34±0.13* 5.27±0.67 0.40±0.07 1.23±0.37
VitD+SB203580+DM 25 3.57±0.30*∆ 5.30±0.69 0.39±0.06 1.29±0.41
t1 2.156 1.367 1.265 2.792
t2 2.189 1.489 1.718 2.317
t3 1.889 1.118 1.625 2.115
t4 2.581 1.349 1.517 2,312
t5 1.306 1.214 1.386 2.251
t6 2.543 0.948 1.492 2.231
t1 T2DM group vs. CON group, t2 T2DM group vs. (VitD+DM) group, t3 T2DM group vs. (VitD+SB203580+DM) group, t4 CON group vs.
(VitD+DM) group, t5 CON group vs. (VitD+SB203580+DM) group, t6 (VitD+DM) group vs. (VitD+SB203580+DM) group; Compare with
Group CON, *P < 0.05; compare with Group T2DM, P < 0.05; compare with group VitD, ∆P < 0.05.
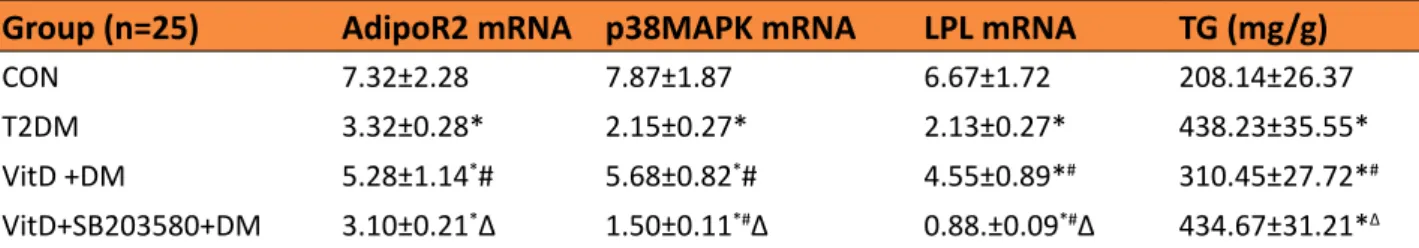
Gene and protein expressions of AdipoR2, p38MAPK, and LPL and liver TG content
1) Compared with Group CON, the gene and protein expressions of AdipoR2, p38MAPK, and LPL in DM model rats were significantly decreased (P < 0.05), while the TG content was significantly increased (P < 0.05). 2) Compared with Group T2DM, the gene and protein expressions of AdipoR2, p38MAPK, and LPL in Group VitD+DM were significantly decreased (P
< 0.05), while the TG content was significantly increased (P < 0.05). 3) Compared with Group
T2DM, the gene and protein expressions of AdipoR2 in Group VitD+SB203580+DM showed no significant difference (P > 0.05), the gene and protein expressions of p38MAPK and LPL were significantly decreased (P
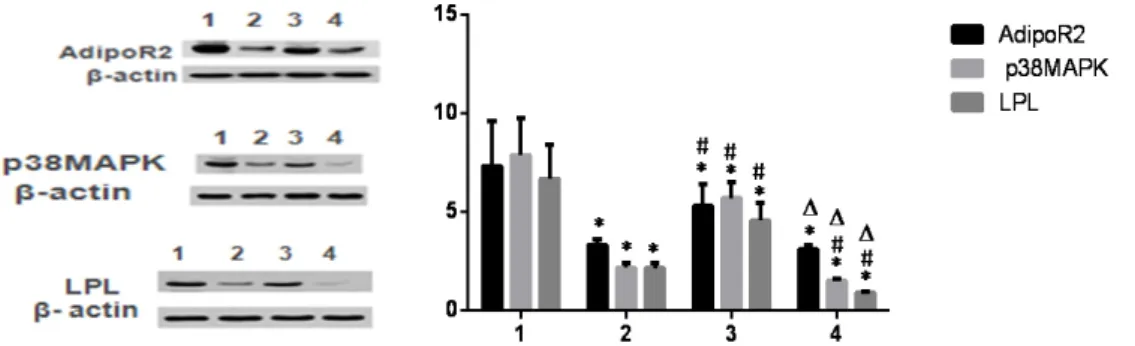
< 0.05), but the TG content showed no significant difference (P > 0.05). 4) Compared with Group VitD+DM, the gene and protein expressions of AdipoR2, p38MAPK, and LPL in Group VitD+SB203580+DM were significantly decreased (P < 0.05), while the TG content was significantly increased (P < 0.05) (Tables 4 and 5, Figure 1).
Table 4 - Comparison of gene expressions of AdipoR2, p38MAPK, and LPL and TG content among
different groups (x±s).
Group (n=25) AdipoR2 mRNA p38MAPK mRNA LPL mRNA TG (mg/g)
CON 7.32±2.28 7.87±1.87 6.67±1.72 208.14±26.37
T2DM 3.32±0.28* 2.15±0.27* 2.13±0.27* 438.23±35.55*
VitD +DM 5.28±1.14*# 5.68±0.82*# 4.55±0.89*# 310.45±27.72*#
VitD+SB203580+DM 3.10±0.21*∆ 1.50±0.11*#∆ 0.88.±0.09*#∆ 434.67±31.21*∆
Table 5 - Comparison of protein expressions of AdipoR2, p38MAPK, and LPL among different groups
(x±s).
Group (n=25) AdipoR2 p38MAPK LPL
CON 3.55±0.17 3.89±1.23 4.52±1.34
T2DM 1.20±0.07* 1.48±1.20* 2.89±0.63*
VitD+DM 2.89±0.23*# 3.03±0.98*# 3.89±0.78*#
VitD+SB203580+DM 1.46±0.13*∆ 1.96±1.18*∆ 2.50±0.73*∆
Compare with Group CON, *P < 0.05; compare with Group T2DM, #P < 0.05; compare with group VitD, ∆P < 0.05.
Figure 1 - Comparison of protein expressions of AdipoR2, p38MAPK, and LPL in liver among different groups.
Compare with Group CON, *P < 0.05; Compare with group T2DM, P < 0.05; Compare with group VitD+DM, ∆P < 0.05.
Lane 1: Group CON; Lane 2: Group T2DM; Lane 3: Group VitD+DM; Lane 4: Group VitD+SB203580+DM.
■
Discussion
In recent years, lipotoxicity -induced diabetes has attracted more and more attention, especially HTG-induced liver lipid deposition, which is an important reason for promoting IR10. 1,25(OH)
2D3 can improve IR, enhance
insulin sensitivity, and reduce lipid deposition
in the liver11, but its specific mechanism is
still unclear. Low level of 25(OH)D is one risk factor of T2DM12. APN is a fat factor specifically
secreted by the adipose tissue, and its level in the circulation is closely related to insulin sensitivity. As one of the receptors of APN, the expression of AdipoR2 is the highest in the liver, and after APN binds with it, its physiological roles can be activated, thus activating the peroxisome proliferator-activated receptor (PPAR-α) and resulting in energy consumption and fatty acid oxidation13. P38MAPK is a member of the protein serine / threonine
kinase family widely distributed in vivo, and p38MAPK activation is also involved in the fatty acid metabolism in the liver. Lipoprotein lipase (LPL) is a classic lipid metabolic enzyme, and its main physiological functions are to catalyze the breakdown of TG-rich lipoproteins, chylomicrons, and very-low-density lipoprotein to form fatty acids and monoglycerides, thus providing energy for tissue oxidation and regulating lipid metabolism14. The impact of 1,25(OH)2D3 on the expressions of AdipoR2,
p38MAPK, and LPL (key genes in the AdipoR2 / PPAR-α pathway) and TG content in the liver has not been reported in China and abroad. In this study, we established the T2DM rat
model that complies with the human clinical
the liver in T2DM rats.
The results of this study show that
1,25(OH)2D3 can increase the expressions of
AdipoR2, p38MAPK, and LPL in rat liver tissue, decrease the TG content, and reduce the lipotoxicity. It is speculated that 1,25(OH)2D3 has
certain protective effect on the liver in T2DM rats, consistent with previous studies which
reported that high-fat diet downregulate the
AdipoR2 mRNA expression in the liver tissue15. The expression of AdipoR2 and TG content in Group VitD+SB203580+DM shows no significant difference to Group T2DM, but the expressions of p38MAPK and LPL were reduced; however, the expression of AdipoR2, p38MAPK, and LPL in Group VitD+SB203580+DM are significantly reduced than Group VitD+DM, but the TG content is significantly increased. Therefore, it can be speculated that VitD may upregulate AdipoR2 and activate P38MAPK and the PPAR-α signaling pathway, thus improving liver steatosis and IR, consistent with the results of Tanabe et al.16. The expressions of these three genes in the liver of Group VitD+DM were significantly higher than Group T2DM, but the TG content is significantly reduced, so it also indirectly confirms that VitD can reduce the TG content in the liver tissue. When AdipoR2 is upregulated, it will activate the PPAR-α signaling pathway and
act on the glucose and lipid metabolism-related
enzymes, thereby enhancing the liver uptake
of glucose17. Anderson also demonstrated that
the activation of p38MAPK can prevent the accumulation of fat in the liver under high-fat feeding conditions18. P38MAPK can activate PPAR-α, increase the activity of transcription factor PPAR-α, thus exhibiting the roles of promoting the oxidation of fatty acids and
reducing the TG content in the liver19. PPAR-α
is a ligand-activated hormone receptor, highly expressed in the liver, skeletal muscle, kidney, and heart, can directly stimulate the gene expression of LPL in the liver and macrophages, thereby promoting the hydrolysis of TG20-22. As
a key factor in regulating the level of TG, if the activity of LPL is decreased, it will result in the extension of the clearance time of LDL and increase the TG level. The in vivo LPL activity in T2DM patients is normally decreased, so they often combine with HTG.
In summary, lipid metabolism disorder in T2DM patients can produce lipid toxicity; the resulted fat deposition can thus increase IR, reduce the expression of p38MAPK, and then inhibit the expression of LPL; meanwhile, the level of APN and AdipoR2 will be reduced, so that insulin sensitivity will be decreased, and lipid metabolism disorder and IR are then aggravated. Our study reveals that actively supplementing VitD can reduce the TG content in the liver tissue and improve lipid metabolism disorder. The mechanism may be explained as upregulating the expressions of AdipoR2, p38MAPK, and LPL in the liver tissue, thereby reducing the TG content and reducing IR. Therefore, we speculate that active supplement of VitD in diabetes patients may have very important roles in preventing and treating lipid metabolism disorder and IR, but its specific mechanism still needs further investigation.
■
Conclusion
1,25(OH)2D3 can decrease the content
of TG in the liver, and its mechanism may be achieved by upregulating the expressions of AdipoR2, p38MAPK, and LPL in the liver.
■
References
1. Danescu LG, Levy S, Levy J. Vitamin D and diabetes mellitus. Endocrine. 2009;35(1):11-7. doi: 10.1007/s12020-008-9115-5.
ijms15046184.
3. Mitri J, Nelson J, Ruthazer R, Garganta C, Nathan DM, Hu FB, Dawson-Hughes B, Pittas AG. Plasma 25-hydroxyvitamin D and risk of metabolic syndrome: an ancillary analysis in the Diabetes Prevention Program. Eur J Clin Nutr. 2014;68(3):376-83. doi: 10.1038/ ejcn.2013.293.
4. Gong K, Li K, Zhagn N, Zhu B, Du D, Zhang D, Zhang Z, Peng J. Gastric bypass procedure for type 2 diabetes patients with BMI < 28 kg/m2. Surg Endosc. 2017;31(3):1172-9. doi: 10.1007/s00464-016-5087-3.
5. Brenner DR, Arora P, Garcia-Bailo B, Wolever TM Morrison H, El-Sohemy A, Karmali M, Badawi A. Plasma vitamin D levels and risk of metabolic syndrome in Canadians. Clin Invest Med. 2011;34:E377. Clin Invest Med. 2011;34(6):E377. PMID: 22129928.
6. Heidari B, Nargesi AA, Hafezi-Nejad N, Sheikhbahaei S, Pajouhi A, Nakhjavani M, Esteghamati A. Assessment of serum 25-hydroxy vitamin D improves coronary heart disease risk stratification in patients with type 2 diabetes. Am Heart J. 2015;170(3):573-9.e5. doi: 10.1016/j. ahj.2015.06.017.
7. Cardoso-Sánchez LI, Gómez-Díaz RA, Wacher NH. Vitamin D intake associates with insulin resistance in type 2 diabetes,
but not in latent autoimmune diabetes in
adults. Nutr Res. 2015;35(8):689-99. doi: 10.1016/j.nutres.2015.05.019.
8. Correnti JM, Juskeviciute E, Swarup A, Hoek JB. Pharmacological ceramide reduction
alleviates alcohol-induced steatosis and
hepatomegaly in adiponectin knockout mice. Am J Physiol Gastrointest Liver Physiol. 2014;306(11):G959-73. doi: 10.1152/ ajpgi.00395.2013.
9. Yan L, Cao X, Zeng S, Li Z, Lian Z, Wang J, Lv F, Wang Y, Li Y. Associations of proteins relevant to MAPK signaling pathway (p38MAPK-1, HIF-1 and HO-1) with coronary lesion characteristics and prognosis of peri-menopausal women. Lipids Health Dis. 2016;15(1):187. doi: 10.1186/s12944-016-0356-7.
10. Zhao YC, Zhu J, Song GY, Li XS. Relationship between thioredoxin-interacting protein (TXNIP) and islet β-cell dysfunction in patients with impaired glucose tolerance and hypertriglyceridemia. Int J Clin Exp
Med. 2015;8(3):4363-8. PMID: 26064354. 11. Ryan ZC, Craig TA, Folmes CD, Wang
X, Lanza IR, Schaible NS, Salisbury JL, Nair KS, Terzic A, Sieck GC, Kumar R. 1α,25-dihydroxyvitamin D3 regulates mitochondrial oxygen consumption and dynamics in human skeletal muscle cells. J Biol Chem. 2016;291(3):1514-28. doi: 10.1074/jbc.M115.684399.
12. Mauss D, Jarczok MN, Hoffmann K, Thomas GN, Fischer JE. Association of vitamin D levels with type 2 diabetes in older working adults. Int J Med Sci. 2015;12(5):362-8. doi: 10.7150/ijms.10540.
13. Li W, Xu P, Wang C, Ha X, Gu Y, Wang Y, Zhang J, Xie J. The effects of fat-induced obesity on bone metabolism in rats. Obes Res Clin Pract. 2017;11(4):454-63. doi: 10.1016/j. orcp.2016.12.001.
14. Di Filippo M, Marçais C, Charrière S, Marmontel O, Broyer M, Delay M, Merlin M, Nollace A, Valéro R, Lagarde M, Pruneta-Deloche V, Moulin P, Sassolas A. Post-heparin LPL activity measurement using VLDL as a substrate: a new robust method for routine
assessment of plasma triglyceride lipolysis
defects. PLoS One. 2014;9(5):e96482. doi: 10.1371/journal.pone.0096482.
15. Gong Y, Li J, Li C, Mu Y, Xiao Y, Tian H, Pan C, Liu Y. The adipose tissue endocrine mechanism of the prophylactic effect of
pioglitazone in high-fat diet-induced insulin
resistance. J Int Med Res. 2012;40(4):1304-16. doi: 10.1177/147323001204000409. 16. Tanabe H, Fujii Y, Okada-Iwabu M, Iwabu
M, Nakamura Y, Hosaka T, Motoyama K, Ikeda M, Wakiyama M, Terada T, Ohsawa N, Hato M, Ogasawara S, Hino T, Murata T, Iwata S, Hirata K, Kawano Y, Yamamoto M, Kimura-Someya T, Shirouzu M, Yamauchi T, Kadowaki T, Yokoyama S. Crystal structures of the human adiponectin receptors. Nature. 2015;520(7547):312-6. doi: 10.1038/ nature14301.
17. Zhang Y, Yu H, Gao P, Chen J, Yu C, Zong C, Lu S, Li X, Ma X, Liu Y, Wang X. The effect of growth hormone on lipid accumulation or maturation in adipocytes. Cell Physiol Biochem. 2016;39(6):2135-48. doi: 10.1159/000447909.
meta analysis. Clin Chem. 2013;59(2):381-91. doi: 10.1373/clinchem.2012.193003. 19. Aye IL, Gao X, Weintraub ST, Jansson T, Powell
TL. Adiponectin inhibits insulin function in primary trophoblasts by PPARα-mediated ceramide synthesis. Mol Endocrinol. 2014;28(4):512-24. doi: 10.1210/me.2013-1401.
20. Sun XL, Yang Z, Wang W, Wang JL, Wu SY. Interaction mechaniam and influence between fatty acid oxidation in trophoblast cells and p38MAPK signal transduction pathway of severe preeclampsia. Zhonghua Fu Chan Ke Za Zhi. 2013;48(11):853-7. PMID: 24444564.
21. Chen HL, Wan YG, Zhao Q, Huang YR, Shi XM, Meng XJ, Yao J. Regulative mechanism of renal inflammatory-related p38MAPK signaling pathway in diabetic nephropathy and interventional effects of Chinese herbal medicine. Zhongguo Zhong Yao Za Zhi. 2013;38(14):2268-72. PMID: 24199552. 22. Evans J, Ko Y, Mata W, Saquib M, Eldridge
J, Cohen-Gadol A, Leaver HA, Wang S, Rizzo MT. Arachidonicacid induces brain endothelial cell apoptosis via p38-MAPK and intracellular calcium signaling. Microvasc Res. 2015;98:145-58. doi: 10.1016/j. mvr.2014.04.011.
Correspondence: Ling Gao
Department of Endocrinology
Affiliated Hospital of Zunyi Medical College Zunyi 563000 China
Phone: +86 851 28609200 [email protected]
Received: Feb 05, 2018 Review: Apr 08, 2018 Accepted: May 10, 2018
Conflict of interest: none
Financial sources: National Natural Science Foundation of China (81460168), Projects of Guizhou Science and Technology Foundation (Qiankehezi J LKZ [2013] No. 19) and PhD Starting Foundation of Zunyi Medical College ([2012] F-574)
1Research performed at Key Laboratory of