www.ccarevista.ufc.br ISSN 1806-6690
Extreme temperature trends in the equatorial region of Brazil: Case
study of the State of Ceará
1Tendência das temperaturas extremas em região equatorial brasileira: estudo de caso
do Estado do Ceará
Eunice Maia de Andrade2, Bernardo Barbosa da Silva3, Meilla Marielle Araújo Rodrigues4, Marcos Amauri
Bezerra Mendonça5 e Luiz Carlos Guerreiro Chaves5*
Abstract -Despite uncertainties as to the real causes, there is a large amount of evidence of climatic change on Earth. With the objective of investigating changes in extreme air temperatures, as well as the local effects of these changes, eight data sets, collected throughout the State of Ceará in Brazil, were analyzed. Four series of data were obtained from the semi-arid region, three from the coastal zone, and one from a mountainous region. To quantify the changes that occurred during the study period, variations in maximum and minimum temperatures were calculated in relation to the mean of each data series. The annual rates of temperature increase were estimated from the angular coefficients of the best-fit lines. The results showed that although there are differences in trends between stations, there was a systematic increase in the maximum and minimum temperature in the nineties, which was especially evident in the following decade. The highest rates of increase were recorded for the minimum temperatures (from 9.0 to 8.3 °C per century) for the stations at Guaramiranga and Crateús respectively. These data provide evidence for a greater retention of energy in the form of sensible heat during the night, possibly due to a more difficult energy exchange between the surface and the atmosphere.
Key words - Climatic changes. Global warming. Air temperature.
Resumo - Apesar das incertezas sobre as verdadeiras causas, há uma grande quantidade de evidências de mudanças climáticas
na Terra. Com o objetivo de investigar as mudanças em temperaturas extremas do ar, bem como os efeitos locais das mudanças, oito conjuntos de dados coletados ao longo do Estado do Ceará, Brasil, foram analisados. Quatro série de dados foram obtidas a partir da região semi-árida, três da zona costeira e uma de uma região montanhosa. Para quantificar as mudanças que ocorreram durante o período do estudo, as variações nas temperaturas máximas e mínimas foram calculadas em relação à média de cada série. As taxas anuais de aumento de temperatura foram estimadas pelos coeficientes angulares das linhas de melhor ajuste. Os resultados mostraram que, embora haja diferenças nas tendências entre as estações, ocorreu um aumento sistemático da temperatura máxima e mínima, que foi especialmente evidente na década seguinte, dos anos 90. As maiores taxas de crescimento foram registradas para as temperaturas mínimas (de 9,0 a 8,3 °C por século) para as estações de Guaramiranga e Crateús, respectivamente. Estes dados fornecem evidências para a maior retenção de energia na forma de calor sensível durante a noite possivelmente devido a uma troca de energia mais difícil, entre a superfície e a atmosfera.
Palavras-chave - Mudanças climáticas. Aquecimento global. Temperatura atmosférica.
*Autor para correspondência
1Recebido para publicação em 15/03/2011; aprovado 11/10/2011 Pesquisa financiada pela Universidade Federal do Ceará
2Departamento de Engenharia Agrícola, CCA/UFC, Fortaleza-CE, Brasil, [email protected]
3Departamento de Ciências Atmosféricas da Universidade Federal de Campina Grande-PB, Brasil, [email protected] 4Graduanda em Agronomia, CCA/UFC, Fortaleza-CE, Brasil, [email protected]
demand for water by the vegetation (increase in the evapotranspiration rates). In this scenario of extremely limited water resources, the sustainability of the regional development could be compromised unless, due to global warming, the depth of rainfall also increases. Based on these questions, this study focused on the investigation of the tendency of extreme air temperature changes (maximums and minimums) in three different climate areas of Ceará State, Brazil.
Material and methods
Region description
The studied area corresponds to the Ceará State (FIG. 1) in the semiarid region of the northeastern part of Brazil, which is characterized by a unimodal rainfall distribution with a high spatial and temporal variability. It exhibits an average potential evaporation rate of 2,527.6 mm year-1 with an insolation of 2,776.4 hours year-1 and an
average global radiation of 23 MJ m-2 day-1.
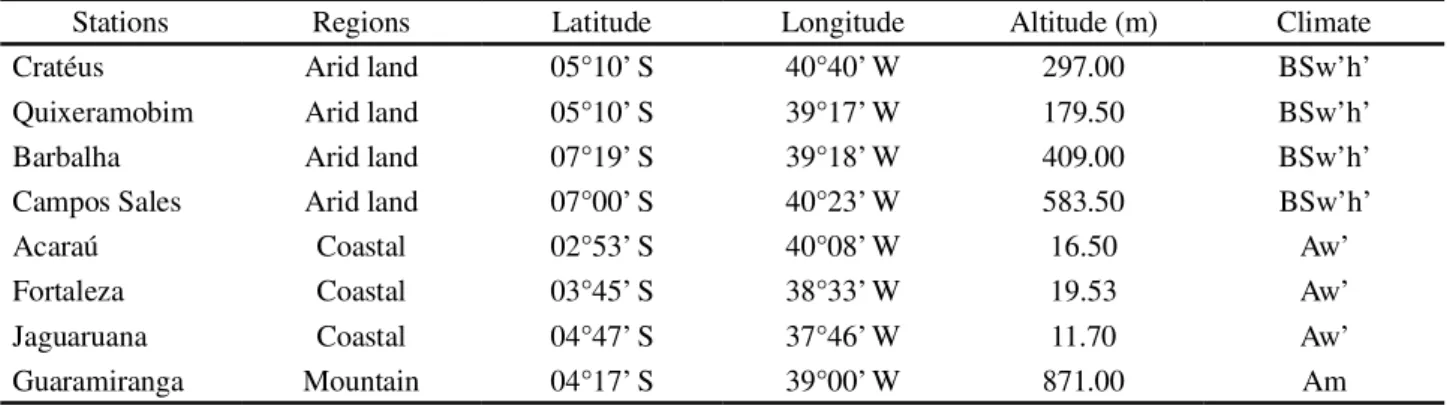
The dominant climate of the region, which comprises 80% of the State’s area, according to Koppen’s classification is semiarid - BSw’h’; the remaining 20% is almost entirely classified as sub-humid climate (Aw’) (coastal region). There are also small mountain regions where the climate is classified as Am (mountain climate) (TAB. 1).
Among the meteorological stations considered in this study, one is located in the city of Fortaleza, which has a population of 2.4 million people, and the other 7 stations are distributed in urban centers with populations of less than 40 thousand people. Although it is a metropolis, the city of Fortaleza was included in the study due to the fact that the station is situated in the Campus of the Universidade Federal do Ceará (area of 100 ha) in a place that has a great vegetated area without drastic alterations in its vicinities.
Data set
In order to identify changes in extreme air temperature monthly datasets (1961/2008) including absolute maximum and minimum temperatures measured two meters above the ground in eight meteorological stations throughout the Ceará State were employed. The
data was provided by the 3rd INMET district and by the
Universidade Federal do Ceará. The first part of the study was to investigate whether there were any missing data in the monthly time series. Any missing data in the data were filled by the value of the mode of the respective month. To investigate whether the extreme temperatures registered in the meteorological stations in the Ceará State are undergoing successive increases, as well as to quantify these increases, the annual increment of the maximum and minimum temperatures was determined in relation to the
Introduction
Since the start of the second half of the 20th century,
meteorological observations have been registering systematic increases in the air temperatures, both at the global and regional scales (SILVA, 2004). Research studies conducted in different
parts of the world (LEBASSI et al., 2009; LINKOSALO
et al., 2009; WALTERS et al., 2007) have identified that the increases in the minimum air temperatures are more significant than increases in the maximum air temperatures. The increases of air temperature occur in an asymmetric form, representing the effects of different global and regional agents (PITMAN; PERKINS, 2009) on the air temperature changes. The asymmetries of these changes have had significant impacts in many regions of the globe, while in other places no significant changes have been observed
(BONSALet al., 2001; PRIETOet al., 2004).
Anthropogenic action is being considered as the main reason for these changes (IPCC, 2007), both at the global (BALLESTERet al., 2010; VOSEet al., 2005) and regional
(BROHANet al., 2006; LOBELL; BONFILS, 2008) scales.
The best example of an anthropogenic effect on the local air temperature is the urban heat island effect, which has been investigated in different cities (KOLOKOTRONI;
GIRIDHARAN, 2008; LOPES et al., 2008; PEREIRA;
MORAIS, 2007). Unfortunately, many uncertainties still exist regarding the real cause responsible for generating these climatic changes that have been registered in the last two decades (SPENCER, 2010).
The projections of these changes indicate that the increase in air temperatures will promote climate changes that could affect the planet significantly, especially in regions of extreme temperatures, with a greater impact on the tropical regions and the less developed countries (IPCC, 2007). These changes in temperatures will promote alterations in the distribution of precipitation (MARENGOet al., 2009) and on the water availability (MARENGO; VALVERDE, 2007), which will have serious impacts for natural systems and
human life (HOMARet al., 2010; PETERSON, 2003).
Figure 1 - Studied area location
Table 1 - Identification of the meteorological stations
Stations Regions Latitude Longitude Altitude (m) Climate
Cratéus Arid land 05°10’ S 40°40’ W 297.00 BSw’h’
Quixeramobim Arid land 05°10’ S 39°17’ W 179.50 BSw’h’
Barbalha Arid land 07°19’ S 39°18’ W 409.00 BSw’h’
Campos Sales Arid land 07°00’ S 40°23’ W 583.50 BSw’h’
Acaraú Coastal 02°53’ S 40°08’ W 16.50 Aw’
Fortaleza Coastal 03°45’ S 38°33’ W 19.53 Aw’
Jaguaruana Coastal 04°47’ S 37°46’ W 11.70 Aw’
Guaramiranga Mountain 04°17’ S 39°00’ W 871.00 Am
median in each series, as well as to the five-year moving average. To investigate the tendency of the extreme values and the year when they occurred, the five highest values (95th percentile) and the five lowest values (5th percentile)
were considered for the three hottest months and the three coldest months recorded at each station. To quantify the increase in the rate of the extreme temperatures, of the best fit lines for the annual data were adjusted and parameter coefficients were tested at a 5% significant level.
Results and discussion
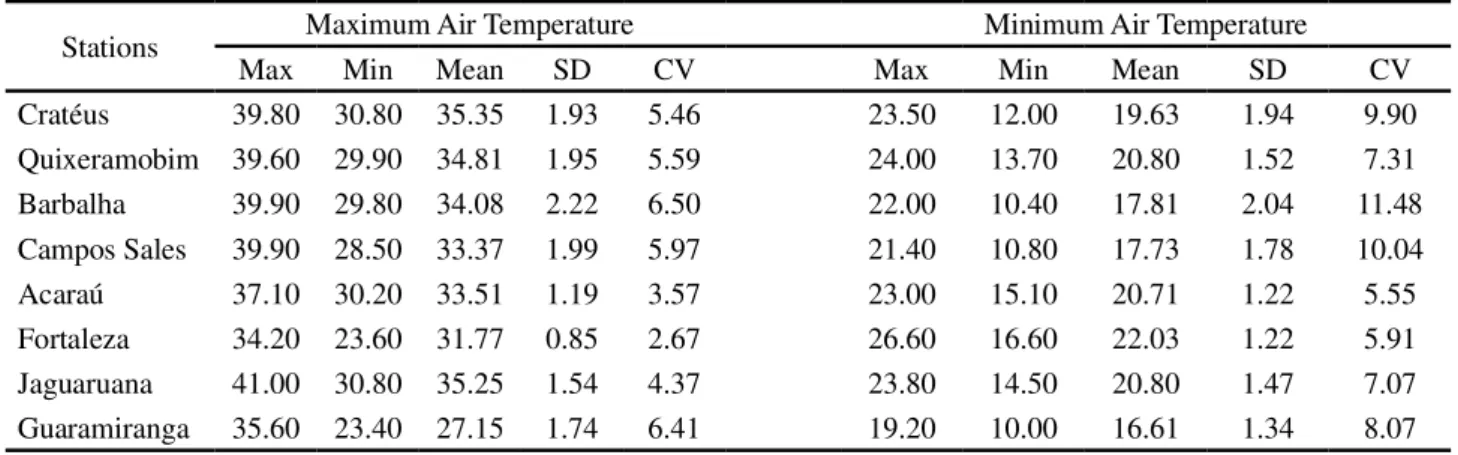
Stations Maximum Air Temperature Minimum Air Temperature
Max Min Mean SD CV Max Min Mean SD CV
Cratéus 39.80 30.80 35.35 1.93 5.46 23.50 12.00 19.63 1.94 9.90
Quixeramobim 39.60 29.90 34.81 1.95 5.59 24.00 13.70 20.80 1.52 7.31
Barbalha 39.90 29.80 34.08 2.22 6.50 22.00 10.40 17.81 2.04 11.48
Campos Sales 39.90 28.50 33.37 1.99 5.97 21.40 10.80 17.73 1.78 10.04
Acaraú 37.10 30.20 33.51 1.19 3.57 23.00 15.10 20.71 1.22 5.55
Fortaleza 34.20 23.60 31.77 0.85 2.67 26.60 16.60 22.03 1.22 5.91
Jaguaruana 41.00 30.80 35.25 1.54 4.37 23.80 14.50 20.80 1.47 7.07
Guaramiranga 35.60 23.40 27.15 1.74 6.41 19.20 10.00 16.61 1.34 8.07
Fortaleza station showed the lowest variability among studied stations, and that fact can be explained by the place where the station is sited (Campus of the Universidade Federal do Ceará). In the Campus, there are a great vegetated area (> 100 ha) without drastic alterations.
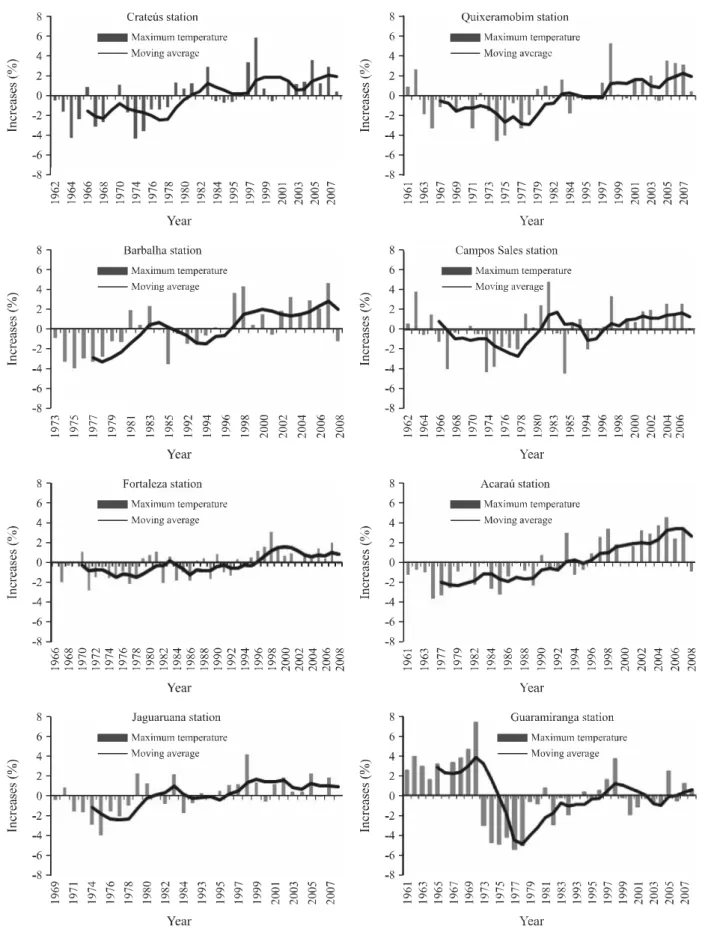
Maximum air temperatures
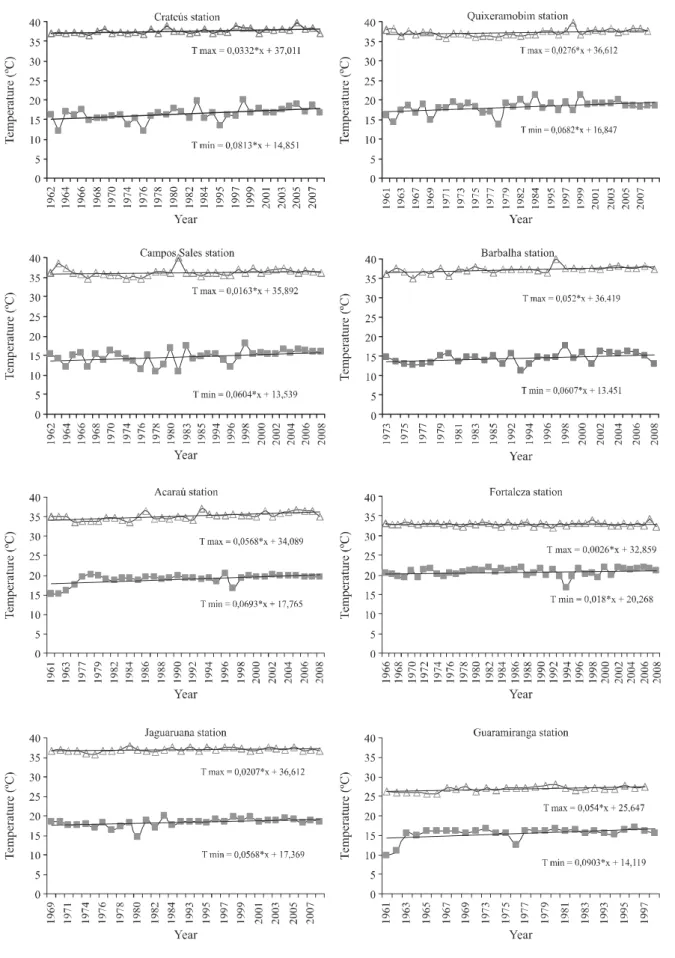
The registered temperatures in the eight studied stations clearly indicate an increase in the maximum temperatures, regardless of the geographical position (coastal, semiarid land or mountain). After the year 1996, the maximum temperatures were all above the median dataset temperatures for almost stations, and the increments were positively increasing (FIG. 2). Although the city of Fortaleza has a population of 2.4 million that is 60 times larger than the populations of the other urban centers, the temperature trends is similar to the other stations.
The urban heat island effect, defended by Peterson (2003), with respect to the temperatures in large urban centers (populations greater than 100,000), was not observed at the station in the city of Fortaleza city. This result can be explained by the location of the aforementioned station, which is installed at the Campus of the Universidade Federal do Ceará, where there is a considerable amount of vegetated area and an absence of nearby buildings. The absence of the urban island effect at the CCA/UFC meteorological station was also identified by Lopeset al. (2008), when a comparative study between the temperatures of two meteorological stations in two different places of the city was conducted.
In the studied period, the extremes in the annual averages of the maximums air temperatures were registered in 1998 and in 2007 (FIG. 2), with the four highest increments occurring during the last ten years. The highest increases occurred in the Crateús, Quixeramobim
Table 2 - Maximum, minimum, mean, SD (standard deviation) and CV (coefficient of variation) for the air temperature monthly datasets (1961/2008)
and Campos Sales stations located in the BSw’h’ climate region. The lowest increases were observed in the city of Guaramiranga, which is located in a region with a climate classified as Am. As for the stations located in Fortaleza, Acaraú and Jaguaruana, which are in the coastal region (sub-humid climate), the station in Acaraú registered the largest increases in temperature during the last decade.
The tendency towards an increase in temperature, as well as the smaller variability of the increments, can be observed in the five-year moving average. A systematic increase in temperature was observed in all eight studied stations, representing a tendency of the climatic changes in the region. In studies regarding the maximum and minimum temperatures in southern Brazil for the period of 1961 to 2002, Marengo and Valverde (2007) also identified tendencies for the increases of these temperatures, illustrating a continued heating of the south region of Brazil.
The Acaraú station (coastal region) exhibited the highest tendency for a systematic increase in the annual average of the maximum temperatures (FIG. 2), while the highest variability for the tendency of increase was verified for the stations in Campos Sales (semiarid climate) and Guaramiranga (mountain climate). This fact express that temperature changes are independent of the climatic classification. Also, it was observed that all stations exhibited a tendency toward an increase in temperature after the decade of the 90s. This is in accordance with the IPCC (2007), which commented that the increase of 0.65 °C in the average temperature of the globe was more evident after the start of that decade.
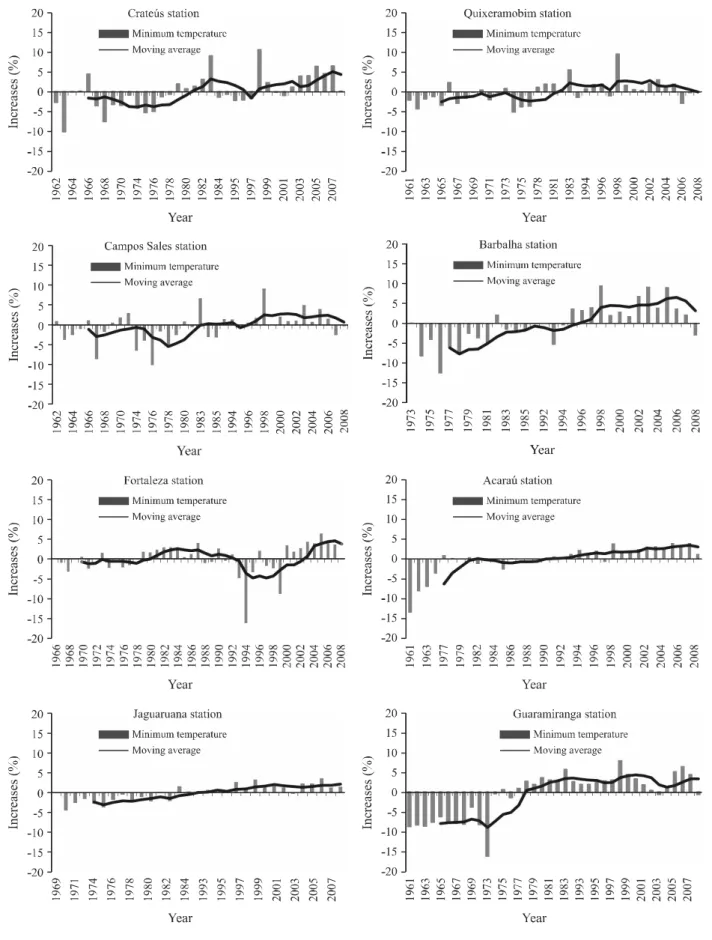
Minimum air temperatures
hottest year during the studied period. The same situation was observed for the maximum temperatures. Just as it did for the absolute maximums, the 90s decade exhibited absolute minimums above the normal average, and this tendency was confirmed in the 2000-2010 decade.
Among the four stations that represent the semiarid climate (Crateús, Quixeramobim, Campos Sales and Barbalha), the highest variations were observed for the station at Barbalha. Although the temperatures registered in the four stations may exhibit the same tendency, specific behaviors to each of them were observed. For example, there is a higher similarity among the registered temperatures in Quixeramobim and Campos Sales stations. The smallest variations in the annual average temperature (< 5%) were identified in the station of Jaguaruana, while the station of Guaramiranga exhibited the most number of years (22 in total) with annual averages above the median of dataset. In the last two decades, many researchers (LEBASSIet al., 2009; LOBELL; BONFILS, 2008; MARENGO; VALVERDE, 2007) have studied and discussed the influence of land use in the variations of air temperature.
With the exception of temperatures registered in the Fortaleza city, it was verified that after the year 1995, the annual minimum temperature averages were all above the average. This fact confirms what has been observed by other researchers in different parts of the
globe (FERRON et al., 2001; HOMAR et al., 2010;
KOLOKOTRONI; GIRIDHARAN, 2008).
The tendency toward systematic increases in the minimum temperatures can be confirmed by the five-year moving average (FIG. 3). In the last two decades, the moving average, with the exception of the minimum temperatures of Fortaleza, has been greater than the normal average for the minimum temperatures. The minimum temperatures of the Fortaleza station, although the population of the city is greater than 2.4 million people, do not point towards the urban heat island effect because there is no tendency towards a systematic increase in the minimum temperatures.
According to researchers such as Lebassiet al. (2009), Pereira and Morais (2007) and Walterset al. (2007), the increase in the minimum temperatures of the great urban centers that generate the urban heat island effect is a result of the greater retention of heat during the night due to a higher difficulty in the exchange of this heat. It is believed that this effect still does not exist at the Fortaleza station due to its location, the Universidade Federal do Ceará Campus, where there is an organized occupation of the space near the station.
Air temperature change
The best fit lines for each station (FIG. 4) reveal a tendency towards an increase in the maximum and minimum temperatures at rates varying from 0.0005
to 0.0568 °C year-1 for the maximums and from
0.018 to 0.0903 °C year-1 for the minimums. Except
to maximum temperatures registered in the Fortaleza station, all temperature rates were statically significant at a level of 5%.
Analysis of the three stations (Fortaleza, Acaraú, and Jaguaruana) representative of the coastal area revealed that the highest angular coefficients for maximum air temperatures were obtained for the station in Acaraú. The station in Fortaleza registered the lowest values (0.0005 and
0.0181 °C year-1) of maximum and minimum temperatures
rate increases, respectively. As for the stations located in the semiarid lands, the smallest rates of increase (0.0163
and 0.0604 °C year-1) for the maximum and minimum air
temperatures were registered in Campos Sales, respectively.
The highest rates (0.0813 °C year-1) of maximum air
temperature were obtained for the station in Crateús while the highest rates for minimum were identified in Barbalha station. These values confirm the high regional variability of the temperatures already observed in many different parts
of the globe (HERTIG; JACOBEIT, 2008; HOMARet al.,
2010; LEBASSIet al., 2009).
In addition, it was found that the station representative of the mountain region (Guaramiranga) registered an increased rate in the absolute minimum temperature of 0.0903 °C year-1, which corresponds to an
increase of 9.0 °C per century. Data such as these reveal an increase in the minimum temperatures that is greater than the increase in the maximum temperatures. Similar results were also observed by other researchers (JUNG et al., 2002; LADOCHYet al., 2007; VOSEet al., 2005), showing that although there is a high regional variability in the increase of temperature, the same tendency of an increase is evident in different parts of the globe.
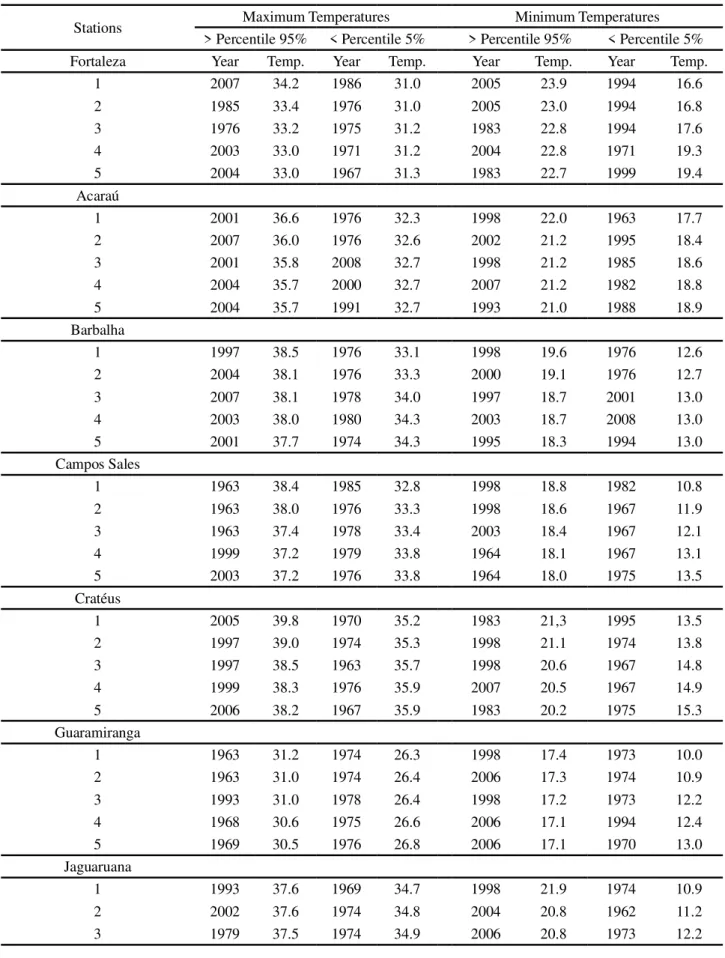
Another indicator of the detected increase in temperature is the fact that approximately 73% of
the extreme observations (values greater than the 95th
percentile) of the maximum temperatures were observed in the last two decades, with 50% of these occurring in the period of 2000-2008 (TAB. 3). It is also observable that 85% of the lowest values in the maximum temperatures were registered in the 1960s and 70s, revealing a gradual increase in the diurnal temperatures. The variation of air temperature is attributable to the expression of energy in the form of sensible heat present in the air.
Stations Maximum Temperatures Minimum Temperatures
> Percentile 95% < Percentile 5% > Percentile 95% < Percentile 5%
Fortaleza Year Temp. Year Temp. Year Temp. Year Temp.
1 2007 34.2 1986 31.0 2005 23.9 1994 16.6
2 1985 33.4 1976 31.0 2005 23.0 1994 16.8
3 1976 33.2 1975 31.2 1983 22.8 1994 17.6
4 2003 33.0 1971 31.2 2004 22.8 1971 19.3
5 2004 33.0 1967 31.3 1983 22.7 1999 19.4
Acaraú
1 2001 36.6 1976 32.3 1998 22.0 1963 17.7
2 2007 36.0 1976 32.6 2002 21.2 1995 18.4
3 2001 35.8 2008 32.7 1998 21.2 1985 18.6
4 2004 35.7 2000 32.7 2007 21.2 1982 18.8
5 2004 35.7 1991 32.7 1993 21.0 1988 18.9
Barbalha
1 1997 38.5 1976 33.1 1998 19.6 1976 12.6
2 2004 38.1 1976 33.3 2000 19.1 1976 12.7
3 2007 38.1 1978 34.0 1997 18.7 2001 13.0
4 2003 38.0 1980 34.3 2003 18.7 2008 13.0
5 2001 37.7 1974 34.3 1995 18.3 1994 13.0
Campos Sales
1 1963 38.4 1985 32.8 1998 18.8 1982 10.8
2 1963 38.0 1976 33.3 1998 18.6 1967 11.9
3 1963 37.4 1978 33.4 2003 18.4 1967 12.1
4 1999 37.2 1979 33.8 1964 18.1 1967 13.1
5 2003 37.2 1976 33.8 1964 18.0 1975 13.5
Cratéus
1 2005 39.8 1970 35.2 1983 21,3 1995 13.5
2 1997 39.0 1974 35.3 1998 21.1 1974 13.8
3 1997 38.5 1963 35.7 1998 20.6 1967 14.8
4 1999 38.3 1976 35.9 2007 20.5 1967 14.9
5 2006 38.2 1967 35.9 1983 20.2 1975 15.3
Guaramiranga
1 1963 31.2 1974 26.3 1998 17.4 1973 10.0
2 1963 31.0 1974 26.4 2006 17.3 1974 10.9
3 1993 31.0 1978 26.4 1998 17.2 1973 12.2
4 1968 30.6 1975 26.6 2006 17.1 1994 12.4
5 1969 30.5 1976 26.8 2006 17.1 1970 13.0
Jaguaruana
1 1993 37.6 1969 34.7 1998 21.9 1974 10.9
2 2002 37.6 1974 34.8 2004 20.8 1962 11.2
3 1979 37.5 1974 34.9 2006 20.8 1973 12.2
4 1997 37.5 1974 34.9 1995 20.7 1970 13.0
5 2003 37.4 1976 35.1 1983 20.5 1968 13.2
Quixeramobim
1 1998 39.6 1969 35.3 1998 22.8 1977 13.7
2 2003 38.1 1963 35.3 1983 22.0 1961 16.2
3 2006 38.1 1974 35.3 1983 21.5 1974 16.6
4 1961 37.9 1978 35.4 1998 21.5 1965 16.8
5 2001 37.8 1971 35.4 2004 21.5 1975 17.0
Occurrence after 1990 73% 78%
Occurrence after 2000 50% 40%
Occurrence before 1980 85% 65%
Continuação Tabela 3
area, resulting in a decrease of the quantity of energy used as latent heat of evapotranspiration.
Similar tendencies have been observed in different
parts of the globe (BONSALet al., 2001; LINKOSALOet
al., 2009; PITMAN; PERKINS, 2009). This change in the land use is pointed out by the document “Climate Change 2007: The Physical Science Basis” (IPCC, 2007) as the main reason for the increase in air temperature. As for the minimum air temperatures, approximately 78% of the values greater than the 95th percentile occurred in the last
two decades, and around 38% of these were registered in the period of 2000-2008 (TAB. 3).
The investigation also showed that 65% of the minimum temperatures less than the value equivalent to the 5th percentile occurred in the 1960s and 70s. Because
the minimum air temperatures occur due to the energy in transit from surface of the earth to the atmosphere in the form of sensible heat, the results point toward a reduction in these exchanges, consequently increasing the number of “hot” nights. Such a fact supports the notion that records of extreme air temperatures were initially for the minimums. The increase in the minimum temperatures on
both global (BALLESTERet al., 2010; VOSEet al., 2005)
and regional (BROHANet al., 2006; PRIETOet al., 2004)
scales has already been detected by several researchers.
Conclusions
1. The highest values for the maximum and minimum air temperatures for the studied area have been registered in the last 12 years. For the studied period, independent of the regional variations in temperatures, eight stations presented a common tendency in relation to annual rates of increase in the extreme temperatures. In other words, the
stations revealed an annual rate of increase in the minimum temperatures that is superior to that of the maximums, representing a higher retention of heat during the night; 2. The highest rates of increase per century were registered
for the minimum temperatures, for the stations of Guaramiranga and Crateús.
Acknowledgements
The authors would like to acknowledge the Instituto Nacional de Meteorologia (INMET) and the Universidade Federal do Ceará (UFC) for the concession of data, without which it would not have been possible to conduct the study presented here.
References
BALLESTER, J.; RODÓ, X.; GIORGI, F. Future changes in Central Europe heat waves expected to mostly follow summer mean warming. Climate Dynamics, 2009. <http://www. springerlink.com/content/50p7657r14056011/ p=709e198eefe 24bc596a7ecffc41f2680&pi=27>. Accessed: 10 may 2010. BONSAL, B. R. et al. Characteristics of daily and extreme temperatures over Canada. Journal of Climate, v. 14, n. 09, p. 1959-1976, 2001.
BROHAN, P.et al. Uncertainty estimates in regional and global observed temperature changes: a new data set from 1850.
Journal of Geophysical Research, v. 111, p. 1-3, 2006. FERRON, F. A.; SIMÕES, J. C.; AQUINO, F. E. Série temporal de temperatura atmosférica para a Ilha Rei George, Antártica.
HOMAR, V. et al. Recent trends in temperature and precipitation over the Balearic Islands (Spain). Climatic Change, v. 98, n. 01/02, p. 199–211, 2010.
INTERGOVENMENTAL PANEL ON CLIMATE CHANGE (IPCC). Summary for Policymakers. In: SOLOMON, S.et al.
Climate Change: the Physical Science Basis. Contribution of Working Group I to the Fourth Assessment Report of the Intergovernmental Panel on Climate Change. Cambridge: Cambridge University Press; New York: United Kingdom, 2007. JUNG, H. S.et al. Recent trends in temperature and precipitation over South Korea.International Journal Climatology, v. 22, n. 11, p. 1327–1337, 2002.
KOLOKOTRONI, M, GIRIDHARAN, R. Urban heat island intensity in London: An investigation of the impact of physical characteristics on changes in outdoor air temperature during summer.Solar Energy, v. 82, n. 11, p. 986-998, 2008.
LADOCHY, S.; MEDINA, R.; PATZERT, W. Recent California climate variability: Spatial and temporal patterns in temperature trends.Climate Resource, v. 33, n. 02, p. 159–169, 2007. LEBASSI, B.et al. Observed 1970–2005 Cooling of Summer Daytime Temperatures in Coastal California. Journal of Climate, v. 22, n. 13, p. 3558-3573, 2009.
LINKOSALO, T.et al. The time series of flowering and leaf bud burst of boreal trees (1846–2005) support the direct temperature observations of climatic warming. Agricultural and Forest Meteorology, v. 149, n. 03/04, p. 453-461, 2009.
LOBELL, D. B.; BONFILS, C. The effect of irrigation on regional temperatures: A spatial and temporal analysis of trends in California, 1934-2002.Journal Climate, v. 21, n. 10, p. 2063-2071, 2008.
LOPES, J. F. B.et al.Tendência de mudanças da temperatura em Fortaleza, Ceará.In: WORKSHOP INTERNACIONAL DE INOVAÇÕES TECNOLÓGICAS NA IRRIGAÇÃO, 2., 2008, Fortaleza.Anais... Fortaleza: UFC, 2008.
MARENGO, J. A. et al. Future change of temperature and precipitation extremes in South America as derived from the
PRECIS regional climate modeling system. International Journal of Climatology, v. 29, p. 2241-2255, 2009.
MARENGO, J. A. Vulnerabilidade, impactos e adaptação à mudança do clima no semi-árido do Brasil. Brasília: Parcerias Estratégicas, 2008.
MARENGO, J. A.; VALVERDE, M. C. Caracterização do clima no Século XX e cenário de mudanças de clima para o Brasil no século XXI usando os modelos do IPCC-AR4.
Revista Multiciência, v. 08, p. 5-28. 2007.
PEREIRA, P.; MORAIS, L. Clima urbano e evolução da temperatura estival em Lisboa no século xx. Tendência, número de noites quentes e amplitude térmica diária.
Finisterra, v. 42, n. 83, p. 109-126. 2007.
PETERSON, T. C. Assessment of urban versus rural in situ surface temperatures in the contiguous United States: no difference found.
Journal of Climate, v. 16, p. 2941–2959, 2003.
PITMAN, A. J.; PERKINS, S. E. Global and Regional Comparison of Daily 2-m and 1000-hPa Maximum and Minimum Temperatures in Three Global Reanalyses.Journal of Climate,
v. 22, n. 17, p. 4667-4681, 2009.
PRIETO, L. et al. Minimum extreme temperatures over Peninsular Spain. Global and Planetary Change, v. 44, n. 01/ 04, p. 59–71, 2004.
SILVA, V. P. R. On climate variability in Northeast of Brazil.
Journal of Arid Environments, v. 58, n. 04, p. 575-596, 2004. SPENCER, R. W.The Great Global Warming Blunder: how
Mother Nature Fooled the World’s Top Climate Scientists. New Yourk: Encounter Books, 2010.