Genetic characterization of ninety elite soybean cultivars
using coefficient of parentage
Zilda de Fátima Sgobero Miranda(1), Carlos Alberto Arrabal Arias(2), Cássio Egidio Cavenaghi Prete(1), Romeu Afonso de Souza Kiihl(3), Leones Alves de Almeida(2), José Francisco Ferraz de Toledo(2) and Deonisio Destro(1)
(1)Universidade Estadual de Londrina, Dep. de Agronomia, Caixa Postal 6001, CEP 86051-990 Londrina, PR, Brazil. E-mail: [email protected], [email protected], [email protected]. (2)Embrapa Soja, Caixa Postal 231, CEP 86001-970 Londrina, PR, Brazil. E-mail: [email protected], [email protected], [email protected] (3)TMG Tropical Melhoramento e Genética, Caixa Postal 387, CEP 86183-600 Cambé, PR, Brazil. E-mail: [email protected]
Abstract – The objective of this work was to estimate the coefficient of parentage and to understand the genetic structure of 90 elite soybean cultivars, which are adapted to different Brazilian environments. A total of 4,005 coefficients of parentage (f) were obtained and used to group the cultivars by UPGMA method. The constructed dendrogram showed several related cultivar groups which shared similar ancestors and clearly showed the genetic structure of the main Brazilian cultivars. Effective population sizes (Ne) were also estimated for cultivars in different generations. The average f = 0.2124 value, obtained from cultivars classified into four decades according to the release year, suggested effective soybean population sizes of 11 and 13 calculated using arithmetic and weighted means, respectively. The relatively small Ne and the high parentage coefficient support the conclusion that there is a high similarity degree among the main soybean cultivars in Brazil.
Index terms: Glycine max, effective population size,genetic similarity, parentage coefficient.
Caracterização genética de noventa cultivares elites de soja
por meio do coeficiente de parentesco
Resumo – O objetivo deste trabalho foi estimar o coeficiente de parentesco e conhecer a estrutura genética de 90 cultivares elites de soja adaptadas aos diferentes ambientes brasileiros. Foram obtidos 4.005 coeficientes de parentesco (f), os quais foram utilizados para realizar o agrupamento das cultivares, pelo método UPGMA. O dendrograma formado permitiu observar vários grupos de cultivares que se aproximaram por possuírem an-cestrais comuns, e mostra a estrutura genética das principais cultivares indicadas para o Brasil. Foi estimado também o tamanho efetivo populacional (Ne) de cultivares em diferentes gerações. O valor de f calculado (f = 0,2124) comparado com as médias ponderada e aritmética das cultivares organizadas segundo os períodos de lançamento durante quatro décadas revela que o Ne para a soja é de 11 e 13, para a média aritmética e ponderada, respectivamente. O Ne relativamente pequeno e o alto coeficiente de parentesco sustenta a conclusão de que existe alto grau de similaridade entre as principais cultivares de soja indicadas para o Brasil.
Termos para indexação: Glycine max, similaridade genética, tamanho efetivo populacional.
Introduction
Soybean genetic breeding started recently in Brazil compared to other species of economic importance, but its contribution to the Brazilian agriculture has been very significant. The increase in yield in the traditional cropping regions, the expansion of the agricultural frontier, incorporating areas of the “Cerrados” as productive lands, and the increase of crop rotation are unquestionable results of the benefit obtained by creating new cultivars that are higher yielding and better adapted to these regions (Hiromoto, 1996).
The breeder has two choices when selecting parents for hybridization. The first is to maximize recombination, choosing genetically distant parents that have traits of interest, to obtain a recombinant population with wide genetic variability, increasing the chances to find genotypes that favorably combine these traits. The second choice is to minimize recombination using backcrossing for hybridization, selecting the donor parent among cultivars which are similar to the recurrent parent and carriers of the desirable trait for transfer.
coefficient of parentage. Gizlice et al. (1993) studied soybean cultivars released between 1947 and 1988 and obtained mean parentage coefficients of 0.164 and 0.234 for cultivars from North and South of the United States, respectively. Similar results were obtained by Sneller et al. (1997), also with elite cultivars from North and South of United States. Cui et al. (2000) reported a mean coefficient of parentage of only 0.02 among Chinese soybean cultivars, which is considered a very low value and indicates high genetic diversity in this germplasm. In India, Bharadwaj et al. (2002) analyzed the coefficient of parentage of 66 cultivars released from 1968 through 2000 and concluded that 10 ancestral cultivars contributed with 72.6% of the gene pool. Cultivar Bragg was parent of 15 of the 66 investigated cultivars. Based on these results the authors concluded that the Indian soybean germplasm has a narrow genetic basis. Choi et al. (1999) showed that the average distances among improved soybean cultivars are usually smaller than that among wild soybean.
In Brazil, Vello et al. (1988) calculated the parentage coefficient for each paired combination including 69 soybean cultivars indicated for Brazil conditions and reported a mean value of 0.16. Bonato (2000) developed a similar study including 100 soybean cultivars released since 1984 and obtained a mean value of 0.21. Miranda (2005), working with 457 Brazilian cultivars, reported a mean coefficient of parentage of 0.178. Those values were considered high and the authors suggested the use of genotypes with low parentage coefficient to increase genetic diversity.
The objective of this work was to evaluate the available genetic variability among parents for crossing, using estimatives of the coefficient of parentage, and to understand the genetic structure of 90 cultivars adapted to different Brazilian environments.
Material and Methods
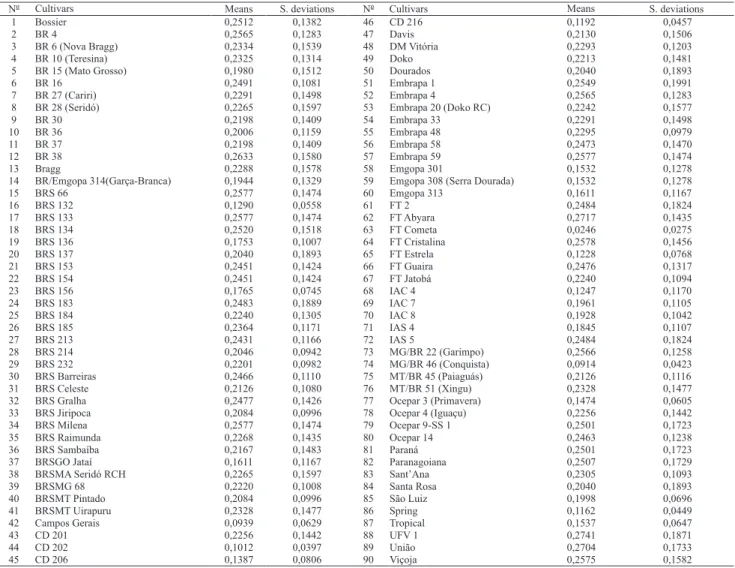
Ninety cultivars indicated by different companies and adapted to the several Brazilian environments were used (Table 1). They were selected according to their commercial success, adaptation and yield potential. The genealogies were obtained from diverse sources including technical documents, folders on released cultivars, and publications on the subject, as well as commom knowledge. Their genetic similarity was obtained by the coefficient of parentage (f) of each pair of cultivars calculated by the PROC INBREED of the SAS.
The coefficient of parentage was assumed zero (f = 0) in the absence of any degree of kinship and one (f = 1) when there is maximum degree of kinship. In this work the coefficients of parentage between two cultivars was considered one (f = 1) if three or more backcrosses were used to derive one parent from the other. The mean and standard error of the coefficient of parentage for each cultivar and the general mean of all cultivars were calculated (Table 2).
The 90 cultivars were grouped in the NTSYS (Rolf, 1998) by using the UPGMA method (Unweighted Pair-Group Method Arithmetical Means) based on their coefficient of parentage.
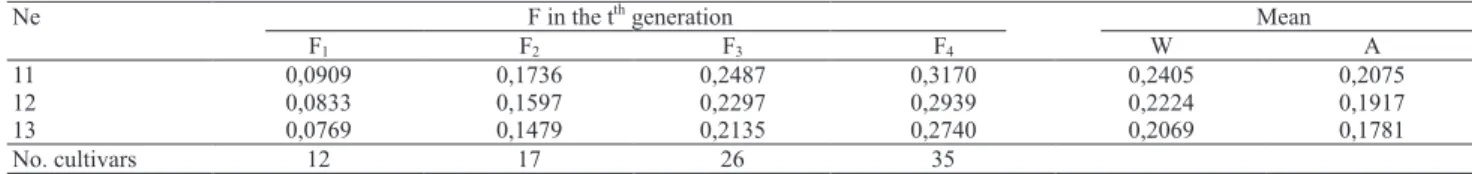
The St. Martin expression, quoted by Vello et al. (1988), which related the effective population size (Ne) to the coefficient of parentage for each t recombination cycle {Ft = 1/N + [(N - 1)/N]Ft-1} was used to estimate Ne. The expected F values were calculated for the different population sizes considering four generations of ten years each, starting in 1965. In sequence, the weighted and arithmetical means of three and four cultivar cycles were calculated to compare with the F value obtained in this study. The weighted mean was calculated assuming that 13.3% of the total of cultivars belonged to the 1st cycle (F
1), 18.9% to the 2nd cycle (F2), 28.9% to the 3rd cycle (F3) and 38.9% to the 4th cycle (F
4).
Results and Discussion
The 4,005 coefficients of parentage (f) estimated among the 90 cultivars ranged from 0 to 1. A total of 14 pairs of cultivars showed f = 0, which indicated maximum divergence, including: Campos Gerais and Bossier; Campos Gerais and BRS Celeste; Campos Gerais and Embrapa 20 (Doko RC) and, IAC 4 and FT Cometa. Cultivar Campos Gerais presented the largest number of cultivar pairs which comprised f = 0 (seven pairs). Out the 4,005 coefficients of parentage estimated, 124 presented f = 1, which indicated that two cultivars had the same genetic origin, including Embrapa 4 and BR 4; Embrapa 33 and BR 27 (Cariri); BRSMA Seridó RCH and BR 28 (Seridó); Dourados and Santa Rosa; Paraná and Paranagoiana and, UFV 1 and Viçoja. Results of the last three cultivar pairs were also reported by Vello et al. (1988) in a similar study carried out with 69 cultivars.
calculated (Table 2). These statistics positioned the cultivar kinship average and spread in relation to all others. The lowest values (0.0246±0.0275) were observed for the FT Cometa cultivar and the highest (0.2741±0.1871) were observed for the UFV 1 cultivar. The overall mean and standard deviation of f was 0.2124±0.1276. This value is higher than the 0.16 obtained by Vello et al. (1988) and the 0.178 reported by Miranda (2005). These two authors used practically all available soybean cultivars indicated by different companies without considering their commercial impact. This work
evaluated only successful cultivars selected into the same group studied by Miranda (2005). So, the mean f values increased from 0.178 to 0.212, showing that this group of elite cultivars presents a more restricted genetic basis. A lower f value would be expected among the recent cultivars because diverse sources of resistance genes were used intensively against important diseases, such as stem canker (for example, the cultivars BRS 232 and BRS 184) and soybean cyst nematode ('BRS Jiripoca' and 'BRSMT Pintado') in Brazilian soybean breeding programs. On the other hand, the higher f could have
stemmed from the introgression of the resistance genes often performed on elite cultivars by backcrossing. It could also have stemmed from the restricted number of cultivars included in this study, which sampled germplasm derived by backcrossing and germplasm closely related to other successful cultivars.
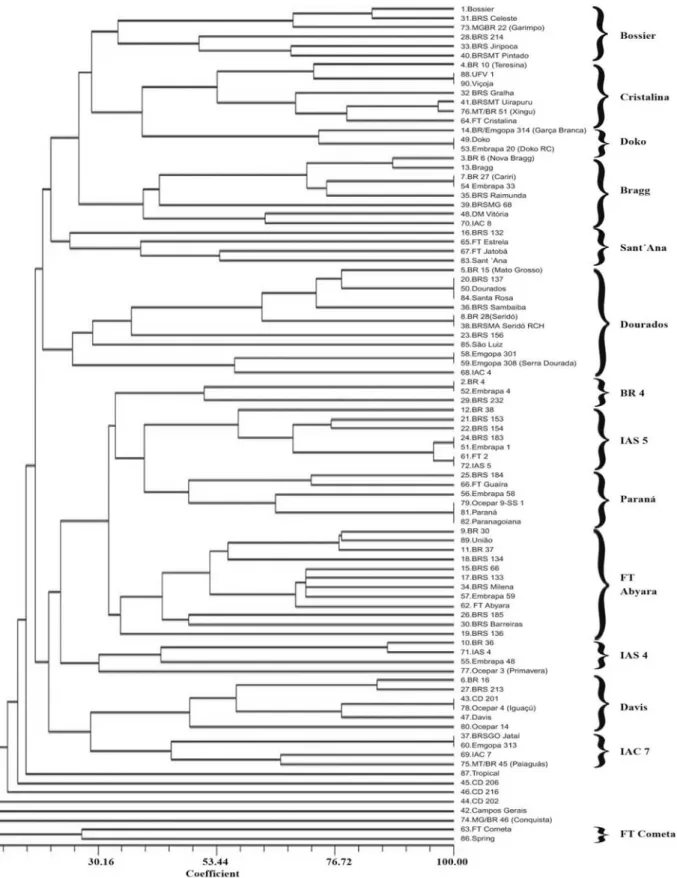
During crossing programs, plant genetic improvement endeavors to generate variability to enable the combination of desirable traits from different parents. In this study, the coefficients of parentage of the 90 cultivars were grouped by the UPGMA method to better visualize the genetic structure of the main Brazilian cultivars, which is shown in the form of a dendrogram (Figure 1). The several formed groups depicted some cultivars that are close because they share a common ancestor, such as the case of Bossier that grouped with six cultivars.
The group formed by cultivar Bossier included 'BRS Celeste' with 83% similarity, which decreased to 71% when the cultivar MG/BR 22 (Garimpo) was included. It also involved cultivars BRS Jiripoca and BRSMT Pintado with 70% similarity. The group similarity decreased to 49% when 'BRS 214' was included. Cultivar BRS 214 is not resistant to soybean cyst nematode but has resistant sources as 'Sharkey' and 'Hartwig' in its genealogy (Table 1), which justify the presence in this group.
Another group was formed by cultivar Cristalina involving the pair 'UFV 1' and 'Viçoja' with 100% similarity. Group similarity decreased to 73% when cul-tivar BR 10 (Teresina) was included. Next in this group were cultivars BRSMT Uirapuru and MT/BR 51 (Xingu) with 97% similarity, which decreased to 80 and 71%, respectively, when cultivars FT Cristalina and
BRTS Gralha were added. The next group was formed by cultivars Doko and Embrapa 20 (Doko RC) with 100% similarity, which decreased to 73% when 'BR/Emgopa 314' (Garça-Branca) was grouped together. This group joined the Cristalina group with 40% similarity and the Bossier group with 30% similarity.
The following group stemming from cultivar Bragg included 'BR 6' (New Bragg) with 88% similarity. In the same group, 'BR 27' (Cariri) and 'Embrapa 33' showed 100% similarity. Cultivars BRS Raimunda, BRSMG 68, DM Vitória and IAC 8, which were also part of this group, had similarities ranging from 64 to 40%. The group of cultivar Sant´Ana was identified next, and included cultivars BRS 132, FT Estrela, FT Jatobá and Sant´Ana, whose similarity ranged from 54 to 24%.
A large group formed around the cultivar Dourados showed three cultivars: BRS 137, Dourados and Santa Rosa, with 100% similarity. In the group, 'BR 28' (Seridó) clustered with 'BRSMA Sambaíba' and 'Emgopa 301' with 'Emgopa 308' (Serra Dourada). The other cultivars in the group, such as BR 15 (Mato Grosso), BRS Sambaíba, BRS 156, São Luiz and IAC 4, had similarities ranging from 78 to 57%. In the next group, the cultivars clustered around 'BR 4' that showed 100% similarity with 'Embrapa 4'. The group similarity decreased to 50% when cultivar BRS 232 was included. The next group identified as IAS 5 was formed by seven cultivars, including two 100% similarity pairs, 'BR 183' and 'Embrapa 1', and 'FT2' and 'IAS 5'. These two pairs regrouped with 95% similarity, and when cultivars BR 38, BRS 153 and BRS 154 were included, the group similarity decreased to 58%. Cultivar Paraná grouped with five others and showed 100% similarity with 'Ocepar 9-SS 1' and 'Paranagoiana'. When cultivars BRS 184, FT Guaira and Embrapa 58 were added to the group, the similarity ranged from 73 to 48%.
The following group formed by 'FT Abyara' included the cluster formed by the sister cultivars BRS 66, BRS 133, BRS Milena and Embrapa 59 with 72% similarity. When cultivar FT Abyara was added, the
group similarity fell to 70%. In sequence, cultivars BR 30 and União grouped with 78% similarity, which decreased to 77% when 'BR 37' was included. The similarity of other cultivars such as BRS 134, BRS 185, BRS Barreiras as well as BRS 136 ranged from 56 to 35%. These cultivars joined the Paraná, IAS 5 and BR 4 groups to form a larger cluster with similarity of approximately 32%. The next group formed by cultivar IAS 4 included BR 36 and IAS 4 with 87% similarity, which decreased to 42% when Embrapa 48 was grouped together.
In the group formed by cultivars with Davis genealogy, the pair BR 16 and BRS 213 showed 85% similarity. The pair 'CD 201' and 'Ocepar 4' (Iguaçu) showed 100% similarity, which decreased to 78%, when 'Davis' was included in the group, and to 48%, when the 'Ocepar 14' was included. The group formed by cultivar IAC 7 was the next, comprising the pair 'BRSGO Jataí' and 'Emgopa 313' as well as the pair 'IAC 7' and 'MT/BR 45' (Paiaguás), showing 100 and 78% similarity, respectively. When these two pairs were joined, the group similarity decreased to 44%. Some cultivars did not belong to any group, such as Tropical and MG/BR 46 (Conquista). The last group was formed by only two cultivars, FT Cometa and Spring, that showed 26% similarity.
Selecting parents with lower similarity allows expression of larger genetic variability in the derived populations and improves the chances of selecting desirable traits, both qualitative and quantitative. Thus, crosses involving genotypes belonging to more distant groups must produce populations with greater genetic variability (Figure 1).
However, in backcrossing programs, high agronomic similarity is sought among parents for selection of specific qualitative traits to correct some shortcoming, for example, susceptibility to a certain disease. Therefore, the breeder can choose genetically closer genotypes according to the available information in Figure 1.
The values estimated for f considering different effective sizes (Ne 11 to 13) for cultivars in different generations are presented in Table 3. When the
calculated f value (f = 0.2124) was compared with the weighted and arithmetical means obtained from the four cycles or generations of cultivars, effective population size for soybean is between 11 and 13. Considering that most of the cultivars were recommended in the last decade, the greater value of Ne = 13 should better represent reality. When these values are compared with those reported by Vello et al. (1988) and Miranda (2005) of 11 to 15 and 13 to 16, respectively, in similar studies, it could be verified that the effective population size, considering the main soybean cultivars released in Brazil, has decreased a little.
Considering that only cultivars of greater economic importance were included, the reduction in the effective size was not as significant as expected. The introgressions of genotypes with resistance to stem canker and soybean cyst nematode may have contributed to maintenance of the effective population size for soybean in Brazil.
Conclusions
1. The group of 90 elite cultivars studied has a restricted genetic variability in relation to the whole set of cultivars indicated in Brazil.
2. The effective population size among the 90 elite Brazilian soybean cultivars is small.
3. The dendrogram shows the genetic structure of the 90 Brazilian soybean cultivars, and can help breeders choose parents for soybean breeding programs.
Acknowledgements
To Universidade Estadual de Londrina and Conselho Nacional de Desenvolvimento Científico e Tecnológico, for the financial support.
References
BHARADWAJ, C.H.; TARA SATYAVATHI, C.; TIWARI, S.P.; KARMAKAR, P.G. Genetic base of soybean (Glycine max) varieties released in India as revealed by coefficient of parentage. Indian Journal of Agricultural Science, v.72, p.467-469, 2002.
BONATO, A.L.V. Avaliação da diversidade genética entre cultivares brasileiras de soja, através de marcadores AFLP. 2000. 89p. Tese (Doutorado) - Escola Superior de Agricultura Luiz de Queiroz, Piracicaba.
CHOI, I.-Y.; KANG, J.-H.; SONG, H.-S.; KIM, N.-S. Genetic diversity measured by simple sequence repeat variations among the wild soybean, Glycine soja, collected along the riverside of five major rivers in Korea. Genes and Genetic Systems, v.74, p.169-177, 1999.
CUI, Z.L.; CARTER JUNIOR, T.E.; BURTON, J.W. Genetic base of 651 Chinese soybean cultivars released during 1923 to 1995. Crop Science, v.40, p.1470-1481, 2000.
GIZLICE, Z.; CARTER JUNIOR, T.E.; BURTON, J.W. Genetic diversity in North American soybean. II. Prediction of heterosis in F2 populations of southern founding stock using genetic similarity
measures. Crop Science, v.33, p.620-626, 1993.
HIROMOTO, D.M. Seleção de genótipos de soja para performance agronômica e resistência a Heterodera glycines
Ichinohe e Diaporthe phaseolorum f.sp. meridionalis Morgan-Jones. 1996. 84p. Tese (Doutorado) - Escola Superior de Agricultura Luiz de Queiroz, Piracicaba.
MIRANDA, Z.F.S. Base genética de cultivares de soja no Brasil. 2005. 871p. Tese (Doutorado) - Universidade Estadual de Londrina, Londrina.
ROHLF, F.J. NTSYS: numerical taxonomy and multivariate analysis system. 2nd ed. Stony Brook: Exeter Software, State University of
New York, 1998. 1 CD-ROM.
SNELLER, C.H.; MILES, J.W.; HOYT, J.M. Agronomic performance of soybean plant introductions and their genetic similarity to elite lines. Crop Science, v.37, p.1595-1600, 1997.
VELLO, N.A.; HIROMOTO, D.M.; AZEVEDO FILHO, A.J.B.V. Coefficient of parentage and breeding of Brazilian soybean germplasm. Revista Brasileira de Genética,v.11, p.679-697, 1988.